PDF attached


Morning.
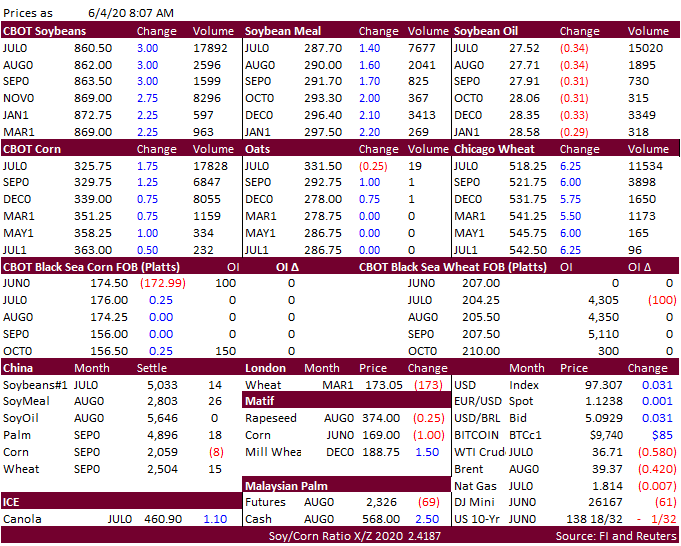
24-hour sale announced-120,000 tons of soybeans to unknown. US soybean are competitive.  USDA export sales were positive.  USD sold off after the EU announced another stimulus package.  China sold corn out of reserves. FAO sees global wheat production well
below USDA’s outlook. 


Weather


UNITED
STATES

  • No
    serious changes from Wednesday’s outlook were noted overnight
  • Tropical
    storm Cristobal was inland over the Yucatan Peninsula this morning and very disorganized

    • The
      storm will move into the central Gulf of Mexico this weekend and regain integrity
    • The
      storm’s deepest convection will be in its eastern sector and when the center of the system reaches Louisiana much of the greatest rain will fall in southern Alabama, southern Georgia and parts of Florida while rain associated with the storm center will be
      more concentrated over a very narrow region
    • Cristobal
      will move through Louisiana and then up through Arkansas to Missouri, Wisconsin and parts of Illinois early next week where locally heavy rain is expected
  • Cooler
    and drier air will follow the storm through the Midwest next week followed by a new ridge of high pressure in the Plains around mid-month that breaks down after only a few days


The
bottom line is a mostly good mix of weather for key U.S. crop areas during the next two weeks. There is some concern for dryness in North Dakota, eastern Montana, southeastern Saskatchewan and southwestern Manitoba and this area will possibly be missed by
two rain events in the coming week and the ground is already dry. A closer watch on the region is warranted since any additional missed rain events could lead to some significant crop stress. Dryness will also continue in the a part of the southern Plains
with very little West Texas rainfall potential.


EUROPE/BLACK
SEA

  • No
    serious changes in weather were noted overnight for the next couple of weeks

    • There
      is still some concern about rainfall in the U.K. and northwestern France, although both areas will get some rain to temporarily ease dryness
    • Net
      drying is expected in southern and eastern Ukraine and rainfall in Russia’s Southern region may be limited for a while

      • These
        trends were already advertised earlier this week
    • Rain
      is plentiful across the remainder of Europe and the western CIS over the next ten days with a little less frequent and less significant rain thereafter
  • Temperatures
    will be cooler biased in western Europe over the coming week and near to above average in eastern Europe and especially the western CIS


EASTERN
RUSSIA NEW LANDS

  • No
    changes were noted overnight

    • Siberia
      gets most of the significant rain east of the Ural Mountains
    • Most
      other areas from the Ural Mountains to the western Fringes of Siberia will receive restricted amounts of rain during the next couple of weeks

      • Temperatures
        should be in a seasonable range on average during the next two weeks
      • Gradual
        drying is likely


CHINA

  • The
    European model run is drier today for Henan and Shanxi while still drier biased for Shandong and Hebei
  • The
    06z GFS model run is still advertising rain south of the Yellow River in Henan, northern Anhui, southern Shandong and parts of Jiangsu for early to mid-week next week which is little changed from the 00z model run and similar to Wednesday’s forecast model
    runs
  • 06z
    GFS model run is drier for areas near and north of the Yellow River and those areas are advertised to be drier biased for the next two weeks
  • A
    favorable mix of weather is still advertised for northeastern China over the next two weeks
  • Southern
    China continues to battle excess moisture and frequent rain, but there are some “brief” periods of drier weather expected in the next two weeks


Overall
the bottom line leaves some concern about areas near and north of the Yellow River being too dry over the next two weeks and World Weather, Inc. is not convinced that “good” rain will fall across Henan, northern Anhui, southern Shandong or northern Jiangsu,
although it does look as though these areas will get some rain briefly during the early to middle part of next week. The moisture will be very important for crops in Henan and northern Anhui which are experiencing drought conditions, according to the Chinese
drought monitor.

Source:
World Weather Inc. and FI


Source:
World Weather Inc. and FI


Source:
World Weather Inc. and FI


Seven-day
outlook:


Bloomberg
Ag Calendar

THURSDAY,
June 4:

  • USDA
    weekly crop net-export sales for corn, soybeans, wheat, cotton, 8:30am
  • FAO
    world food price index, 4am
  • Port
    of Rouen data on French grain exports
  • New
    Zealand commodity price

FRIDAY,
June 5:

  • ICE
    Futures Europe weekly commitments of traders report on coffee, cocoa, sugar positions
  • CFTC
    commitments of traders weekly report on positions for various U.S. futures and options, 3:30pm
  • FranceAgriMer
    weekly update on crop conditions
  • Malaysia’s
    palm oil export data for June 1-5

Source:
Bloomberg and FI


USDA
Export Sales

No
surprises.  US soybean oil shipments were very good and meal commitments were at the high end of expectations.  Sorghum sales were 93,300 tons and pork sales just over 17,000 tons.  China posted an increase in pork sales of 3,400 tons.


Macros

<![if !supportLists]>·
<![endif]>The European Central Bank approved yet more stimulus on Thursday to prop up an economy plunged by the coronavirus pandemic into its biggest recession since World War Two.

<![if !supportLists]>·
<![endif]>US Initial Jobless Claims May 30: 1877K (est 1833K; prev 2123K)

<![if !supportLists]>·
<![endif]>US Continuing Claims May 23: 21487K (est 20000K; prev 21052K)

<![if !supportLists]>·
<![endif]>US Nonfarm Productivity Q1 F: -0.9% (est -2.7%; prev -2.5%)

<![if !supportLists]>·
<![endif]>US Unit Labour Costs Q1 F: 5.1% (est 5.0%; prev 4.8%)

<![if !supportLists]>·
<![endif]>US Trade Balance (USD) Apr: -49.4B (est -49.2B; prev -44.4B)


Corn.

<![if !supportLists]>·
<![endif]>Corn futures

are
higher on technical buying and higher soybeans & wheat. 

<![if !supportLists]>·
<![endif]>USDA export sales of 637,500 tons were within expectations.

<![if !supportLists]>·
<![endif]>China is not likely to buy US corn anytime soon as they continue to nearly sell out in their weekly corn auction.

<![if !supportLists]>·
<![endif]>US ethanol production increased for the fifth consecutive week to 765,000 barrels per day, up 41,000 from the previous week.  This was below a Bloomberg estimate of 60,000, but still a positive news for corn bulls.  US ethanol
stocks fell 700,000 to 22.476 million barrels.  Traders were looking for a 130,000-barrel decrease.  In mid-April ethanol stocks were 27.689 million barrels.

<![if !supportLists]>·
<![endif]>USDA reported eggs set in the US down slightly and  chicks placed in the US down 3 percent.  Cumulative placements from the week ending January 4, 2020 through May 30, 2020 for the United States were 4.07 billion. Cumulative placements
were down slightly from the same period a year earlier.


Corn
Export Developments


  • China
    sold nearly 4 million tons (nearly 12 so far this season) of 2015 corn at an average price of 1,795 yuan per tons.
  • Syria
    will retender for 50,000 tons of soymeal and 50,000 tons of corn on June 24 for delivery within four months of contract.


Soybean
complex
.

    • Low
      prices tend to correct a market. Soybeans are near a 3-week high by trading 2 cents higher at the time this was written, meal slightly higher and soybean oil continued to slide amid lower palm oil prices.  US Gulf soybeans are cheaper than Brazil, and this
      is attracting business this week, including private Chinese buyers.  US soybeans out of the Gulf are about $15-17 cheaper than FOB Paranagua.
    • USDA
      export sales for soybean meal were a large 558,917 tons, second highest for the crop-year behind 641,919 tons on January 16, 2020.  They were at the higher end of the trading range.  Majority of the sales were for the Philippines (see text after the wheat
      comment). 
    • Soybean
      export sales of 495,200 old crop and 607,400 tons new-crop were within expectations when combined.  China took 201,000 tons of old crop (included decrease of one cargo) and 264,000 tons of new-crop.
    • Soybean
      oil sales were a low 9,400 tons but shipments were very good at 75,900 tons.
    • After
      the close yesterday, a WSJ headline said China cancelled some US farm shipments.  This includes an estimated 23 cargoes. The article quoted a shipping executive stating, “They were looking at 23 American soybean cargoes last week, but held off.” In our opinion,
      we will see some light pork, corn and possibly soybean cancellations but it appears they didn’t buy the 23 cargoes in the first place.
    • The
      BRL was down 0.3% against the USD at the time this was written at 5.0490.
    • Rotterdam
      values this morning showed soybean oil down 5 euros, rapeseed oil down 5, and soybean meal when imported from South America up 2-4.


  • Offshore
    values this morning were leading CBOT soybean oil 19 points lower and meal $0.40 higher.


<![if !supportLists]>·
<![endif]>China

<![if !supportLists]>·
<![endif]>China cash crush margins as of this morning, using our calculation, were 70 cents per bushel (64 previous session) and compares to 67 cents a week ago and 79 cents around this time last year.


<![if !supportLists]>·
<![endif]>India May vegetable oil imports were 707,478 tons, down 40 percent from a year ago due to the virus lockdown.  Soybean oil imports were 187,034 tons, off from 232,003 tons a year ago. Palm imports
of 387,006 tons were off 53 percent.

<![if !supportLists]>·
<![endif]>Malaysian palm
:


Oilseeds
Export Developments


  • USDA’s
    24-hour reporting system announced private exporters export sales of 120,000 metric tons of soybeans for delivery to unknown destinations.  Of the total, 60,000 tons is for delivery during the 2019/2020 marketing year and 60,000 tons is for delivery during
    the 2020/2021 marketing year.
  • Syria
    will retender for 50,000 tons of soymeal and 50,000 tons of corn on June 24 for delivery within four months of contract.


Wheat


  • Wheat
    is higher in part to FOA’s forecast for a smaller global wheat production forecast of 758.3 million tons, down from 762.2 million tons forecast for 2019-20.  USDA shows a 2020-21 world production estimate of 768.5 MMT, up from 764.3 MMT for 2018-19.
  • USDA
    all-wheat export sales for the 2019-20 wound down to 179,600 tons and new-crop were 437,400 tons, signaling an increase for new-crop US wheat by major importers.  China was in there for 74,000 tons but 65,000 were switched from unknown.
  • Paris
    December wheat futures were up 1.50 euro early this morning at 188.75 euros.


<![if !supportLists]>·
<![endif]>ProAgro sees Ukraine exporting 55.2 million tons of grain during 2020-21, down from the record 56.9 million tons during the 2019-20 season.  Production of grain is expected to be slightly lower at 74.4 million tons from 75.1 million
tons in 2019. 

<![if !supportLists]>·
<![endif]>The FAO food price index fell 1.9% from the previous month to 162.5 points, lowest since December 2018, and is down 6.5 percent from the previous year.


Export
Developments.

  • The
    Philippines passed on 55,000 tons of feed wheat on June 4 for September shipment.


Rice/Other


  • CBOT
    July rice is higher again while September is lower.
  • The
    Philippines seeks 300,000 tons of rice on June 8. 


U.S. EXPORT SALES FOR WEEK ENDING 5/28/2020


CURRENT
MARKETING YEAR

NEXT
MARKETING YEAR

COMMODITY

NET
SALES

OUTSTANDING
SALES

WEEKLY
EXPORTS

ACCUMULATED
EXPORTS

NET
SALES

OUTSTANDING
SALES

CURRENT
YEAR

YEAR

AGO

CURRENT
YEAR

YEAR
AGO


THOUSAND
METRIC TONS

WHEAT


   HRW

133.2

641.3

808.2

487.3

9,526.2

8,591.2

151.3

1,460.0

   SRW

3.3

128.8

128.6

49.8

2,317.8

3,203.5

38.7

424.4

   HRS

37.7

1,040.1

376.2

119.4

6,960.3

6,776.2

101.4

749.4

   WHITE

5.1

614.2

290.8

96.2

4,750.9

5,163.7

135.9

583.3

   DURUM

0.2

43.4

24.4

0.2

922.1

479.3

10.0

253.0

     TOTAL

179.5

2,467.8

1,628.1

752.8

24,477.3

24,214.0

437.3

3,470.2

BARLEY

0.0

9.2

18.7

0.5

41.1

42.5

0.5

31.5

CORN

637.5

11,461.2

7,867.7

1,346.8

29,014.6

40,370.5

27.5

3,412.5

SORGHUM

93.3

1,320.9

465.6

94.7

2,625.9

1,094.7

0.0

195.0

SOYBEANS

495.2

6,731.3

11,769.2

483.0

35,926.0

34,912.8

607.4

2,939.8

SOY MEAL

558.9

2,419.9

2,735.6

291.5

8,103.2

8,270.2

25.0

304.9

SOY OIL

9.4

257.7

149.8

75.9

892.4

606.7

0.0

11.0

RICE


   L G RGH

8.3

251.2

245.6

23.0

1,240.2

1,066.2

0.0

0.0

   M S RGH

0.0

32.6

21.4

4.3

63.9

64.2

0.0

0.0

   L G BRN

0.5

12.6

3.7

8.3

55.0

37.3

0.0

0.0

   M&S BR

2.6

42.6

5.0

16.6

76.1

141.8

0.0

0.0

   L G MLD

15.5

46.3

198.1

17.3

823.3

721.0

0.0

0.0

   M S MLD

1.7

169.1

171.9

6.1

545.2

462.0

0.0

0.0

     TOTAL

28.6

554.4

645.7

75.6

2,803.8

2,492.5

0.0

0.0

COTTON


THOUSAND
RUNNING BALES      

   UPLAND

-10.1

5,010.3

4,804.6

237.9

11,315.4

10,288.6

12.4

2,834.3

   PIMA

0.5

143.5

176.3

2.1

413.8

534.5

0.0

33.8


Export Sales Highlights 

This
summary is based on reports from exporters for the period May 22-28, 2020.

<![if !supportLists]>·
<![endif]>Wheat:  Net sales of 179,500 metric tons for 2019/2020 were down 14 percent from the previous week and from the prior 4-week average.  Increases primarily for Ecuador (194,700 MT, late – see below), China (74,000 MT, including
65,000 MT switched from unknown destinations), Guinea-Conakry (32,000 MT, switched from unknown destinations), Nigeria (14,500 MT, including 11,000 MT switched from unknown destinations), and the Philippines (5,800 MT),  were offset by reductions primarily
for unknown destinations (105,000 MT) and Singapore (44,600 MT).  For 2020/2021, net sales of 437,300 MT primarily for the Philippines (110,000 MT), Nigeria (83,100 MT), Yemen (70,000 MT), Japan (65,700 MT), and Brazil (55,000 MT), were offset by reductions
for unknown destinations (61,600 MT) and Chile (5,000 MT).  Exports of 752,800 MT–a marketing-year high–were up 34 percent from the previous week and 61 percent from the prior 4-week average.  The destinations were primarily to Ecuador (194,700 MT, late
– see below), China (189,000 MT), the Philippines (79,700 MT), Nigeria (49,500 MT), and Mexico (44,600 MT).
Late Reporting:  For 2019/2020, net sales totaling 194,700 MT were reported late.  These sales were reported for Ecuador.  For 2019/2020, exports totaling 194,700 MT were reported late.  The destinations were to Ecuador.

<![if !supportLists]>·
<![endif]>Corn:

Net sales of 637,500 MT for 2019/2020 were up 49 percent from the previous week, but down 19 percent from the prior 4-week average.  Increases primarily for Japan (248,900 MT, including 62,800 MT switched from unknown destinations and decreases of 49,800 MT),
Colombia (214,700 MT, including 147,100 MT switched from unknown destinations, decreases of 400 MT, and late 12,000 MT – see below), South Korea (143,300 MT), Mexico (76,600 MT, including decreases of 13,000 MT), and Canada (21,600 MT, including decreases
of 300 MT), were offset by reductions for unknown destinations (59,300 MT), Jamaica (54,500 MT), Guatemala (13,000 MT), and El Salvador (2,100 MT).  For 2020/2021, net sales of 27,500 MT were for unknown destinations (12,000 MT), Colombia (7,000 MT), El Salvador
(5,200 MT), Canada (2,400 MT), and Guatemala (900 MT).  Exports of 1,346,800 MT were up 27 percent from the previous week and 7 percent from the prior 4-week average.  The destinations were primarily to Japan (447,900 MT), Mexico (233,300 MT), South Korea
(206,800 MT), Colombia (190,700 MT, late 12,000 MT – see below), and Guatemala (60,800 MT).
Optional Origin Sales:  For 2019/2020, options were exercised to export 69,000 MT to South Korea from the United States.  The current outstanding balance of 643,000 MT is for South Korea (383,000 MT), Vietnam (195,000 MT), and Taiwan (65,000 MT).
Late Reporting:  For 2019/2020, net sales totaling 34,500 MT were reported late.  These sales were reported for Panama (15,000 MT), Colombia (12,000 MT), and Venezuela (7,500 MT).  For 2019/2020, exports totaling 34,500 MT were
reported late.  The destinations were to Panama (15,000 MT), Colombia (12,000 MT), and Venezuela (7,500 MT).

<![if !supportLists]>·
<![endif]>Barley:

No net sales for 2019/2020 were reported for the week.  For 2020/2021, total net sales of 500 MT were for Taiwan.  Exports of 500 MT were up 90 percent from the previous week and 12 percent from the prior 4-week average.  The destination was Japan.

<![if !supportLists]>·
<![endif]>Sorghum:

Net sales of 93,300 MT for 2019/2020 were down 48 percent from the previous week, but up 19 percent from the prior 4-week average.  Increases were for China (70,100 MT, including 68,000 MT switched from unknown destinations), unknown destinations (22,000 MT),
and Japan (1,200 MT).  Exports of 94,700 MT were down 33 percent from the previous week and 37 percent from the prior 4-week average.  The destinations were primarily to China (72,900 MT) and Japan (21,200 MT).

<![if !supportLists]>·
<![endif]>Rice:  Net sales of 28,600 MT for 2019/2020 were up noticeably from the previous week, but down 46 percent from the prior 4-week average.  Increases were primarily for Colombia (12,000 MT), Mexico (8,700 MT, including decreases
of 400 MT), South Korea (2,600 MT), Canada (1,700 MT, including decreases of 100 MT), and Saudi Arabia (1,300 MT).  Exports of 75,600 MT were up noticeably from the previous week and up 1 percent from the prior 4-week average.  The destinations were primarily
to South Korea (18,400 MT), Colombia (12,000 MT), Mexico (11,800 MT), Honduras (10,900 MT), and the United Kingdom (7,000 MT).
Exports
for Own Account:

For 2019/2020, the current exports for own account outstanding balance is 100 MT, all Canada.

<![if !supportLists]>·
<![endif]>Soybeans:

Net sales of 495,200 MT for 2019/2020 were down 23 percent from the previous week and 36 percent from the prior 4-week average.  Increases primarily for China (201,000 MT, including decreases of 66,000 MT), Egypt (189,400 MT, including 180,000 MT switched
from unknown destinations), Indonesia (62,500 MT, including 55,000 MT switched from unknown destinations and decreases of 200 MT), Japan (42,200 MT, including 32,000 MT switched from unknown destinations and decreases of 1,900 MT), and Taiwan (39,900 MT, including
decreases of 1,100 MT), were offset by reductions for unknown destinations (79,000 MT) and Panama (5,800 MT).  For 2020/2021, net sales of 607,400 MT were primarily for unknown destinations (329,000 MT) and China (264,000 MT).  Exports of 483,000 MT were up
46 percent from the previous week and 14 percent from the prior 4-week average.  The destinations were primarily to Egypt (189,400 MT), Indonesia (73,000 MT), Japan (72,700 MT), Mexico (66,800 MT), and Vietnam (17,900 MT).
Exports for Own Account:  For 2019/2020, the current exports for own account outstanding balance is 2,100 MT, all Canada.

<![if !supportLists]>·
<![endif]>Soybean Cake and Meal
:
Net sales of 558,900 MT for 2019/2020 were up noticeably from the previous week and from the prior 4-week average.  Increases primarily for the Philippines (392,700 MT, including 246,000 MT switched from unknown destinations), Libya (60,000 MT), Colombia (48,500
MT, including decreases of 2,600 MT and late 32,300 MT – see below), the Dominican Republic (27,300 MT, including decreases of 100 MT), and Venezuela (19,400 MT and late 10,400 MT – see below), were offset by reductions for unknown destinations (30,000 MT),
Guatemala (7,900 MT), and Australia (7,000 MT).  For 2020/2021, net sales of 25,000 MT for Colombia (19,300 MT), Thailand (3,200 MT), Guatemala (2,500 MT), El Salvador (1,800 MT), and Mexico (1,400 MT), were offset by reductions for unknown destinations (3,200
MT). 
Exports
of 291,500 MT were up 30 percent from the previous week and 34 percent from the prior 4-week average.  The destinations were primarily to the Philippines (81,300 MT), Colombia (65,800 MT), Guatemala (31,400 MT), Mexico (27,900 MT), and Canada (19,400 MT).
Late Reporting:  For 2019/2020, net sales totaling 48,300 MT were reported late.  These sales were reported for Colombia (32,300 MT), Venezuela (10,400 MT), and Panama (5,600 MT).  Exports totaling 48,300 MT were reported late.  The destinations were
to Colombia (32,300 MT), Venezuela (10,400 MT), and Panama (5,600 MT). 

<![if !supportLists]>·
<![endif]>Soybean Oil: 
Net
sales of 9,400 MT for 2019/2020 primarily for Colombia (7,000 MT), Honduras (2,200 MT), Canada (1,100 MT), Trinidad (700 MT), and Mexico (600 MT), were offset by reductions for South Korea (2,600 MT).  Exports of 75,900 MT were up noticeably from the previous
week and from the prior 4-week average.  The destinations were to South Korea (42,400 MT), the Dominican Republic (24,000 MT), Colombia (8,200 MT), Mexico (900 MT), and Canada (300 MT).

<![if !supportLists]>·
<![endif]>Cotton:

Net sales reductions of 10,100 RB for 2019/2020 were down noticeably from the previous week and from the prior 4-week average.  Increases for Taiwan (3,300 RB, including 900 RB switched from Bangladesh and decreases of 100 RB), Bangladesh (3,200 RB), Indonesia
(1,500 RB, including 2,100 RB switched from Malaysia and decreases of 100 RB), South Korea (1,300 RB, including decreases of 200 RB), and Thailand (400 RB, including decreases of 400 RB), were offset by reductions primarily for Turkey (12,200 RB), Vietnam
(4,400 RB), and Malaysia (2,100 RB).  For 2020/2021, net sales of 12,400 RB for Vietnam (8,800 RB), China (5,500 RB), Turkey (4,400 RB), Pakistan (1,100 RB), and Egypt (900 RB), were offset by reductions for Honduras (6,100 RB) and Peru (2,200 RB).  Exports
of 237,900 RB were down 11 percent from the previous week and 16 percent from the prior 4-week average.  Exports were primarily to Vietnam (84,900 RB), China (45,100 RB), Pakistan (43,900 RB), Turkey (24,000 RB), and South Korea (10,200 RB).  Net sales of
Pima totaling 500 RB were down 95 percent from the previous week and 85 percent from the from the prior 4-week average.  Increases for Djibouti (2,200 RB, switched from China), Turkey (400 RB), and Peru (200 RB), were offset by reductions for China (2,200
RB) and India (100 RB).  Exports of 2,100 RB were up 57 percent from the previous week, but down 50 percent from the prior 4-week average.  The destinations were primarily to Indonesia (900 RB), Pakistan (700 RB), and India (400 RB).
Exports for Own Account:  For 2019/2020, the current exports for own account outstanding balance of 31,800 RB is for Vietnam (11,900 RB), China (10,700 RB), Indonesia (8,200 RB), and Bangladesh (1,000 RB).

<![if !supportLists]>·
<![endif]>Hides and Skins:

Net sales of 392,700 pieces for 2020 were down 9 percent from the previous week, but up 21 percent from the prior 4-week average.  Increases primarily for China (348,200 whole cattle hides, including decreases of 3,500 pieces), South Korea (35,300 whole cattle
hides, including decreases of 1,100 pieces), Vietnam (4,400 whole cattle hides), Mexico (3,300 whole cattle hides, including decreases of 200 pieces), and Taiwan (2,600 whole cattle hides), were offset by reductions for Indonesia (1,500 whole cattle hides).

Additionally, net sales reductions were reported for Italy (300 calf skins) and Belgium (200 kip skins).
Exports of 414,900 pieces reported for 2020 were down 7 percent from the previous week, but up 3 percent from the prior 4-week average.  Whole cattle hides exports were primarily to China (317,000 pieces), South Korea (31,100
pieces), Mexico (20,300 pieces), Thailand (19,400 pieces), and Indonesia (10,000 pieces).  In addition, there were exports to Italy (7,000 calf skins) and Belgium (1,200 kip skins).

<![if !supportLists]>·
<![endif]>Net sales of 63,100 wet blues

for 2020 were down 49 percent from the previous week and but up 25 percent from the prior 4-week average.  Increases were reported for Vietnam (26,200 unsplit, including decreases of 100 unsplit), Italy (15,700 unsplit, including 500 unsplit), Thailand (12,700
unsplit, including decreases of 100 unsplit), China (6,100 unsplit), and the Dominican Republic (2,400 unsplit).  Exports of 64,900 wet blues for 2020 were down 28 percent from the previous week and 20 percent from the prior 4-week average.  The destinations
were to Italy (46,400 unsplit), Thailand (8,300 unsplit), Vietnam (6,700 unsplit), Brazil (2,200 grain splits), and China (1,300 unsplit).
Net
sales of 617,900 splits were for Vietnam (605,600 pounds) and China (12,300 pounds).  Exports of 320,300 pounds were to Vietnam.

<![if !supportLists]>·
<![endif]>Beef:

Net
sales of 12,300 MT reported for 2020 were up 7 percent from the previous week and 97 percent from the prior 4-week average.  Increases primarily for South Korea (4,300 MT, including decreases of 300 MT), Japan (4,200 MT, including decreases of 500 MT), Canada
(1,500 MT), Hong Kong (700 MT, including decreases of 100 MT), and China (700 MT), were offset by reductions primarily for Chile (100 MT) and Vietnam (100 MT).  Exports of 9,600 MT were down 15 percent from the previous week and 18 percent from the prior 4-week
average.  The destinations were primarily to Japan (3,500 MT), South Korea (2,900 MT), Hong Kong (1,000 MT), Taiwan (800 MT), and China (300 MT).

<![if !supportLists]>·
<![endif]>Pork:
Net
sales of 17,300 MT reported for 2020 were down 16 percent from the previous week and 5 percent from the prior 4-week average.  Increases were primarily for Mexico (8,500 MT, including decreases of 100 MT), China (3,400 MT, including decreases of 1,400 MT),
Japan (3,100 MT, including decreases of 300 MT), Canada (800 MT, including decreases of 500 MT),  and South Korea (600 MT, including decreases of 200 MT).  Exports of 31,300 MT were down 9 percent from the previous week and 14 percent from the prior 4-week
average.  The destinations were primarily to China (13,200 MT), Mexico (7,500 MT), Japan (4,300 MT), South Korea (1,900 MT), and Canada (1,400 MT).

Terry Reilly

Senior Commodity Analyst – Grain and Oilseeds

Futures International │190 S LaSalle St., Suite 410│Chicago, IL  60603

W: 312.604.1366

treilly@futures-int.com

AIM: fi_treilly

ICE IM: 
treilly1

Skype: fi.treilly


Description: Description: Description: Description: FImail


Trading of futures, options, swaps and other derivatives is risky and is not suitable for all persons.  All of these investment products are leveraged, and you can lose more than your initial deposit.  Each investment product is offered
only to and from jurisdictions where solicitation and sale are lawful, and in accordance with applicable laws and regulations in such jurisdiction.  The information provided here should not be relied upon as a substitute for independent research before making
your investment decisions.  Futures International, LLC is merely providing this information for your general information and the information does not take into account any particular individual’s investment objectives, financial situation, or needs.  All investors
should obtain advice based on their unique situation before making any investment decision.  The contents of this communication and any attachments are for informational purposes only and under no circumstances should they be construed as an offer to buy or
sell, or a solicitation to buy or sell any future, option, swap or other derivative.  The sources for the information and any opinions in this communication are believed to be reliable, but Futures International, LLC does not warrant or guarantee the accuracy
of such information or opinions.  Futures International, LLC and its principals and employees may take positions different from any positions described in this communication.  Past results are not necessarily indicative of future results.