PDF attached
USDA
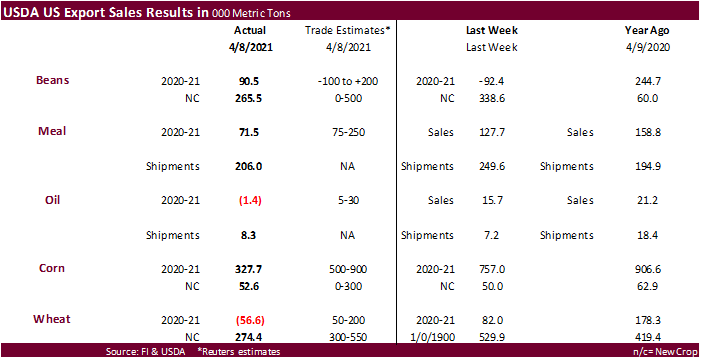
export sales were excellent for sorghum (656,700 tons, most for China), ok for soybeans, disappointing for products, and below expectations for corn and wheat.
Higher
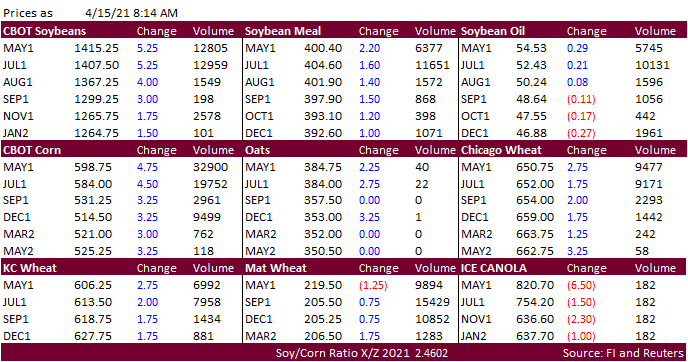
prices to start on ongoing weather concerns for central Brazil, US and Europe. Corn is sitting at an 8-year high. Global export tenders increased overnight. Dry weather and a cold snap expected next week across the southern US Plains wheat areas and corn
production states across the Midwest is seen threatening developments and germination, respectively. Brazil’s second-crop corn is under stress from dryness. It will be a busier morning than usual with USDA export sales on deck followed by NOPA crush.
![]()
Next
7 days
6-10
temps
World
Weather Inc.
MARKET
WEATHER MENTALITY FOR CORN AND SOYBEANS:
Brazil’s
Safrinha corn crop remains a concern, but showers expected in the next couple of weeks will offer some partial relief. If any of the advertised rain is missed crop moisture stress is going to get very high and production will be cut. Mato Grosso crops will
get most of the rain and be in the best shape. Areas to the south are expected to remain limited on soil moisture and crop stress will continue in areas that fail to get much moisture.
Argentina weather is improving for crop maturation and harvesting, although the wettest areas will need more time to dry out before conditions become ideal again. More rain in Argentina next week will reverse the improving trend and prolong some harvest
delays.
U.S.
planting moisture still looks good, although cool temperatures during the next couple of weeks may slow fieldwork and especially germination as well as emergence. Warmer temperatures with periodic rain are needed for the best scenario. Central and northern
Iowa and southern Minnesota as well as southwestern Wisconsin will be closely monitored for developing dryness, although it is not too dry today.
Recent
moisture in the upper Midwest and southeastern Canada’s Prairies has improved the planting outlook for late this month and especially in May if there is follow up rain. Temperatures will be cool this week limiting any thought of fieldwork for a while.
Southeast
Asia Palm Oil conditions will remain good during the next ten days as will be winter rapeseed in Western Europe, China and India. South Africa summer crops will remain in good condition as well.
Overall,
weather today will likely maintain a mixed influence on market mentality, although the latest NOAA 30-day outlook for rain in the Midwest will certainly weigh on market mentality.
MARKET
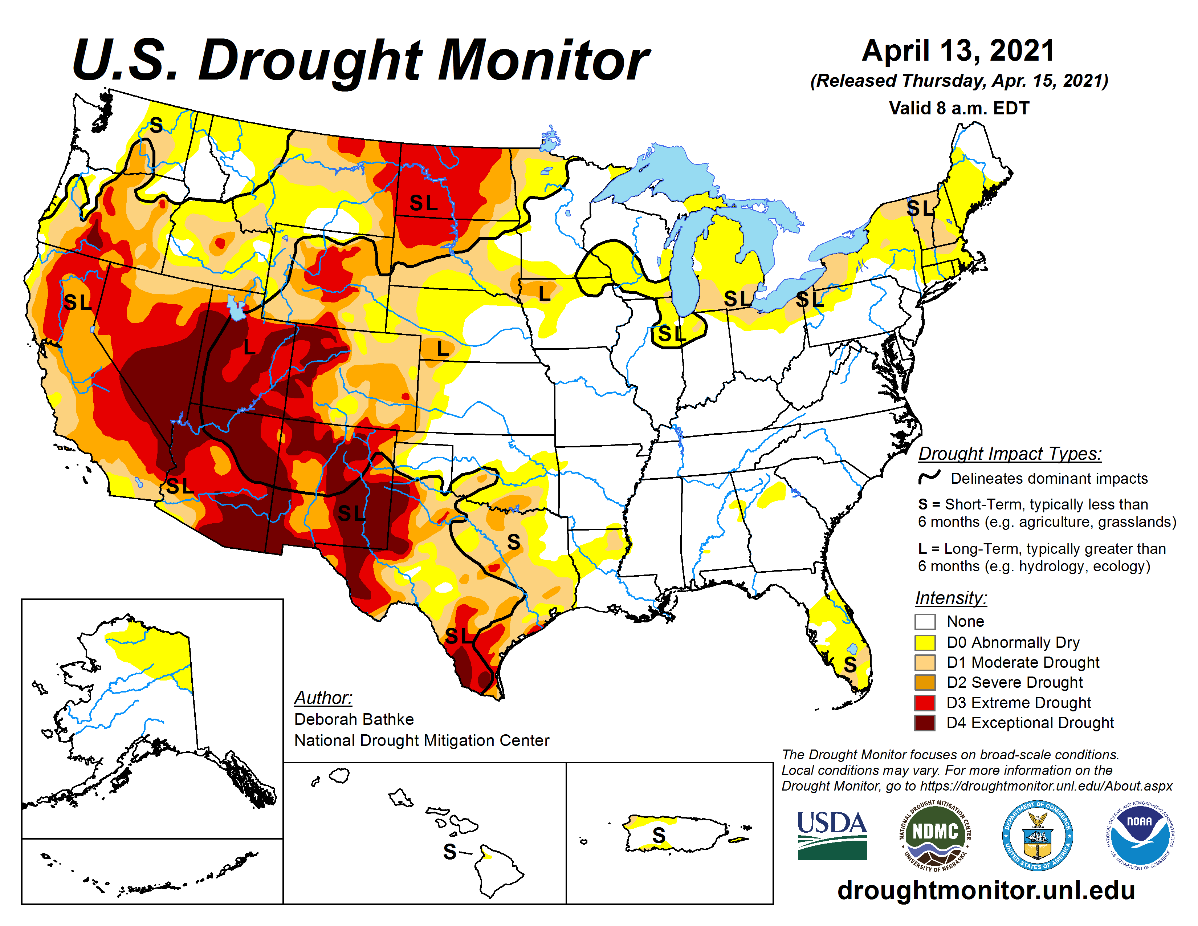
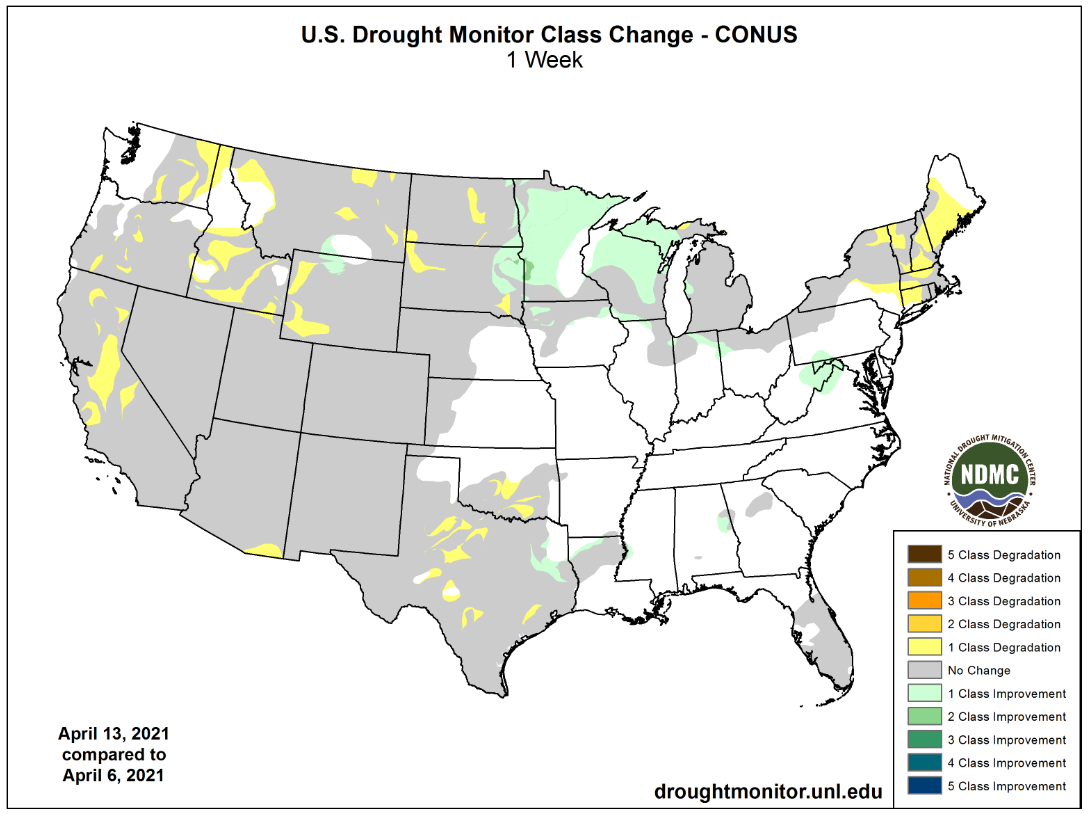
WEATHER MENTALITY FOR WHEAT: Portions of North Dakota, Saskatchewan and Manitoba have received welcome precipitation this week easing long term dryness, although much more moisture will be needed to end drought. Areas in the southwestern Canada Prairies and
the northwestern U.S. Plains will continue too dry and are waiting for significant rain.
Dryness
remains a concern for unirrigated winter crops from central Washington through Oregon and not much relief is expected for the coming ten days.
U.S.
hard red winter wheat areas will receive significant rain and snow Thursday into Saturday morning, although the far southwest may not get a large amount of moisture. The precipitation will bring some needed relief after recent net drying and crop conditions
will respond positively reinforcing good yield potentials. Additional timely rain must continue through the spring, however.
China
winter wheat conditions remain very good with a positive outlook, despite net drying over the next ten days. India’s wheat is being harvesting with little reason for lasting disruptions because of rain. North Africa still has need for greater rain in southwestern
Morocco and northwestern Algeria and parts of Tunisia are starting to dry down as well, but these areas will get some rain in the next ten days.
Europe soil moisture is mostly rated well, but there will be a gradual dry down in the north for a while. Cool temperatures are keeping spring crop development and planting advancing slower than usual.
Warming
in the western CIS this week has brought on some greening in the south and recent moisture has most areas plenty moist. Cooler weather in the coming week will restrict new crop development, but the longer-range outlook is good.
Australia’s
winter crop planting outlook is favorable, although there is need for widespread precipitation in the south before much fieldwork will begin.
Overall,
weather today may contribute a bearish bias to market mentality, but other factors may have more influence.
Source:
World Weather Inc. & FI
Thursday,
April 15:
- USDA
weekly crop net-export sales for corn, soybeans, wheat, cotton, pork, beef, 8:30am - Malaysia’s
April 1-15 palm oil export data - The
U.S. National Confectionery Association releases first quarter cocoa grinding data for North America - USDA
updates monthly North American sugar and sweeteners outlook - White
sugar May contract expires - New
Zealand food prices - HOLIDAY:
Thailand
Friday,
April 16:
- ICE
Futures Europe weekly commitments of traders report (6:30pm London) - CFTC
commitments of traders weekly report on positions for various U.S. futures and options, 3:30pm - Cocoa
Association of Asia releases 1Q 2021 cocoa grinding data - FranceAgriMer
weekly update on crop conditions
Source:
Bloomberg and FI
USDA
Export Sales
US
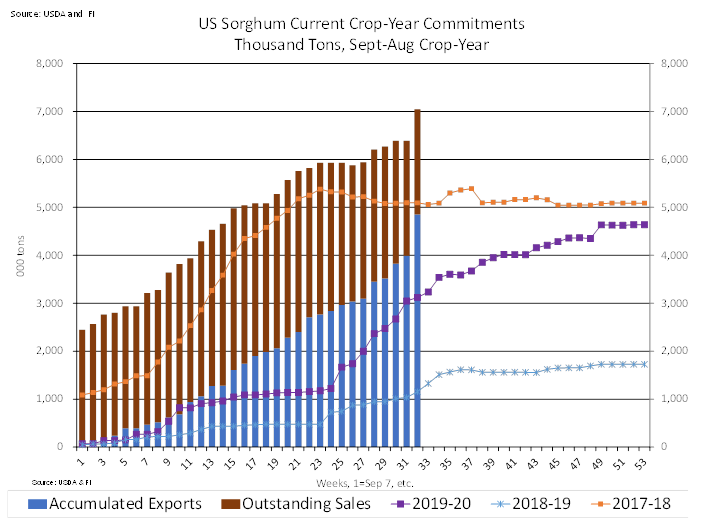
weekly export sales of sorghum knocked it out of the ballpark at 656,700 tons, a marketing year high, and included China taking 601,700 tons (including decreases of 65,300 MT). Sorghum exports of 860,400 MT, also a marketing-year high.
Soybean
sales for old crop were above water at 90,500 tons and new-crop within expectations at 265,500 tons. Meal and soybean oil sales were at the low end and below expectations, respectively.
Old
crop corn sales slowed to 327,700 tons, below expectations, and all-wheat sales were negative 56,600 tons for this crop year and positive 274,400 tons for new-crop. New-crop sales for wheat were below expectations.
Macro
US
Retail Sales (M/M) Mar 9.8% (est 5.9%; prevR -2.7%; prev -3.0%)
–
US Retail Sales Ex. Auto (M/M) Mar 8.4% (est 5.0%; prevR -2.5%; prev -2.7%)
–
US Retail Sales Ex. Auto & Gas (M/M) Mar 8.2% (est 6.4%; prevR -3.1%; prev -3.3%)
–
US Retail Sales Control Group (M/M) Mar 6.9% (est 6.3%; prevR -3.4%; prev -3.5%)
US
Initial Jobless Claims Apr 10 576K (est 700K; prevR 769K; prev 744K)
–
US Continuing Claims Apr 3 3.731M (est 3.700M; prevR 3.727M; prev 3.734M)
US
Empire Manufacturing Apr 26.3 (est 19.5; prev 17.4)
US
Philadelphia Fed Business Outlook Apr 50.2 (est 42.0; prev 51.8)
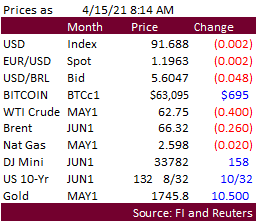
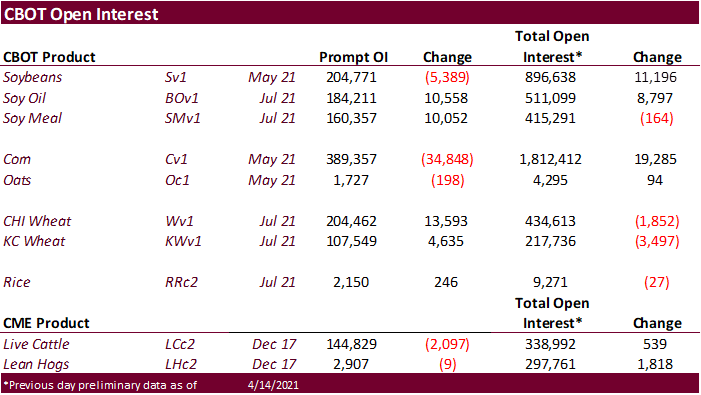
- CBOT
corn
hit an 8-year high on fund buying amid US weather concerns and USD sitting near a 3-week low. South Korea bought a cargo of US corn.
- Funds
on Wednesday bought an estimated net 17,000 corn contracts. - Rain
and snow in parts of China’s northeast this week may delay planting of corn, according to the country’s National Meteorological Center. (Bloomberg) - US
weekly ethanol production declined an unexpected 34,000 barrels to 941,000 barrels and stocks declined 124,000 barrels to 20.518 million. Stocks are lowest since November 13, 2020.
- The
USDA Broiler Report showed eggs set in the US up 7 percent and chicks placed up slightly. Cumulative placements from the week ending January 9, 2021 through April 10, 2021 for the United States were 2.61 billion. Cumulative placements were down 2 percent
from the same period a year earlier.
Export
developments.
-
South
Korea’s KFA bought 65,000 tons of US corn at $293.79/ton c&f for March 20-April 30 loading.
- CBOT
soybeans
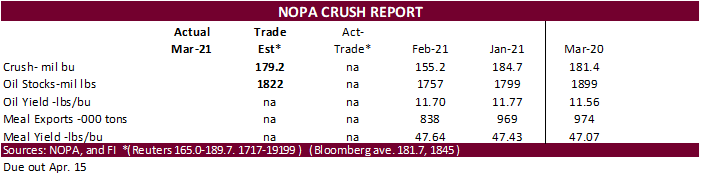
are higher on follow through buying and concerns rationing of US soybeans are starting to emerge. Later we will get NOPA crush for the month of March. Crush is expected at 179.2 with oil stocks of 1822, using Reuters estimates. Back months CBOT soybean oil
are on the defensive from a fresh round of buying in soybean meal. Palm oil hit a 1-week high. Cold weather tends to increase feed rates for animal units but minimally unlike the extreme low temperatures during winter months.
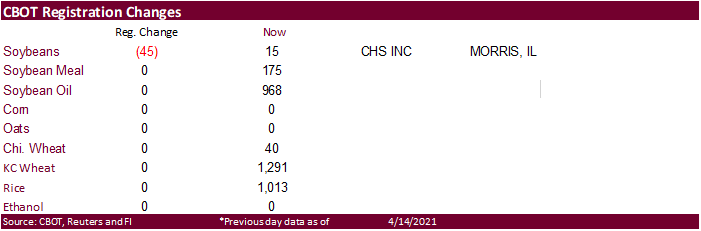
- There
were 45 CBOT soybean receipts canceled out of Morris, IL, leaving 15 left for total soybean registrations.
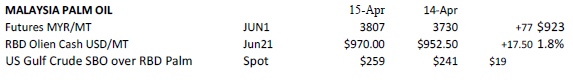
- AmSpec
reported Malaysian palm 1-15 April shipments up 13% from the previous month to 585,510 tons. ITS reported a 15.4% increase at 585,280 tons. SGS reported at 6.3% increase at 583,875 tons from the previous month.
- Malaysia
kept their crude palm oil export tax unchanged at 8% for May. - Funds
on Wednesday bought an estimated net 13,000 soybean contracts, bought 2,000 soybean meal and bought an estimated 6,000 soybean oil.
- Offshore
values were leading CBOT SBO 35 points lower and meal $0.60 short ton lower.
- Rotterdam
vegetable oil values were 15-20 eros higher from this time previous session and Rotterdam meal unchanged to 4 euros higher.
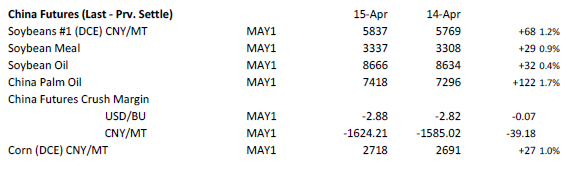
- China
cash crush margins on our analysis were 179 (170 previous) vs. 179 cents late last week and compares to 197 cents year earlier.
- China:
-
Lowest
offer for Egypt’s GASC for 30,000 tons of soybean oil was $1,249/ton. Lowest offer for sunflower oil was $$1,619 for payment at sight. This is for
arrival June 1-20. Payment is for at sight and 180-day letter of credit.
- US
wheat is higher on US and EU weather concerns and follow through buying from investment funds. Global export developments are steady this week.
- September
Paris wheat was up 2.50 euros at 207.25 euros. - Funds on Wednesday bought
an estimated net 12,000 CBOT SRW wheat contracts. - Strategie Grains raised
its monthly forecast for 2020-21 soft wheat exports from the European Union and Britain by 200,000 tons to 25.4 million tons. They estimate 2021 soft wheat production in the EU’s 27 member countries at 129.6 million tons, up from 119.4 million last year.
- Ukraine’s UMG Investments
plans to build a grain export terminal at the Black Sea port of Pivdenyi near Odessa with the annual capacity of 9 million tons over the next 2-3 years.
- Algeria’s
OAIC bought around 200,000 tons of durum wheat at (2 boats) $351 to $352 a ton c&f and another of Canada western amber durum (CWAD) at a slightly higher price. Shipment was sought between May 1-15 and May 15-31.
- The
Philippines passed on 165,000 tons of feed wheat due to high prices. - The
Philippines in a separate import tender seeks 240,000 tons of wheat and 140,000 tons of animal feed barley on Friday for June through September shipment. The milling wheat can be sourced from Russia, Ukraine or Australia. The feed wheat can be sourced from
Russia, Ukraine, Romania, Bulgaria, Brazil, Australia, the United States or Canada, traders said.
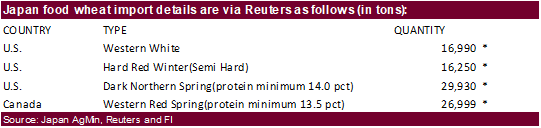
- Japan
bought 90,169 tons of Canadian and US food wheat as expected. Original details as follows.
*no
shipment period was provided.
- Ethiopia
seeks 30,000 tons of wheat on April 16. - Ethiopia
seeks 400,000 tons of optional origin milling wheat, on April 20, valid for 30 days. In January Ethiopia cancelled 600,000 tons of wheat from a November import tender because of contractual disagreements.
- Jordan
seeks 120,000 tons of feed barley on April 21.
Rice/Other
·
Mauritius seeks 4,000 tons of optional origin long grain white rice on April 16 for delivery between June 1 and July 31.
·
Bangladesh seeks 50,000 tons of rice on April 18.
·
Syria seeks 39,400 tons of white rice on April 19. Origin and type might be White Chinese rice or Egyptian short grain rice.
·
Ethiopia seeks 170,000 tons of parboiled rice on April 20.
U.S. EXPORT SALES FOR WEEK ENDING 4/8/2021
|
|
CURRENT MARKETING YEAR |
NEXT MARKETING YEAR |
||||||
|
COMMODITY |
NET SALES |
OUTSTANDING SALES |
WEEKLY EXPORTS |
ACCUMULATED EXPORTS |
NET SALES |
OUTSTANDING SALES |
||
|
CURRENT YEAR |
YEAR |
CURRENT YEAR |
YEAR |
|||||
|
|
THOUSAND METRIC TONS |
|||||||
|
WHEAT |
|
|
|
|
|
|
|
|
|
HRW |
-1.3 |
1,146.3 |
1,662.7 |
124.1 |
7,400.3 |
7,933.6 |
95.3 |
482.5 |
|
SRW |
-23.0 |
259.3 |
256.5 |
19.0 |
1,512.5 |
2,108.2 |
6.0 |
477.6 |
|
HRS |
-27.6 |
1,251.1 |
1,345.0 |
129.4 |
6,270.3 |
6,008.8 |
110.9 |
533.0 |
|
WHITE |
-5.2 |
1,606.9 |
858.4 |
192.2 |
5,010.0 |
4,126.3 |
62.2 |
482.4 |
|
DURUM |
0.5 |
78.1 |
221.3 |
2.4 |
594.5 |
699.0 |
0.0 |
5.0 |
|
TOTAL |
-56.6 |
4,341.7 |
4,343.8 |
467.1 |
20,787.6 |
20,876.0 |
274.4 |
1,980.4 |
|
BARLEY |
0.0 |
5.0 |
10.8 |
0.5 |
24.2 |
38.8 |
0.0 |
20.2 |
|
CORN |
327.7 |
29,023.5 |
13,844.0 |
1,816.3 |
37,787.3 |
20,819.0 |
52.6 |
2,102.1 |
|
SORGHUM |
656.7 |
2,193.0 |
1,548.5 |
860.4 |
4,850.7 |
1,572.4 |
201.0 |
1,020.0 |
|
SOYBEANS |
90.4 |
5,264.6 |
4,983.1 |
413.1 |
55,498.0 |
32,494.2 |
265.5 |
5,876.3 |
|
SOY MEAL |
71.5 |
2,220.4 |
2,735.6 |
206.0 |
6,915.2 |
6,403.3 |
26.0 |
280.8 |
|
SOY OIL |
-1.5 |
106.2 |
308.8 |
8.3 |
547.3 |
636.4 |
0.0 |
0.6 |
|
RICE |
|
|
|
|
|
|
|
|
|
L G RGH |
0.0 |
298.3 |
285.9 |
18.9 |
1,125.2 |
1,065.9 |
0.0 |
0.0 |
|
M S RGH |
0.0 |
5.3 |
17.9 |
0.0 |
23.5 |
52.7 |
0.0 |
0.0 |
|
L G BRN |
-14.3 |
3.1 |
16.4 |
0.3 |
34.7 |
41.7 |
0.0 |
0.0 |
|
M&S BR |
0.3 |
68.6 |
60.2 |
0.6 |
85.7 |
48.3 |
0.0 |
0.0 |
|
L G MLD |
17.2 |
65.2 |
41.4 |
1.9 |
458.9 |
706.7 |
0.0 |
0.0 |
|
M S MLD |
4.2 |
252.1 |
254.2 |
10.9 |
392.9 |
431.3 |
0.0 |
0.0 |
|
TOTAL |
7.3 |
692.7 |
675.8 |
32.6 |
2,121.0 |
2,346.4 |
0.0 |
0.0 |
|
COTTON |
|
THOUSAND RUNNING BALES |
||||||
|
UPLAND |
122.3 |
4,812.7 |
5,677.6 |
313.2 |
10,156.5 |
9,425.9 |
22.8 |
1,614.7 |
|
PIMA |
3.1 |
220.1 |
161.0 |
16.4 |
529.8 |
380.4 |
0.0 |
1.1 |
This
summary is based on reports from exporters for the period April 2-8, 2021.
Wheat: Net
sales reductions of 56,600 metric tons (MT) for 2020/2021–a marketing-year low–were down noticeably from the previous week and from the prior 4-week average. Increases primarily for the Philippines (19,200 MT, including 12,500 MT switched from unknown destinations
and decreases of 1,100 MT), the Dominican Republic (17,000 MT), Malaysia (11,500 MT, switched from unknown destinations), Colombia (8,500 MT, including 5,000 MT switched from Honduras), and Singapore (7,000 MT, switched from unknown destinations), were more
than offset by reductions primarily for South Korea (35,600 MT), unknown destinations (31,000 MT), Mexico (28,000 MT), and Japan (26,500 MT). For 2021/2022, net sales of 274,400 MT reported for unknown destinations (199,000 MT), the Philippines (113,500 MT),
Japan (47,900 MT), South Korea (38,000 MT), and Peru (6,000 MT), were offset by reductions for China (130,000 MT). Exports of 467,100 MT were down 26 percent from the previous week and 16 percent from the prior 4-week average. The destinations were primarily
to the Philippines (108,200 MT), Mexico (76,100 MT), China (68,000 MT), South Korea (67,400 MT), and Nigeria (27,500 MT).
Optional
Origin Sales:
For 2020/2021, the current outstanding balance of 29,000 MT is for Spain
Corn:
Net sales of 327,700 MT for 2020/2021 were down 57 percent from the previous week and 81 percent from the prior 4-week average. Increases primarily for Japan (178,000 MT, including 76,800 MT switched from unknown destinations and decreases of 1,800 MT ),
Mexico (138,900 MT, including 34,000 MT switched from unknown destinations and decreases of 14,500 MT), South Korea (125,900 MT, including 66,000 MT switched from unknown destinations and decreases of 9,100 MT), Taiwan (111,500 MT, including 69,000 MT switched
from unknown destinations, 27,200 MT switched from China, and decreases of 500 MT), and Israel (55,200 MT, including 55,000 MT switched from unknown destinations), were offset by reductions primarily for unknown destinations (379,900 MT). For 2021/2022, net
sales of 52,600 MT were reported for Guatemala (25,700 MT), El Salvador (24,400 MT), and Canada (2,500 MT). Exports of 1,816,300 MT were down 12 percent from the previous week and from the prior 4-week average. The destinations were primarily to China (520,300
MT), Mexico (450,100 MT, including 34,100 MT – late), Japan (230,800 MT), South Korea (191,400 MT), and Taiwan (123,800 MT).
Optional
Origin Sales:
For 2020/2021, options were exercised to export 124,000 MT to South Korea (69,000 MT) and unknown destinations (55,000 MT) from the United States. The current outstanding balance of 443,800 MT is for South Korea (213,000 MT), unknown destinations (189,500
MT), the Ukraine (32,400 MT), and China (8,900 MT).
Late
Reporting:
For 2020/2021, exports totaling 34,100 MT of corn was reported late to Mexico.
Barley:
For 2020/2021, no net sales were reported for the week. Exports of 500 MT were down 6 percent from the previous week, but up 19 percent from the prior 4-week average. The destination was primarily to Canada (300 MT).
Sorghum:
Net sales of 656,700 MT for 2020/2021–a marketing-year high–were up noticeably from the previous week and from the prior 4-week average. Increases were reported for China (601,700 MT, including decreases of 65,300 MT and
659,100 MT – late) and unknown destinations (55,000 MT). For 2021/2022, net sales of 201,000 MT were reported for unknown destinations (136,000 MT) and China (65,000 MT). Exports of 860,400 MT–a marketing-year high–were up noticeably from the previous
week and from the prior 4-week average. The destination was China (including 659,100 MT – late).
Late
Reporting:
For 2020/2021, net sales and exports totaling 659,100 MT of sorghum was reported late to China.
Rice:
Net sales of 7,300 MT for 2020/2021 were down 83 percent from the previous week and 89 percent from the prior 4-week average. Increases primarily for Canada (1,800 MT), Jordan (1,700 MT), Saudi Arabia (1,400 MT), the Dominican Republic (1,000 MT), and Honduras
(500 MT), were offset by reductions for Mexico (100 MT). Exports of 32,600 MT were up 6 percent from the previous week, but down 37 percent from the prior 4-week average. The destinations were primarily to Mexico (13,700 MT), Japan (6,200 MT), Honduras (5,500
MT), Canada (2,500 MT), and South Korea (1,400 MT).
Soybeans:
Net sales of 90,400 MT for 2020/2021 were down noticeably from the previous week and down 14 percent from the prior 4-week average. Increases primarily for Indonesia (75,900 MT, including 68,000 MT switched from unknown destinations and decreases of 300 MT),
South Korea (29,600 MT, including 25,000 MT switched from unknown destinations), Vietnam (25,600 MT, including 21,200 MT late), Mexico (15,700 MT, including 16,400 MT switched from unknown destinations and decreases of 2,800 MT), and Japan (12,700 MT, including
9,000 MT switched from unknown destinations), were offset by reductions primarily for China (55,000 MT) and unknown destinations (45,000 MT). For 2021/2022, net sales of 265,500 MT were reported for China (264,000 MT), unknown destinations (1,000 MT), and
Canada (500 MT). Exports of 413,100 MT were up 20 percent from the previous week, but down 10 percent from the prior 4-week average. The destinations were primarily to Mexico (97,100 MT, including 14,800 MT late), China (91,600 MT, including 77,000 MT late),
Indonesia (90,800 MT), Taiwan (38,000 MT), and South Korea (27,500 MT).
Exports
for Own Account:
For 2020/2021, the current exports for own account outstanding balance is 5,800 MT, all Canada.
Export
Adjustments: Accumulated exports of soybeans to China were adjusted down 76,999 MT for week ending December 17th. This shipment was reported in error.
Late
Reporting:
For 2020/2021, net sales totaling 98,900 MT were reported late for China (77,000 MT), Vietnam (21,200 MT), and Panama (700 MT). Exports totaling 119,700 MT were for China (77,000 MT), Vietnam (21,200 MT), Mexico (14,800 MT), and Panama (6,700 MT).
Soybean
Cake and Meal:
Net sales of 71,500 MT for 2020/2021–a marketing-year low–were down 44 percent from the previous week and 57 percent from the prior 4-week average. Increases primarily for the Philippines (22,300 MT, including decreases of 700 MT), Venezuela (13,200 MT,
including 10,000 MT switched from Colombia), Mexico (10,400 MT), Canada (9,200 MT, including decreases of 100 MT), and the Dominican Republic (8,500 MT), were offset by reductions primarily for unknown destinations (8,000 MT), Colombia (5,500 MT), Guatemala
(2,800 MT), and Belgium (1,300 MT). For 2021/2022, net sales of 26,000 MT were reported for Guatemala (14,200 MT) and El Salvador (11,800 MT). Exports of 206,000 MT were down 18 percent from the previous week and 20 percent from the prior 4-week average.
The destinations were primarily to the Philippines (68,000 MT), Mexico (31,000 MT), Morocco (30,000 MT), Canada (17,900 MT), and Venezuela (10,700 MT).
Soybean
Oil:
For 2020/2021, net sales reductions of 1,500 MT–a marketing-year low–were down noticeably from the previous week and from the prior 4-week average. Increases primarily for Canada (500 MT) and the Dominican Republic (500 MT), were more than offset by reductions
for Colombia (2,500 MT). Exports of 8,300 MT were up 14 percent from the previous week, but down 13 percent from the prior 4-week average. The destinations were primarily to South Korea (7,700 MT), Mexico (300 MT), and Canada (200 MT).
Cotton:
Net sales of 122,300 RB for 2020/2021 were down 55 percent from the previous week and 54 percent from the prior 4-week average. Increases primarily for Turkey (29,400 RB), Pakistan (21,800 RB, including 1,500 RB switched from the United Arab Emirates), Vietnam
(20,500 RB, including 5,200 RB switched from China and 600 RB switched from South Korea), Bangladesh (12,300 RB), and Indonesia (9,600 RB), were offset by reductions for the United Arab Emirates (1,500 RB) and South Korea (600 RB). For 2021/2022, net sales
of 22,800 RB were reported for Guatemala (19,300 RB) and Thailand (3,500 RB). Exports of 313,200 RB were down 16 percent from the previous week and 8 percent from the prior 4-week average. Exports were primarily to Vietnam (92,500 RB), Pakistan (61,400 RB),
China (38,800 RB), Turkey (37,100 RB), and Bangladesh (28,500 RB). Net sales of Pima totaling 3,100 RB–a marketing-year low–were down 58 percent from the previous week and 51 percent from the prior 4-week average. Increases were reported for South Korea
(1,400 RB), Peru (1,200 RB), Pakistan (400 RB), and Guatemala (100 RB). Exports of 16,400 RB were down 24 percent from the previous week, but up 18 percent from the prior 4-week average. The destinations were primarily to India (7,600 RB), China (2,700 RB),
Honduras (1,700 RB), Vietnam (1,500 RB), and Egypt (1,300 RB).
Exports
for Own Account:
For 2020/2021, new exports for own account totaling 200 RB were to China. Exports for own account totaling 2,500 RB primarily to Vietnam (1,900 RB) were applied to new or outstanding sales. The current exports for own account outstanding balance of 29,200
RB is for China (22,800 RB), Vietnam (5,800 RB), and Bangladesh (600 RB).
Hides
and Skins:
Net sales of 282,700 pieces for 2021 were down 29 percent from the previous week and 40 percent from the prior 4-week average. Increases primarily for China (164,600 whole cattle hides, including decreases of 5,900 pieces), South Korea (52,900 whole cattle
hides, including decreases of 800 pieces), Mexico (23,800 whole cattle hides, including decreases of 400 pieces), Thailand (18,400 whole cattle hides, including decreases of 1,000 pieces), and Japan (2,200 whole cattle hides), were offset by reductions for
Indonesia (300 MT). Total net sales of 13,500-kip skins were for Belgium.
Exports of 401,800 pieces for 2021 were up 9 percent from the previous week and 6 percent from the prior 4-week average. Whole cattle hides exports were primarily to China (293,500 pieces), South Korea (53,200 pieces), Thailand
(16,600 pieces), Mexico (14,500 pieces), and Vietnam (4,300 pieces). Exports of 6,300-kip skins were to Belgium.
Net
sales of 64,200 wet blues for 2021 were unchanged from the previous week, but down 57 percent from the prior 4-week average. Increases reported for China (34,200 unsplit, including decreases of 200 unsplit), Italy (17,900 unsplit, including decreases of 200
unsplit), Vietnam (8,800 unsplit, including decreases of 100 unsplit), South Korea (3,400 grain splits, including decreases of 100 grain splits), and Taiwan (100 grain splits), were offset by reductions for Thailand (200 unsplit). Exports of 101,000 wet blues
for 2021 were down 16 percent from the previous week and 17 percent from the prior 4-week average. The destinations were primarily to Italy (23,900 unsplit and 7,200 grain splits), Vietnam (23,300 unsplit), China (17,000 unsplit and 2,200 grain splits), Thailand
(16,000 unsplit), and Mexico (3,700 grain splits and 900 unsplit). Net sales of 488,400 splits were for China (271,500 pounds, including decreases of 600 pounds), Taiwan (172,300 pounds, including decreases of 86,500 pounds), and Vietnam (44,600 pounds, including
decreases of 1,500 pounds). Exports of 336,700 pounds were to Vietnam (207,4,000 pounds) and China (129,300 pounds).
Beef:
Net
sales of 15,700 MT reported for 2021 were down 14 percent from the previous week and 23 percent from the prior 4-week average. Increases primarily for Japan (6,300 MT, including decreases of 500 MT), China (3,300 MT, including decreases of 100 MT), South
Korea (2,900 MT, including decreases of 400 MT), and Mexico (1,400 MT), were
offset by reductions primarily for the Netherlands (100 MT). For 2022, total net sales of 200 MT were reported for Canada. Exports of 19,000 MT were up 1 percent from the previous week and 3 percent from the prior 4-week
average. The destinations were primarily to South Korea (5,400 MT), Japan (4,900 MT), China (3,500 MT), Mexico (1,400 MT), and Taiwan (1,200 MT).
Pork:
Net
sales of 17,200 MT reported for 2021–a marketing-year low-were down 48 percent from the previous week and 60 percent from the prior 4-week average. Increases were primarily for Mexico (7,800 MT, including decreases of 500 MT), Japan (4,300 MT, including
decreases of 100 MT), South Korea (1,300 MT, including decreases of 900 MT), Colombia (900 MT, including decreases of 100 MT), and the Philippines (800 MT, including decreases of 200 MT). Exports of 38,600 MT were unchanged from the previous week, but down
2 percent from the prior 4-week average. The destinations were primarily to China (12,500 MT), Mexico (9,900 MT), Japan (5,000 MT), South Korea (2,300 MT), and the Philippines (1,900 MT).
Terry Reilly
Senior Commodity Analyst – Grain and Oilseeds
Futures International
One Lincoln Center
18 W 140 Butterfield Rd.
Oakbrook Terrace, Il. 60181
W: 312.604.1366
ICE IM:
treilly1
Skype: fi.treilly

Trading of futures, options, swaps and other derivatives is risky and is not suitable for all persons. All of these investment products are leveraged, and you can lose more than your initial deposit. Each investment product is offered
only to and from jurisdictions where solicitation and sale are lawful, and in accordance with applicable laws and regulations in such jurisdiction. The information provided here should not be relied upon as a substitute for independent research before making
your investment decisions. Futures International, LLC is merely providing this information for your general information and the information does not take into account any particular individual’s investment objectives, financial situation, or needs. All investors
should obtain advice based on their unique situation before making any investment decision. The contents of this communication and any attachments are for informational purposes only and under no circumstances should they be construed as an offer to buy or
sell, or a solicitation to buy or sell any future, option, swap or other derivative. The sources for the information and any opinions in this communication are believed to be reliable, but Futures International, LLC does not warrant or guarantee the accuracy
of such information or opinions. Futures International, LLC and its principals and employees may take positions different from any positions described in this communication. Past results are not necessarily indicative of future results.