PDF attached
Good morning
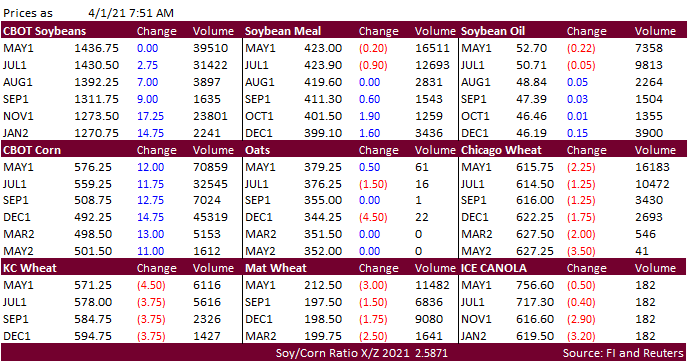
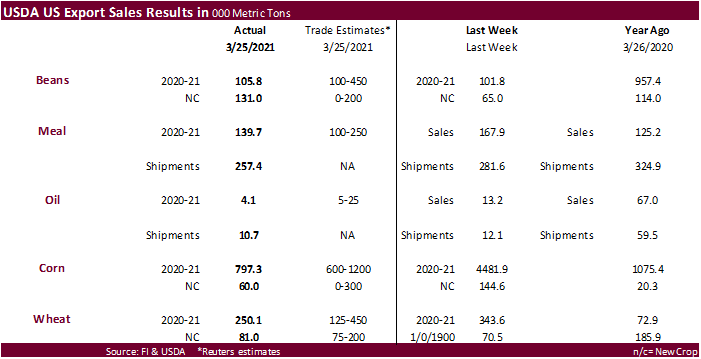
Follow through buying as expected is lifting corn higher. Poor soybean complex export sales is leaning on prices for nearby soybeans, meal, and oil. Bear spreading is a feature. CBOT crush margins are under pressure. Corn is up more than 10 cents on fund buying. Wheat is lower as traders started early with profit taking ahead of the long holiday weekend. As we mentioned yesterday, if wheat traded independently, we think prices would have trended lower due to the large increase in US winter wheat acres. Export sales for wheat and corn were at the low end of expectations. US pork sales were a marketing year high. We are awaiting EIA biofuel data that should include renewable biodiesel data. COT Commitment of Traders and the US unemployment report will be released on Friday. CBOT will be closed Friday, opening back up Sunday night.
![]()
World Weather Inc.
MARKET WEATHER MENTALITY FOR CORN AND SOYBEANS:
Weather conditions in Argentina and Brazil will be mostly good for a while. The only concern is over Safrinha corn in interior southern Brazil because of late planting and a forecast of normally ending monsoonal rainfall. There is also concern over U.S. weather that might trend drier biased later this year. These may be some of the reasons why corn has been in a trading range with favorable support.
South Africa corn and sorghum is still expected to yield well. India weather during the winter was favorable, although not quite as good as last year. Southeast Asia corn in Thailand is slow getting started, but a boost in rainfall in April should improve the situation. China is expected have a good start to planting and U.S. planting is also expected to go swiftly because of warm temperatures and lighter biased rainfall at times.
Overall, today’s weather may have a minor role to play in futures trade following the USDA reports of Wednesday.
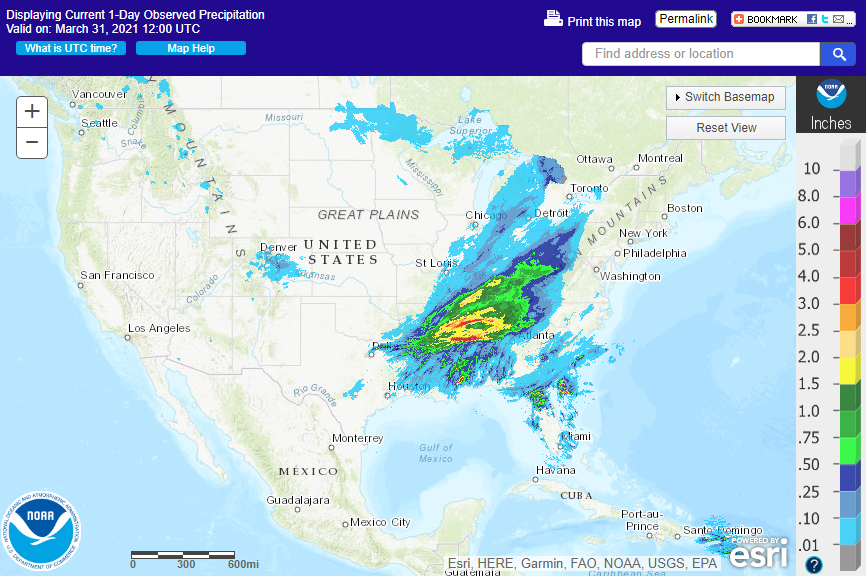
MARKET WEATHER MENTALITY FOR WHEAT: Limited winterkill in Russia, Europe and China and a mostly good India crop will maintain some weakness in daily trade. However, ongoing dryness in the northern U.S. Plains, Canada’s Prairies and developing heat and dryness in U.S. hard red winter wheat areas will give some support to the market trade even though there is some potential for rain in the north next week.
Weather today will produce a mixed influence on market weather mentality with other factors having greater influence on the market trade.
Source: World Weather inc.
Bloomberg Ag Calendar
Thursday, April 1:
- USDA weekly crop net-export sales for corn, soybeans, wheat, cotton, pork, beef, 8:30am
- Port of Rouen data on French grain exports
- Australia commodity index
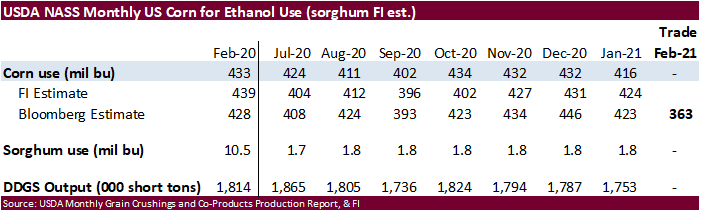
- U.S. corn for ethanol, soybean crush, DDGS production, 3pm
- HOLIDAY: Mexico, Argentina and several other Latin American countries
Friday, April 2:
- CFTC commitments of traders weekly report on positions for various U.S. futures and options, 3:30pm
- HOLIDAY: Good Friday holiday across most of Europe, Africa, Americas and parts of Asia
Source: Bloomberg and FI
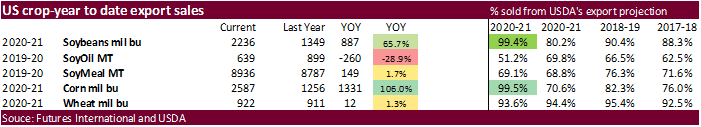
USDA export sales
US export sales for the soybean complex came in on the light side for all three commodities. Soybean sales of 105,800 tons old crop included 124,000 tons for China (66k switched from unknown). New crop soybean sales were 131,000 tons. USDA soybean shipments were a marketing year low of 460,900 tons. Soybean meal shipments were good at 257,400 tons and SBO shipments were 10,700 tons (down from 13,200 tons previous week). Corn export sales were 797,300 tons old-crop, lower end of trade expectations (no China). All-wheat sales of 250,100 tons for 2020-21 were within expectations but new-crop was light at 81,000 tons. The wheat sales include China switching 130,000 tons from unknown. Pork sales were a large 61,000 tons-a marketing year high. Sorghum sales of 121,000 tons were good and included China for 176,000 tons (55k switched from unknown) & decreases for unknown.
Macro
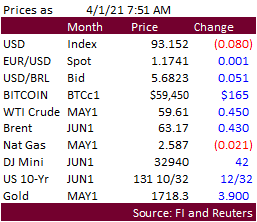
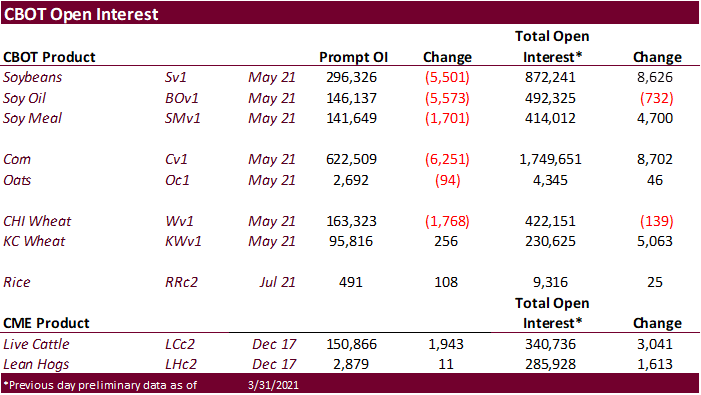
- CBOT is higher on follow through buying post bullish USDA Prospective Plantings report but gain may be capped from positioning ahead of the long holiday weekend and profit taking. Nearby rolling prices hit their highest level since 2013. May gapped higher ($5.72 last absolute high early Feb.) and $6.00 is not out of reach, but in order to see that occur US corn inspections need to improve.
- Funds on Wednesday bought an estimated net 35,000 corn contracts.
- CFTC COT will be released Friday.
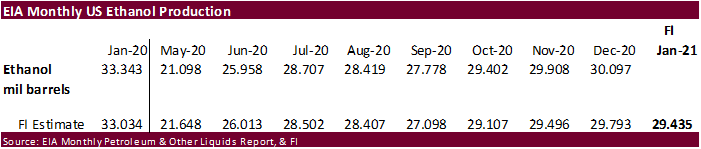
- Weekly US ethanol production was up 43,000 barrels (trade looking for 12k) from the previous week and stocks off a large 695,000 barrels (trade looking for 62k increase).
- The USDA Broiler Report showed eggs set in the US down slightly and chicks placed down 2 percent. Cumulative placements from the week ending January 9, 2021 through March 27, 2021 for the United States were 2.24 billion. Cumulative placements were down 2 percent from the same period a year earlier.
Export developments.
- None reported
EIA: State gasoline taxes average about 30 cents per gallon
https://www.eia.gov/todayinenergy/detail.php?id=47376&src=email#
- Bear spreading in nearby soybeans, meal and soybean oil created a late overnight session two-sided trade. Poor export sales for the soybean complex may keep May contracts on the defensive. New crop continues to be supported by a smaller than expected US soybean planted area. Look for a choppy trade on fund positioning. Today marks a new month and new quarter.
- Funds on Wednesday bought an estimated net 33,000 soybean contracts, bought 18,000 soybean meal and bought an estimated 15,000 soybean oil.
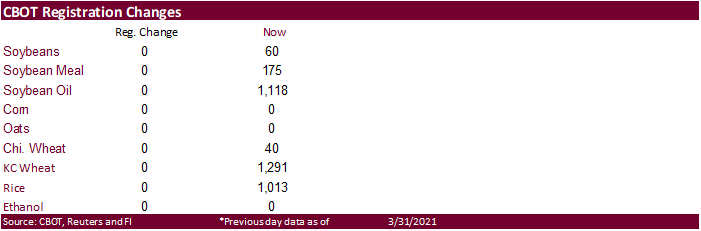
- There were no changes to CBOT registrations.
- Rotterdam vegetable oil prices were 20-30 euros higher for the nearby positions from this time yesterday morning (some prices were hard to find). Rotterdam meal was mostly 20-30 euros higher as well.
- Offshore values were leading CBOT SBO 129 points lower (95 higher for the week to date) and meal $5.90 short ton lower ($7.30 lower for the week).
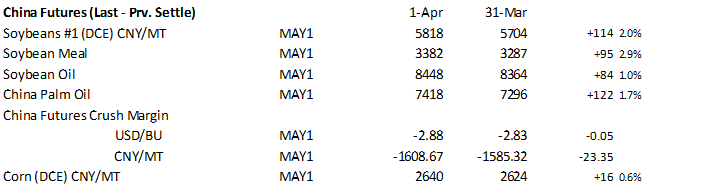
- China cash crush margins on our analysis were 159 (167 previous) vs. 169 cents late last week and compares to 207 cents year earlier.
China futures:
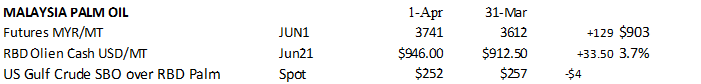
Malaysian palm oil: (uses settle price)
Export Developments
- The USDA seeks 540 tons refined veg oil, under the McGovern-Dole Food for Education export program (470 tons in 4-liter cans and 70 tons in 4-liter plastic bottles/cans) on April 6 for May 1-31 (May 16 – Jun 15 for plants at ports) shipment.
- US wheat is on the defensive from early profit taking ahead of the long holiday weekend but a series of global export tenders this week is seen limiting losses. USDA reported an upward revision to the US winter wheat area yesterday but on our working supply estimates, all-wheat US production was expected to increase about 30 million bushels from previous estimate. Bottomline is the US carryout is expected to remain large.
- EU May milling wheat was down 3.00 at 212.50 euros as of 7:45 am CT.
- Funds on Wednesday bought an estimated net 13,000 CBOT SRW wheat contracts.
- Saudi Arabia’s SAGO seeks 295,000 tons of 12.5% protein wheat on Friday for arrival during May and June.
- Reuters noted SK millers bought another 65,000 tons of US wheat for July and August shipment. 80k was bought from US and Canada on Wednesday.
- Yesterday Algeria’s OAIC bought optional-origin milling wheat. Some people put it at around 400,000-550,000 tons at around $279 a ton c&f (April-May shipment).
- Jordan seeks 120,000 tons of animal feed barley on April 6.
- Ethiopia seeks 400,000 tons of optional origin milling wheat, on April 20, valid for 30 days. In January Ethiopia cancelled 600,000 tons of wheat from a November import tender because of contractual disagreements.
Rice/Other
· Iraq seeks 30,000 tons of rice on April 5, valid until April 8.
· Mauritius seeks 4,000 tons of optional origin long grain white rice on April 16 for delivery between June 1 and July 31.
· Syria seeks 39,400 tons of white rice on April 19. Origin and type might be White Chinese rice or Egyptian short grain rice.
· Ethiopia seeks 170,000 tons of parboiled rice on April 20.
USDA export sales data:
This summary is based on reports from exporters for the period March 19 – 25, 2021.
Wheat: Net sales of 250,100 metric tons (MT) for 2020/2021 were down 27 percent from the previous week and 22 percent from the prior 4-week average. Increases primarily for China (130,000 MT, switched from unknown destinations), the Philippines (123,300 MT, including 60,000 MT switched from Indonesia and decreases of 700 MT), South Korea (104,000 MT), Bangladesh (55,000 MT, switched from Indonesia), and Algeria (30,000 MT), were offset by reductions primarily for unknown destinations (120,000 MT) and Indonesia (114,900 MT). For 2021/2022, net sales of 81,000 MT were reported for the Philippines (52,000 MT), South Korea (21,000 MT), and Mexico (8,000 MT). Exports of 268,700 MT were down 59 percent from the previous week and 51 percent from the prior 4-week average. The destinations were primarily to Nigeria (80,100 MT), the Philippines (58,300 MT), Japan (30,600 MT), the Dominican Republic (27,100 MT), and Vietnam (26,000 MT).
Corn: Net sales of 797,300 MT for 2020/2021 were down 82 percent from the previous week and 46 percent from the prior 4-week average. Increases primarily for Japan (273,100 MT, including 143,700 MT switched from unknown destinations and decreases of 600 MT), Colombia (245,000 MT, including 41,000 MT switched from unknown destinations and decreases of 106,800 MT), Saudi Arabia (139,200 MT, including 74,200 MT switched from unknown destinations), South Korea (123,500 MT, including decreases of 6,500 MT), and Mexico (83,800 MT, including decreases of 24,400 MT), were offset by reductions primarily for unknown destinations (228,800 MT). For 2021/2022, total net sales of 60,000 MT were for Mexico. Exports of 1,977,500 MT were unchanged from the previous week, but up 2 percent from the prior 4-week average. The destinations were primarily to Japan (434,200 MT), Mexico (298,100 MT), China (275,000 MT), Colombia (263,900 MT), and Taiwan (165,900 MT).
Optional Origin Sales: For 2020/2021, new optional origin sales of 5,300 MT were reported for the China (4,800 MT) and unknown destinations (500 MT). Options were exercised to export 65,000 MT to South Korea from the United States. The current outstanding balance of 830,700 MT is for South Korea (484,000 MT), unknown destinations (244,500 MT), China (69,800 MT), and the Ukraine (32,400 MT).
Export Adjustment: Accumulated exports of corn to Egypt were adjusted down 58,000 MT for week ending March 18th. The correct destination was Saudi Arabia.
Barley: For 2020/2021, net sales of 100 MT were primarily for Taiwan. Export of 400 MT were down 41 percent from the previous week, but up 22 percent from the prior 4-week average. The destinations were primarily to Taiwan (200 MT) and Canada (200 MT).
Sorghum: For 2020/2021, net sales of 121,000 MT resulting in increases for China (176,000 MT, including 55,000 MT switched from unknown destinations, decreases of 13,200 MT, and 59,300 MT – late), were offset by reductions for unknown destinations (55,000 MT). For 2021/2022, total net sales of 63,000 MT were for China. Exports of 306,300 MT were up noticeably from the previous week and from the prior 4-week average. The destination was China (including 59,300 MT – late).
Late Reporting: For 2020/2021, net sales and exports totaling 59,300 MT were reported late for China.
Rice: Net sales of 55,500 MT for 2020/2021 were up 4 percent from the previous week, but down 23 percent from the prior 4-week average. Increases primarily for Japan (25,000 MT), Guatemala (10,500 MT, including 2,400 MT switched from El Salvador), Nicaragua (8,700 MT), Mexico (5,600 MT), and Canada (2,300 MT), were offset by reductions primarily for Honduras (1,200 MT). Exports of 62,300 MT were up noticeably from the previous week, but down 19 percent from the prior 4-week average. The destinations were primarily to Honduras (24,100 MT), Haiti (7,000 MT), El Salvador (6,800 MT), Guatemala (4,700 MT), and Canada (4,300 MT).
Soybeans: Net sales of 105,800 MT for 2020/2021 were up 4 percent from the previous week, but down 54 percent from the prior 4-week average. Increases primarily for China (124,000 MT, including 66,000 MT switched from unknown destinations), Egypt (49,300 MT, switched from unknown destinations), Japan (44,100 MT, including 52,500 MT switched from unknown destinations and decreases of 11,900 MT), Belgium (27,700 MT, including 30,000 MT switched from unknown destinations and decreases of 2,300 MT), and Colombia (19,700 MT, including 8,000 MT switched from unknown destinations and decreases of 2,100 MT), were offset by reductions primarily for unknown destinations (216,500 MT). For 2021/2022, net sales of 131,000 MT were reported for Pakistan (55,000 MT), unknown destinations (42,000 MT), and Mexico (34,000 MT). Exports of 460,900 MT–a marketing-year low–were down 8 percent from the previous week and 35 percent from the prior 4-week average. The destinations were primarily to Japan (90,600 MT), Mexico (89,700 MT), China (79,000 MT), Egypt (49,300 MT), and Belgium (27,700 MT).
Exports for Own Account: The current exports for own account outstanding balance is 5,800 MT, all Canada.
Soybean Cake and Meal: Net sales of 139,700 MT for 2020/2021 were down 17 percent from the previous week and 34 percent from the prior 4-week average. Increases primarily for Colombia (66,200 MT, including decreases of 2,500 MT), Canada (19,900 MT, including decreases of 100 MT), Guatemala (10,000 MT, including 6,000 MT switched from Nicaragua, 4,700 MT switched from El Salvador, and decreases of 1,300 MT), Jamaica (9,000 MT), and Mexico (9,000 MT, including decreases of 100 MT), were offset by reductions primarily for Nicaragua (5,300 MT) and El Salvador (2,900 MT). For 2021/2022, total net sales reductions of 300 MT were for Canada. Exports of 257,400 MT were down 9 percent from the previous week and 13 percent from the prior 4-week average. The destinations were primarily to Colombia (70,600 MT), the Philippines (50,400 MT), Mexico (33,400 MT), Honduras (24,300 MT), and Canada (22,700 MT).
Soybean Oil: Net sales of 4,100 MT for 2020/2021 were down 69 percent from the previous week and 62 percent from the prior 4-week average. Increases primarily for Nicaragua (2,200 MT), the Dominican Republic (1,700 MT), El Salvador (1,300 MT), and Mexico (500 MT), were offset by reductions for Canada (900 MT) and Jamaica (700 MT). Exports of 10,700 MT were down 12 percent from the previous week and 66 percent from the prior 4-week average. The destinations were primarily to Colombia (5,000 MT), the Dominican Republic (4,200 MT), Mexico (1,000 MT), and Canada (400 MT).
Cotton: Net sales of 78,400 RB for 2020/2021 were down 71 percent from the previous week and from the prior 4-week average. Increases primarily for Vietnam (97,300 RB, including 13,600 RB switched from China, 1,400 RB switched from South Korea, and 400 RB switched from Japan), Pakistan (37,300 RB), Turkey (28,100 RB, including decreases of 8,800 RB), Mexico (14,100 RB, including decreases of 100 RB), and China (13,500 RB, including decreases of 24,200 RB), were offset by reductions primarily for Indonesia (119,500 RB). For 2021/2022, net sales of 41,400 RB primarily for South Korea (19,800 RB), Vietnam (13,200 RB), Turkey (9,700 RB), Mexico (2,000 RB), and Pakistan (1,800 RB), were offset by reductions for Indonesia (6,300 RB). Exports of 324,700 RB were up 4 percent from the previous week, but down 7 percent from the prior 4-week average. Exports were primarily to Vietnam (70,300 RB), China (63,300 RB), Pakistan (56,300 RB), Turkey (35,200 RB), and Bangladesh (24,000 RB). Net sales of Pima totaling 4,300 RB–a marketing-year low–were down 38 percent from the previous week and 49 percent from the prior 4-week average. Increases primarily for India (3,100 RB), Japan (600 RB), Bangladesh (300 RB), South Korea (300 RB), and Indonesia (100 RB), were offset by reductions primarily for Italy (100 RB). Exports of 14,300 RB were up 54 percent from the previous week and 9 percent from the prior 4-week average. The destinations were primarily to India (11,300 RB), Peru (1,000 RB), Pakistan (900 RB), Vietnam (500 RB), and South Korea (400 RB).
Exports for Own Account: For 2020/2021, new exports for own account totaling 500 RB were to Vietnam. Exports for own account totaling 4,700 RB to Vietnam (3,100 RB) and China (1,600 RB) were applied to new or outstanding sales. The current exports for own account outstanding balance of 30,200 RB is for China (23,600 RB), Vietnam (6,200 RB), and Bangladesh (400 RB).
Hides and Skins: Net sales of 357,600 pieces for 2021 were down 36 percent from the previous week and 28 percent from the prior 4-week average. Increases primarily for China (193,900 whole cattle hides, including decreases of 26,700 pieces), South Korea (72,500 whole cattle hides, including decreases of 2,400 pieces), Thailand (47,700 whole cattle hides, including decreases of 800 pieces), Mexico (27,900 whole cattle hides, including decreases of 3,400 pieces), and Spain (5,700 whole cattle hides), were offset by reductions primarily for Taiwan (700 pieces) and Brazil (100 pieces). Total net sales reductions of 300 calf skins were for Italy. In additions, total net sales of 1,800 kip skins, including decreases of 1,000 pieces, were for Belgium. Exports of 411,100 pieces for 2021 were up 9 percent from the previous week and 8 percent from the prior 4-week average. Whole cattle hides exports were primarily to China (259,500 pieces), South Korea (63,800 pieces), Mexico (33,400 pieces), Thailand (29,900 pieces), and Taiwan (11,400 pieces). Exports of 800 calf skins were to Italy. Additionally, exports of 3,500 kip skins were primarily to Belgium (2,600 kip skins).
Net sales of 222,900 wet blues for 2021 were up 1 percent from the previous week and 67 percent from the prior 4-week average. Increases primarily for Italy (83,500 unsplit), China (75,600 unsplit and 2,300 grain splits), Mexico (42,900 grain splits), Vietnam (15,700 unsplit), and South Korea (1,600 grain split), were offset by reductions primarily for Thailand (100 unsplit). Exports of 165,400 wet blues for 2021 were up 65 percent from the previous week and 64 percent from the prior 4-week average. The destinations were primarily to China (50,700 unsplit and 4,800 grain splits), Vietnam (34,500 unsplit), Italy (17,200 unsplit and 6,400 grain splits), Mexico (14,700 grain splits and 1,000 unsplit), and Thailand (13,300 unsplit). Net sales of 161,500 splits were primarily for Taiwan (86,000 pounds), China (71,700 pounds), and Italy (3,100 pounds). Exports of 329,100 pounds were to Vietnam (237,800 pounds), Italy (47,100 pounds), and China (44,200 pounds).
Beef: Net sales of 18,700 MT reported for 2021 were down 1 percent from the previous week and 15 percent from the prior 4-week average. Increases primarily for Japan (6,000 MT, including decreases of 700 MT), China (5,900 MT, including decreases of 100 MT), South Korea (2,600 MT, including decreases of 600 MT), Canada (1,100 MT, including decreases of 100 MT), and Hong Kong (800 MT, including decreases of 100 MT), were offset by reductions primarily for Kuwait (100 MT). Exports of 18,600 MT were unchanged from the previous week, but up 1 percent from the prior 4-week average. The destinations were primarily to Japan (5,400 MT), South Korea (5,100 MT), China (2,900 MT), Mexico (1,400 MT), and Canada (800 MT).
Pork: Net sales of 61,000 MT reported for 2021–a marketing-year high–were up 58 percent from the previous week and 43 percent from the prior 4-week average. Increases were primarily for China (29,700 MT, including decreases of 1,200 MT), Mexico (15,800 MT, including decreases of 500 MT), Japan (4,600 MT, including decreases of 200 MT), Canada (3,700 MT, including decreases of 400 MT), and Australia (2,200 MT, including decreases of 300 MT). Exports of 40,400 MT were up 5 percent from the previous week and 2 percent from the prior 4-week average. The destinations were primarily to China (11,900 MT), Mexico (9,900 MT), Japan (5,200 MT), South Korea (4,000 MT), and Colombia (1,800 MT).
U.S. EXPORT SALES FOR WEEK ENDING 3/25/2021
|
|
CURRENT MARKETING YEAR |
NEXT MARKETING YEAR |
||||||
|
COMMODITY |
NET SALES |
OUTSTANDING SALES |
WEEKLY EXPORTS |
ACCUMULATED EXPORTS |
NET SALES |
OUTSTANDING SALES |
||
|
CURRENT YEAR |
YEAR |
CURRENT YEAR |
YEAR |
|||||
|
|
THOUSAND METRIC TONS |
|||||||
|
WHEAT |
|
|
|
|
|
|
|
|
|
HRW |
98.0 |
1,426.7 |
1,812.1 |
70.1 |
7,087.1 |
7,492.2 |
13.0 |
296.5 |
|
SRW |
-11.5 |
331.4 |
279.2 |
11.7 |
1,451.5 |
2,060.1 |
4.0 |
317.3 |
|
HRS |
61.7 |
1,550.7 |
1,537.5 |
159.2 |
5,927.0 |
5,710.2 |
58.5 |
368.5 |
|
WHITE |
101.8 |
2,030.7 |
1,148.5 |
27.6 |
4,628.6 |
3,830.3 |
5.5 |
188.8 |
|
DURUM |
0.0 |
78.3 |
230.4 |
0.0 |
592.1 |
682.3 |
0.0 |
5.0 |
|
TOTAL |
250.1 |
5,417.7 |
5,007.7 |
268.7 |
19,686.3 |
19,775.1 |
81.0 |
1,176.1 |
|
BARLEY |
0.1 |
5.8 |
10.7 |
0.4 |
23.1 |
38.7 |
0.0 |
20.2 |
|
CORN |
797.3 |
31,808.4 |
13,600.8 |
1,977.5 |
33,917.6 |
18,306.6 |
60.0 |
1,999.5 |
|
SORGHUM |
121.0 |
2,562.8 |
1,255.6 |
306.3 |
3,824.7 |
1,417.2 |
63.0 |
819.0 |
|
SOYBEANS |
105.8 |
6,024.9 |
5,102.0 |
460.9 |
54,816.7 |
31,607.2 |
131.0 |
5,272.2 |
|
SOY MEAL |
139.7 |
2,476.8 |
2,851.5 |
257.4 |
6,459.6 |
5,935.4 |
-0.3 |
250.0 |
|
SOY OIL |
4.1 |
107.4 |
286.4 |
10.7 |
531.8 |
612.6 |
0.0 |
0.6 |
|
RICE |
|
|
|
|
|
|
|
|
|
L G RGH |
25.1 |
316.2 |
328.3 |
39.4 |
1,092.6 |
979.0 |
0.0 |
0.0 |
|
M S RGH |
0.0 |
5.3 |
44.4 |
0.0 |
23.5 |
24.9 |
0.0 |
0.0 |
|
L G BRN |
0.1 |
3.7 |
20.7 |
0.5 |
33.9 |
36.7 |
0.0 |
0.0 |
|
M&S BR |
0.0 |
69.0 |
63.1 |
0.6 |
84.4 |
45.2 |
0.0 |
0.0 |
|
L G MLD |
3.7 |
49.4 |
94.0 |
12.6 |
453.6 |
648.8 |
0.0 |
0.0 |
|
M S MLD |
26.6 |
261.1 |
255.0 |
9.2 |
369.7 |
405.3 |
0.0 |
0.0 |
|
TOTAL |
55.5 |
704.7 |
805.4 |
62.3 |
2,057.6 |
2,139.9 |
0.0 |
0.0 |
|
COTTON |
|
THOUSAND RUNNING BALES |
||||||
|
UPLAND |
78.4 |
5,105.5 |
6,665.1 |
324.7 |
9,471.5 |
8,627.3 |
41.4 |
1,542.9 |
|
PIMA |
4.3 |
247.5 |
211.4 |
14.3 |
491.8 |
328.2 |
0.0 |
1.1 |
Terry Reilly
Senior Commodity Analyst – Grain and Oilseeds
Futures International
One Lincoln Center
18 W 140 Butterfield Rd.
Oakbrook Terrace, Il. 60181
W: 312.604.1366
ICE IM: treilly1
Skype: fi.treilly

Trading of futures, options, swaps and other derivatives is risky and is not suitable for all persons. All of these investment products are leveraged, and you can lose more than your initial deposit. Each investment product is offered only to and from jurisdictions where solicitation and sale are lawful, and in accordance with applicable laws and regulations in such jurisdiction. The information provided here should not be relied upon as a substitute for independent research before making your investment decisions. Futures International, LLC is merely providing this information for your general information and the information does not take into account any particular individual’s investment objectives, financial situation, or needs. All investors should obtain advice based on their unique situation before making any investment decision. The contents of this communication and any attachments are for informational purposes only and under no circumstances should they be construed as an offer to buy or sell, or a solicitation to buy or sell any future, option, swap or other derivative. The sources for the information and any opinions in this communication are believed to be reliable, but Futures International, LLC does not warrant or guarantee the accuracy of such information or opinions. Futures International, LLC and its principals and employees may take positions different from any positions described in this communication. Past results are not necessarily indicative of future results.