PDF attached
Day
15. Many markets are seeing a reversal from yesterday’s action. Apparently, peace talks broke down earlier today and the market is widely reacting to that. To compound the reversal, US inflation fears amplified after the CPI confirmed rising prices. Russia
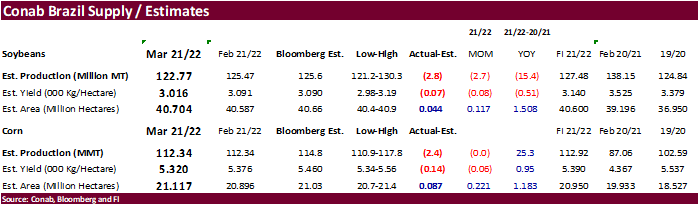
also seeks to ban a number of products/raw material exports to selected countries. USDA export sales were very good with the exception of wheat. Brazil Conab cut corn production and left soybeans nearly unchanged. Malaysian palm oil production last month
was less than expected, offset by lower than anticipated exports. It is rumored that another 8 cargos of French wheat have been sold to Mexico. A few new wheat import tenders were posted.
US
CPI (M/M) Feb: 0.8% (est 0.8%; prev 0.6%)
US
CPI Ex Food And Energy (M/M) Feb: 0.5% (est 0.5%; prev 0.6%)
US
CPI (Y/Y) Feb: 7.9% (est 7.9%; prev 7.5%)
US
CPI Ex Food And Energy (Y/Y) Feb: 6.4% (est 6.4%; prev 6.0%)
US
CPI Index NSA Feb: 283.716 (est 283.700; prev 281.148)
WORLD
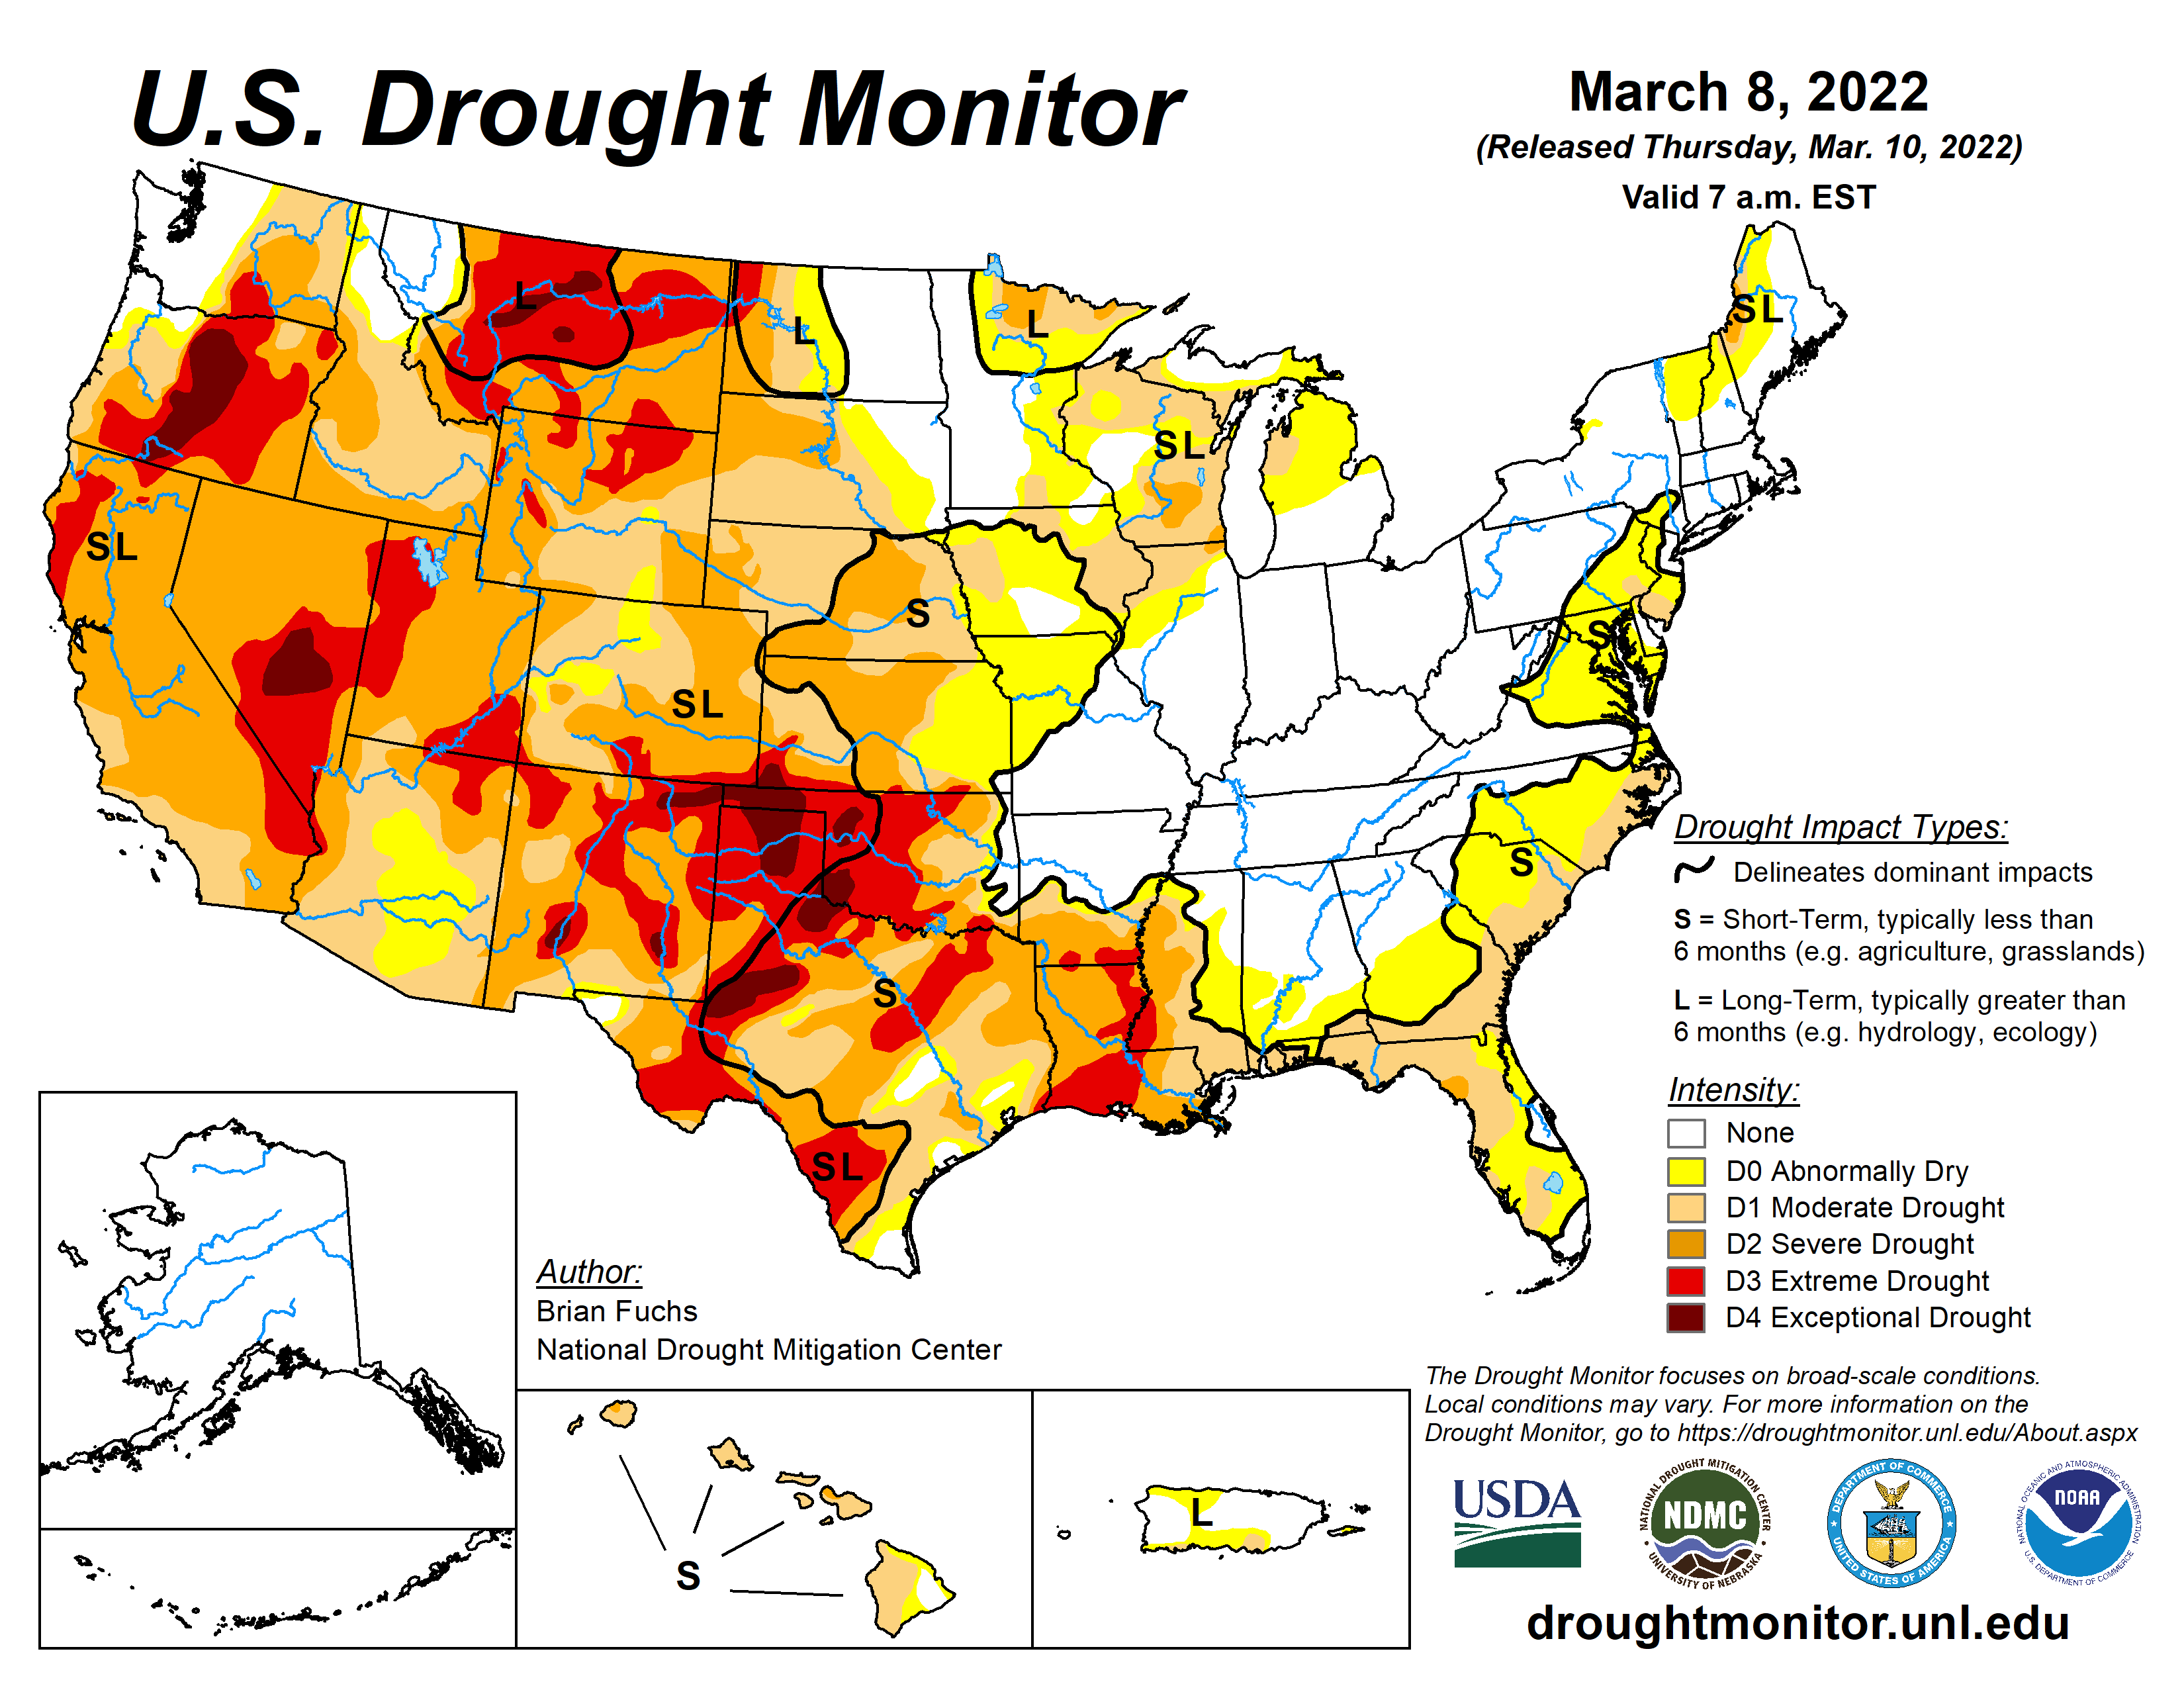
WEATHER HIGHLIGHTS FOR MARCH 10, 2022
-
Some
light snow will fall across U.S. hard red winter wheat areas today. -
Another
storm is possible in the central U.S. Plains during mid-week next week; however, the system is likely too intense and may be too far to the west which should leave the high Plains region drier than usual.
-
The
next few weeks are most favored for a little relief to dryness in the central Plains, but it is not likely to be sustainable beyond mid-April.
-
The
U.S. southeastern states are getting some needed rain and more is expected, but freezes Sunday morning may set back wheat development and could damage some fruit and vegetable crops.
-
West
and South Texas precipitation will remain restricted during the next ten days
-
Rain
will fall often enough to keep the lower and eastern U.S. Midwest, Delta and Tennessee River Basin a little too wet at times this spring.
-
Southern
Argentina is still expecting drier than usual weather for up to ten days, but good subsoil moisture and a lack of excessive heat should help late season crops get through the dry period without much impact.
-
Other
areas in Argentina and Brazil will get a good balance of rain and sunshine over the next couple of weeks maintaining good crop development potential.
-
Russia’s
bitter cold is not threatening winter crops because of snow cover and the same is expected in U.S. hard red winter wheat areas Friday and Saturday mornings.
-
Southwestern
Europe and northwestern Africa will be getting some much needed rain in the next ten days improving winter and spring crop prospects.
-
Rain
will also occur over the next ten days from the Middle East into western Xinjiang, China’s Mountains including parts of Kazakhstan, Uzbekistan and Tajikistan.
-
Eastern
China winter crops may be greening up and rain next week will stimulate early season crop development in some areas that remain warm.
Source:
World Weather Inc.
- USDA
weekly net-export sales for corn, soybeans, wheat, cotton, pork and beef, 8:30am - Malaysian
Palm Oil Board’s monthly data for output, exports and stockpiles - U.S.
National Coffee Association Virtual Convention, day 3 - Malaysia’s
March 1-10 palm oil export data - Brazil’s
Unica may release cane crush and sugar output data (tentative)
Friday,
March 11:
- ICE
Futures Europe weekly commitments of traders report, ~1:30pm - CFTC
commitments of traders weekly report on positions for various U.S. futures and options, 3:30pm - FranceAgriMer
weekly update on crop conditions - New
Zealand Food Prices
Source:
Bloomberg and FI
USDA
export sales
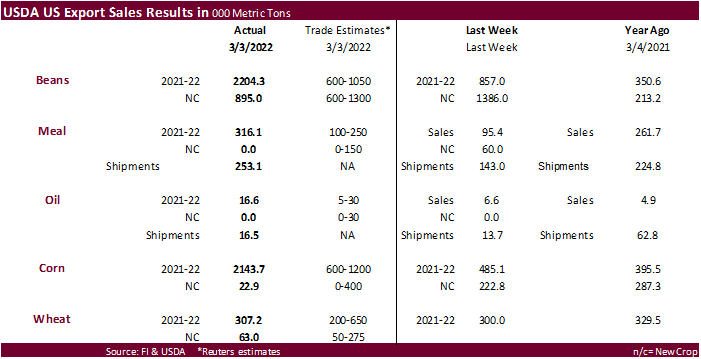
Very
good sales were posted for soybeans, corn and meal. Corn sales were a marketing year high (unknown 800,600 tons) and China was a large 2021-22 taker of soybeans.
US
CPI (M/M) Feb: 0.8% (est 0.8%; prev 0.6%)
US
CPI Ex Food And Energy (M/M) Feb: 0.5% (est 0.5%; prev 0.6%)
US
CPI (Y/Y) Feb: 7.9% (est 7.9%; prev 7.5%)
US
CPI Ex Food And Energy (Y/Y) Feb: 6.4% (est 6.4%; prev 6.0%)
US
CPI Index NSA Feb: 283.716 (est 283.700; prev 281.148)
·
CBOT corn is
higher on higher energy prices, very good USDA export sales and thoughts China is starting to look at US agriculture grains for imports.
·
The weekly USDA Broiler report showed broiler-type eggs set in the United States up slightly and chicks placed down 1 percent. Cumulative placements from the week ending January 8, 2022, through March 5, 2022, for the United
States were 1.67 billion. Cumulative placements were down 1 percent from the same period a year earlier.
Export
developments.
-
Results
awaited: Iran’s SLAL seeks up to 60,000 tons of feed barley, 60,000 tons of feed corn and 60,000 tons of soymeal for March and April shipment.
·
Soybeans, meal and oil are rallying on inflation fears, reversal in outside markets and great USDA export sales.
·
There were no USDA 24-hour sales announcements this morning.
·
China plans to sell 295,596 tons of soybeans from reserves on March 14.
·
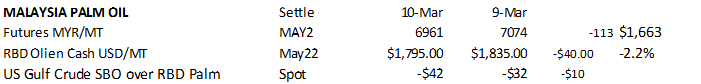
AmSpec reported Malaysian palm oil exports for the March 1-10 period at 370,492 tons versus 320,508 tons for the same period month earlier.
·
May Malaysian palm oil settled 113 ringgit lower. Cash palm was down $40/ton to $1,795/ton.
·
From this time yesterday morning Rotterdam meal was unchanged to 4 euros lower and vegetable oils 5-15 euros lower.
·
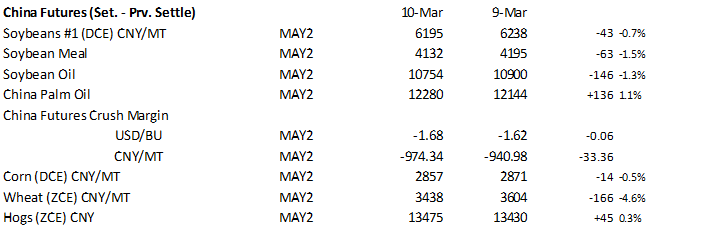
China May soybeans were down 0.7%, meal down 1.5%, soybean oil down 1.3% and palm 1.1% higher.
·
Offshore values are leading SBO 54 points higher and meal $7.70 short ton lower.
-
Results
awaited: Iran’s state purchasing agency GTC has issued an international tender to purchase about 30,000 tons of soyoil for March and April shipment.
-
Results
awaited: Iran’s SLAL seeks up to 60,000 tons of soymeal for March and April shipment.
·
US wheat futures are higher on ongoing Black Sea concerns.
·
It is rumored that another 8 cargos of French wheat have been sold to Mexico.
·
May Paris wheat futures were up 11.75 euros at 384 euros earlier.
·
A few more global import tenders were announced. Algeria may have bought up to 700,000 tons of wheat.
·
Poor growing conditions in China and US Great Plains should be monitored this spring.
·
Algeria bought 600,000 to 700,000 tons of milling wheat at around $485 a ton c&f for May shipment.
·
Tunisia seeks 125,000 tons of soft wheat and 100,000 tons of feed barley on Friday for shipment between March 20-May 20.
·
Japan seeks 163,276 tons of food wheat on Friday.
·
Jordan seeks 120,000 tons of wheat on March 16.
·
Taiwan seeks 50,000 tons of US PNW milling wheat on March 11 for April 23-May 7 shipment.
·
Jordan’s state grains buyer seeks 120,000 tons of feed barley on March 15. Shipment is between July 16-31, Aug. 1-15, Aug. 16-31 and Sept. 1-15.
·
Bangladesh seeks 50,000 tons of milling wheat on March 16 for shipment within 40 days of contract signing.
·
Japan’s AgMin in a SBS import tender on March 16 seeks 80,000 tons of feed wheat and 100,000 tons of feed barley for arrival by Aug. 25.
Rice/Other
·
(Bloomberg) — U.S. 2021-22 cotton ending stocks seen at 3.37m bales, 127,000 bales below USDA’s previous est., according to the avg in a Bloomberg survey of seven analysts.
-Estimates range from 3.1m to 3.65m bales
-Global ending stocks seen unchanged at 84.31m bales
Very good sales were posted for soybeans, corn and meal. Corn sales were a marketing year high (unknown) and China was a large 2021-22 taker of soybeans.
This
summary is based on reports from exporters for the period February 25-March 3, 2022.
Wheat: Net
sales of 307,200 metric tons (MT) for 2021/2022 were up 2 percent from the previous week and 21 percent from the prior 4-week average. Increases primarily for the Philippines (133,100 MT), Mexico (111,700 MT, including decreases of 26,300 MT), Japan (26,200
MT), Colombia (17,400 MT), and the Dominican Republic (13,100 MT, including decreases of 100 MT), were offset by reductions for El Salvador (1,400 MT), South Korea (1,000 MT), and Taiwan (100 MT). Net sales of 63,000 MT for 2022/2023 were reported for the
Philippines (50,000 MT) and Mexico (13,000 MT). Exports of 384,500 MT were up 5 percent from the previous week, but down 10 percent from the prior 4-week average. The destinations were primarily to Mexico (88,200 MT), Japan (66,600 MT), the Philippines (65,100
MT), Thailand (58,500 MT), and Guatemala (52,100 MT).
Corn:
Net sales of 2,143,700 MT for 2021/2022–a marketing-year high–were up noticeably from the previous week and from the prior 4-week average. Increases primarily for unknown destinations (800,600 MT), Japan (398,400 MT, including 37,500 MT switched from unknown
destinations and decreases of 21,000 MT), Mexico (290,200 MT, including decreases of 40,600 MT), Saudi Arabia (140,000 MT, including 140,000 MT switched from unknown destinations and decreases 2,600 MT), and Colombia (129,600 MT, including 50,000 MT switched
from unknown destinations and decreases of 125,300 MT), were offset by reductions for El Salvador (22,500 MT) and Costa Rica (2,900 MT). Total net sales of 22,900 MT for 2022/2023 were for Mexico. Exports of 1,763,300 MT were up 14 percent from the previous
week and from the prior 4-week average. The destinations were primarily to China (555,100 MT), Mexico (371,700 MT), Colombia (258,400 MT), Japan (205,100 MT), and Saudi Arabia (140,000 MT).
Optional
Origin Sales:
For 2021/2022, new optional origin sales of 115,000 MT were reported for unknown destinations. The current outstanding balance of 285,800 MT is for unknown destinations (180,000 MT), South Korea (65,000 MT), Italy (31,800 MT), and
Saudi Arabia (9,000 MT). For 2022/2023, the current outstanding balance of 3,900 MT is for Italy.
Barley:
No net sales or exports were reported for the week.
Sorghum:
Net sales of 7,100 MT for 2021/2022 were down 93 percent from the previous week and 94 percent from the prior 4-week average. Increases reported for China (72,100 MT, including 65,000 MT switched from unknown destinations and decreases of 400 MT), were offset
by reductions for unknown destinations (65,000 MT). Exports of 206,100 MT were up 49 percent from the previous week and 19 percent from the prior 4-week average. The destination was primarily to China (204,900 MT).
Rice:
Net sales of 36,700 MT for 2021/2022 were down 48 percent from the previous week and 61 percent from the prior 4-week average. Increases primarily for Mexico (14,700 MT), Japan (13,300 MT), Nicaragua (5,400 MT), Canada (2,500 MT), and Guatemala (1,500 MT),
were offset by reductions for Costa Rica (1,500 MT). Exports of 21,600 MT were down 73 percent from the previous week and 74 percent from the prior 4-week average. The destinations were primarily to Haiti (15,300 MT), Canada (3,200 MT), Mexico (2,000 MT),
Taiwan (300 MT), and Hong Kong (200 MT).
Exports
for Own Account:
For 2021/2022, exports for own account totaling 100 MT to Canada were applied to new or outstanding sales.
Soybeans:
Net sales of 2,204,300 MT for 2021/2022 were up noticeably from the previous week and up 76 percent from the prior 4-week average. Increases were primarily for China (1,096,400 MT, including 66,000 MT switched from unknown destinations and decreases of 500
MT), unknown destinations (334,000 MT), Egypt (181,000 MT, including 55,000 MT switched from unknown destinations and decreases of 2,700 MT), Mexico (142,700 MT, including decreases of 80,000 MT), and Vietnam (114,700 MT, including decreases 100 MT). Net
sales of 895,000 MT for 2022/2023 were reported for China (797,000 MT), unknown destinations (66,000 MT), and Mexico (32,000 MT). Exports of 834,900 MT were up 11 percent from the previous week, but down 26 percent from the prior 4-week average. The destinations
were primarily to China (304,600 MT), Egypt (173,000 MT), Mexico (75,800 MT), Indonesia (73,200 MT), and Japan (68,000 MT).
Export
for Own Account:
For 2021/2022, the current exports for own account outstanding balance is 3,000 MT, all Canada.
Soybean
Cake and Meal:
Net sales of 316,100 MT for 2021/2022 were up noticeably from the previous week and up 49 percent from the prior 4-week average. Increases primarily for unknown destinations (47,500 MT), Vietnam (45,000 MT), the Philippines (44,600 MT, including decreases
of 400 MT), Mexico (38,900 MT), and Colombia (37,800 MT, including 19,200 MT switched from unknown destinations and decreases of 300 MT), were offset by reductions primarily for Honduras (3,000 MT), Ecuador (2,900 MT), Belgium (600 MT), Costa Rica (200 MT),
and Taiwan (100 MT). Exports of 253,100 MT were up 77 percent from the previous week and 4 percent from the prior 4-week average. The destinations were primarily to Colombia (66,300 MT), the Dominican Republic (38,900 MT), Mexico (31,600 MT), Venezuela (30,000
MT), and Morocco (19,700 MT).
Soybean
Oil:
Net sales of 16,600 MT for 2021/2022 were up noticeably from the previous week, but down 17 percent from the prior 4-week average. Increases reported for India (18,000 MT switched from Bangladesh), South Korea (12,000 MT), Mexico (5,000 MT, including decreases
of 200 MT), and Canada (200 MT), were offset by reductions for Bangladesh (18,000 MT), the Dominican Republic (500 MT), and Colombia (100 MT). Exports of 16,500 MT were up 21 percent from the previous week, but down 24 percent from the prior 4-week average.
The destinations were to Colombia (6,900 MT), Mexico (3,500 MT), Jamaica (3,500 MT), the Dominican Republic (2,200 MT), and Canada (400 MT).
Cotton:
Net sales of 354,200 RB for 2021/2022 were up 2 percent from the previous week and 51 percent from the prior 4-week average. Increases primarily for China (170,300 RB, including decreases of 800 RB), Turkey (70,500 RB, including decreases of 300 RB), Pakistan
(49,600 RB), Vietnam (35,400 RB, including 1,100 RB switched from Japan), and Indonesia (7,100 RB, including 300 RB switched from Japan and decreases of 900 RB), were offset by reductions for India (4,000 RB) and Nicaragua (100 RB). Net sales of 68,200 RB
for 2022/2023 were primarily for Turkey (28,600 RB), Pakistan (12,600 RB), China (8,800 RB), Mexico (8,200 RB), and Colombia (5,100 RB). Exports of 321,300 RB were down 9 percent from the previous week and 1 percent from the prior 4-week average. The destinations
were primarily to China (108,800 RB), Pakistan (61,800 RB), Turkey (30,400 RB), Vietnam (30,300 RB), and Mexico (26,100 RB). Net sales of Pima totaling 700 RB were down 91 percent from the previous week and 87 percent from the prior 4-week average. Increases
were reported for Italy (500 RB), Indonesia (100 RB), and India (100 RB). Exports of 22,500 RB–a marketing-year high–were up noticeably from the previous week and up 65 percent from the prior 4-week average. The destinations were primarily to India (7,900
RB), China (3,700 RB), Vietnam (3,100 RB), Peru (2,100 RB), and Pakistan (1,700 RB).
Optional
Origin Sales:
For 2021/2022, the current outstanding balance of 61,600 RB is for Vietnam (52,800 RB) and Pakistan (8,800 RB).
Exports
for Own Account: For
2021/2022, the current exports for own account outstanding balance is 100 RB, all Vietnam.
Hides
and Skins:
Net sales of 338,500 pieces for 2022 were down 25 percent from the previous week and 12 percent from the prior 4-week average. Increases primarily for China (251,200 whole cattle hides, including decreases of 22,300 pieces), South Korea (34,600 whole cattle
hides, including decreases of 1,900 pieces), Mexico (26,000 whole cattle hides, including decreases of 600 pieces), Taiwan (15,600 whole cattle hides), and Indonesia (7,200 whole cattle hides, including decreases of 600 pieces), were offset by reductions primarily
for Thailand (2,000 pieces) and Spain (500 pieces). Total net sales reductions of 800 calf skins were for Italy. Exports of 451,700 pieces were up 28 percent from the previous and 21 percent from the prior 4-week average. Whole cattle hides exports were
primarily to China (272,900 pieces), South Korea (76,100 pieces), Mexico (35,300 pieces), Thailand (25,900 pieces), and Indonesia (12,300 pieces).
Net
sales of 129,200 wet blues for 2022 were up noticeably from the previous week and up 56 percent from the prior 4-week average. Increases reported for Italy (49,700 unsplit and 100 grain splits), Vietnam (30,900 unsplit, including decreases of 100 unsplit),
Thailand (21,600 unsplit), China (20,800 unsplit), and Taiwan (6,700 unsplit),
were offset by reductions for Portugal (500 grain splits). Exports of 155,000 wet blues were up noticeably from the previous week and up 48 percent from the prior 4-week average. The destinations were primarily to Italy (30,200 unsplit and 22,600 grain splits),
Vietnam (47,200 unsplit), China (38,100 unsplit), Mexico (2,600 unsplit and 1,900 grain splits), and Portugal (4,300 grain splits). Net sales of 1,897,100 splits resulting in increases for Vietnam (1,908,300 pounds, including decreases of 32,100 pounds),
were offset by reductions for South Korea (11,200 pounds). Exports of 393,300 pounds were to Vietnam.
Beef:
Net sales of 27,500 MT for 2022–a marketing-year high–were up 16 percent from the previous week and 36 percent from the prior 4-week average. Increases were primarily for China (10,400 MT, including decreases of 100 MT), Japan (6,400 MT, including decreases
of 300 MT), South Korea (3,700 MT, including decreases of 500 MT), Canada (1,300 MT), and Taiwan (1,100 MT, including decreases of 100 MT). Exports of 15,900 MT were down 10 percent from the previous week and 1 percent from the prior 4-week average. The
destinations were primarily to South Korea (4,500 MT), Japan (4,100 MT), China (2,600 MT), Taiwan (1,500 MT), and Mexico (1,000 MT).
Pork:
Net sales of 25,400 MT for 2022 were down 40 percent from the previous week and 4 percent from the prior 4-week average. Increases primarily for Mexico (12,800 MT, including decreases of 200 MT), China (3,600 MT, including decreases of 300 MT), South Korea
(2,100 MT, including decreases of 100 MT), Japan (2,000 MT, including decreases of 500 MT), and Honduras (1,200 MT), were offset by reductions for Chile (100 MT). Exports of 28,500 MT were down 5 percent from the previous week and 6 percent from the prior
4-week average. The destinations were primarily to Mexico (11,900 MT), Japan (5,200 MT), China (3,600 MT), South Korea (2,600 MT), and Canada (1,500 MT).
U.S. EXPORT SALES FOR WEEK ENDING 3/3/2022
|
|
CURRENT MARKETING YEAR |
NEXT MARKETING YEAR |
||||||
|
COMMODITY |
NET SALES |
OUTSTANDING SALES |
WEEKLY EXPORTS |
ACCUMULATED EXPORTS |
NET SALES |
OUTSTANDING SALES |
||
|
CURRENT YEAR |
YEAR |
CURRENT YEAR |
YEAR |
|||||
|
|
THOUSAND METRIC TONS |
|||||||
|
WHEAT |
|
|
|
|
|
|
|
|
|
HRW |
73.3 |
1,775.3 |
1,376.1 |
182.4 |
5,655.3 |
6,782.8 |
13.0 |
196.3 |
|
SRW |
12.5 |
584.6 |
413.9 |
17.2 |
2,102.0 |
1,340.7 |
0.0 |
212.5 |
|
HRS |
167.3 |
1,128.1 |
1,941.5 |
99.2 |
3,895.0 |
5,218.6 |
24.0 |
107.6 |
|
WHITE |
54.1 |
551.3 |
2,138.1 |
85.7 |
2,709.1 |
4,236.0 |
26.0 |
117.0 |
|
DURUM |
0.0 |
18.8 |
154.2 |
0.0 |
169.7 |
518.4 |
0.0 |
47.0 |
|
TOTAL |
307.2 |
4,058.0 |
6,023.8 |
384.5 |
14,531.2 |
18,096.5 |
63.0 |
680.4 |
|
BARLEY |
0.0 |
13.8 |
11.5 |
0.0 |
14.7 |
22.0 |
0.0 |
0.0 |
|
CORN |
2,143.7 |
22,669.2 |
31,756.3 |
1,763.3 |
27,533.0 |
27,762.7 |
22.9 |
1,928.6 |
|
SORGHUM |
7.1 |
3,687.4 |
2,844.4 |
206.1 |
2,987.2 |
3,094.1 |
0.0 |
0.0 |
|
SOYBEANS |
2,204.3 |
10,759.6 |
7,111.4 |
834.9 |
41,611.2 |
53,243.3 |
895.0 |
7,646.8 |
|
SOY MEAL |
316.1 |
3,203.5 |
2,720.2 |
253.1 |
5,441.0 |
5,673.9 |
0.0 |
234.7 |
|
SOY OIL |
16.6 |
172.6 |
101.8 |
16.5 |
409.2 |
501.1 |
0.0 |
0.0 |
|
RICE |
|
|
|
|
|
|
|
|
|
L G RGH |
21.6 |
249.6 |
264.6 |
0.6 |
868.1 |
1,007.8 |
0.0 |
0.0 |
|
M S RGH |
0.0 |
8.5 |
9.9 |
0.5 |
5.2 |
19.0 |
0.0 |
0.0 |
|
L G BRN |
0.1 |
17.6 |
12.6 |
0.5 |
31.9 |
24.5 |
0.0 |
0.0 |
|
M&S BR |
0.1 |
44.0 |
70.7 |
0.1 |
42.0 |
81.9 |
0.0 |
0.0 |
|
L G MLD |
0.1 |
88.6 |
76.1 |
18.3 |
524.7 |
401.1 |
0.0 |
0.0 |
|
M S MLD |
14.8 |
192.2 |
224.7 |
1.7 |
250.9 |
347.8 |
0.0 |
0.0 |
|
TOTAL |
36.7 |
600.5 |
658.7 |
21.6 |
1,722.7 |
1,882.2 |
0.0 |
0.0 |
|
COTTON |
|
THOUSAND RUNNING BALES |
||||||
|
UPLAND |
354.2 |
7,760.1 |
5,308.2 |
321.3 |
5,524.3 |
8,481.5 |
68.2 |
2,236.0 |
|
PIMA |
0.7 |
159.0 |
263.2 |
22.5 |
256.9 |
457.8 |
0.0 |
13.6 |
Terry Reilly
Senior Commodity Analyst – Grain and Oilseeds
Futures International
One Lincoln Center
18 W 140 Butterfield Rd.
Suite 1450
Oakbrook Terrace, Il. 60181
W: 312.604.1366
ICE IM:
treilly1
Skype: fi.treilly

Trading of futures, options, swaps and other derivatives is risky and is not suitable for all persons. All of these investment products are leveraged, and you can lose more than your initial deposit. Each investment product is offered
only to and from jurisdictions where solicitation and sale are lawful, and in accordance with applicable laws and regulations in such jurisdiction. The information provided here should not be relied upon as a substitute for independent research before making
your investment decisions. Futures International, LLC is merely providing this information for your general information and the information does not take into account any particular individual’s investment objectives, financial situation, or needs. All investors
should obtain advice based on their unique situation before making any investment decision. The contents of this communication and any attachments are for informational purposes only and under no circumstances should they be construed as an offer to buy or
sell, or a solicitation to buy or sell any future, option, swap or other derivative. The sources for the information and any opinions in this communication are believed to be reliable, but Futures International, LLC does not warrant or guarantee the accuracy
of such information or opinions. Futures International, LLC and its principals and employees may take positions different from any positions described in this communication. Past results are not necessarily indicative of future results.