PDF attached
USDA released their November S&D and crop production reports
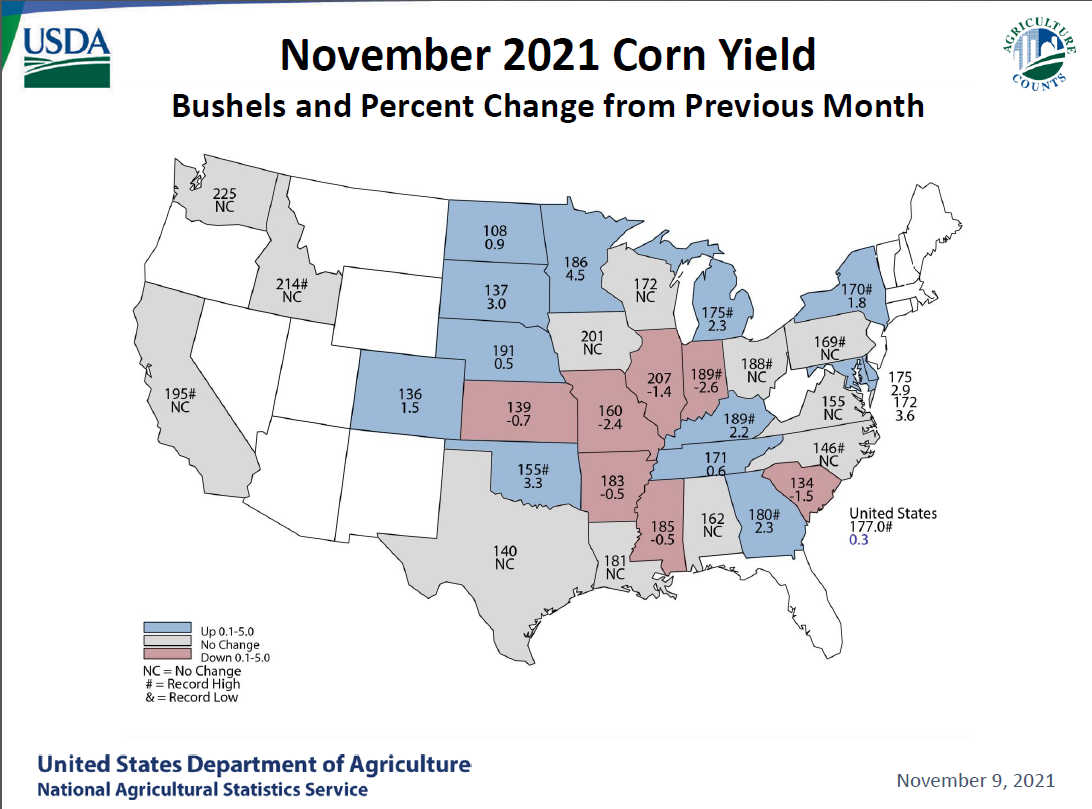
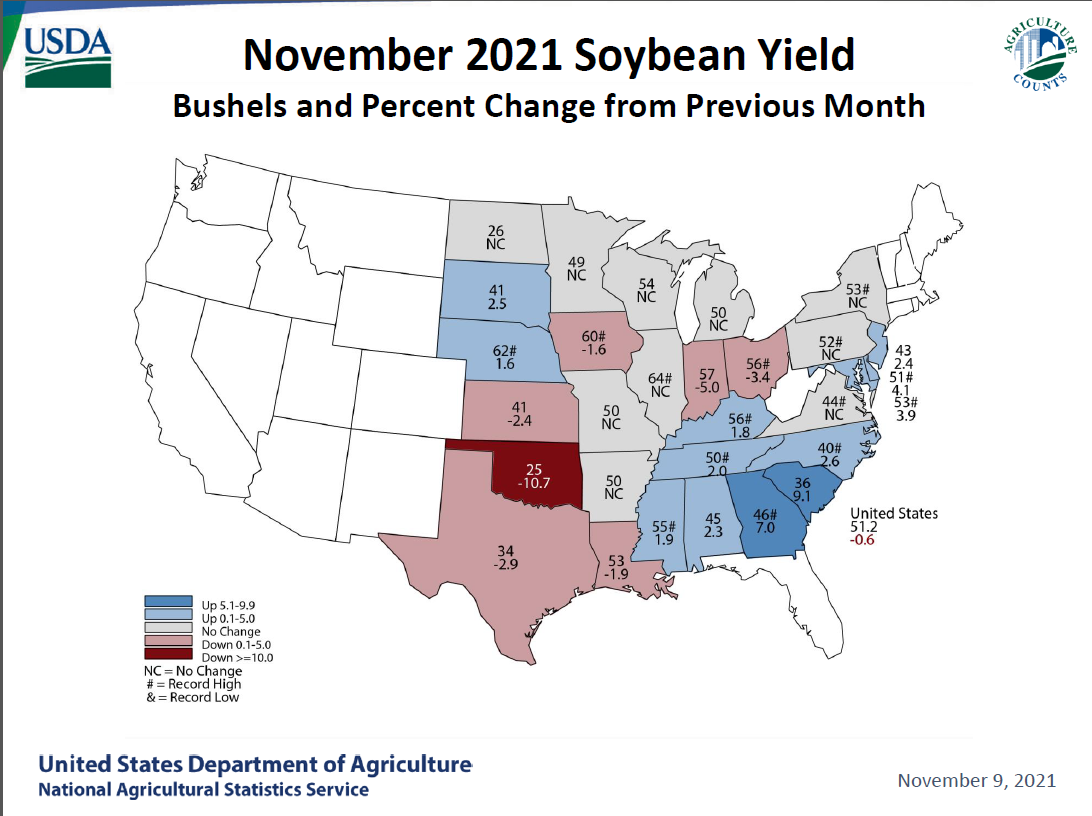
Reaction: Bullish out of the gate. We think traders oversold the market over the last week in anticipation for higher corn and soybean yields that likely failed to live up to expectations. The soybean yield of 51.2 was 0.7 bushels below trade expectations and corn yield 177.0 was only 0.1 bushel above an average trade guess. Looking at the changes in US soybean and corn demand, we don’t view this report this bullish. We need to see US export demand to improve for corn & wheat, and keep up with pace for soybeans, to get us back into the buying camp.
USDA NASS executive summary
https://www.nass.usda.gov/Newsroom/Executive_Briefings/index.php
USDA OCE Secretary’s Briefing
https://www.usda.gov/oce/commodity-markets/wasde/secretary-briefing
The US corn supply was taken up 43 million bushels with production standing at 15.062 billion, 12 million above trade expectations, and is 951 million bushels above 2020. USDA lowered its 2021-22 US corn carryout by only 7 million bushels to 1.493 billion, 13 million above trade expectations. US made a slight change to its 2020-21 corn for ethanol use, lowering it 4 million bushels to 5.025 billion. For 2021-22, USDA took corn for ethanol use up 50 million bushels, as expected, to 5.250 billion. They left the other demand categories unchanged. As a result, stocks were taken down 7 million bushels. World corn production was increased 6.4 million tons to 1.205 billion tons, and stocks increased 2.7 million to 304.4 million. USDA increased Argentina’s corn production by 1.5 million tons to 54.5 million (increase in corn area). EU corn was lifted 1.6 million tons to 67.9 million. Note 2020-21 world corn production was revised higher by 3.5 million tons (in part to upward revisions to Argentina (0.5) and other smaller producing countries.
US soybean production was lowered 23 million bushels from the previous month to 4.425 billion bushels and was 59 million below trade expectations. This was likely the bullish data point that allowed soybean futures to shoot up 45 to 50 cents out of the gate. Since then, prices have settled down. Note US soybean production is 209 million bushels above 2020. USDA increased its carryout for the US soybean carryout by 20 million bushels to 340 million but was 22 million below trade expectations. USDA made no changes to its 2020-21 US soybean balance sheet, as expected. For 2021-22, USDA lowered their export program by 40 million bushels, more than what we thought they would do, but justified as September exports were only 80 million bushels. They lowered seed use by 2 million bushels. With supply down 23 million, stocks were taken up 20. For the products, USDA made appropriate adjustments to accommodate for the NASS crush report for soybean meal and soybean oil ending stocks. 2021-22 meal and soybean oil demand was left unchanged. Meal stocks were left at 400,000 short tons and soybean oil was boosted 114 million pounds to 1.912 billion. US crush was left unchanged. We don’t see much in the way of bullish sentiment for the changes in the US soybean complex. World soybean production was reduced one million tons to 384 million and stocks were lowered 0.8 million to 103.8 million. Argentina soybean production was taken down 1.5 million tons to 49.5v million, at the expense to losing acreage to corn. Brazil exports were taken up 1 million tons to 94 million and China imports were lowered 1 million tons to 100 (more in line with China CASDE), which are not bullish changes by USDA.
There was no change to US all-wheat production. USDA increased the all-wheat carryout by 3 million bushels to 583 million, 2 million above an average trade guess. USDA lowered US imports by 10 million to 115 million and took food down 2 million. Exports were revised lower by 15 million bushels. As a result, we saw ending stocks revised higher by only 3 million. By class, USDA reduced HRW stocks by 12, increased HRS by 14, took SRW down 1 million, increased white by 5 and lowered durum by 3 million. Global wheat production was lowered 0.6 MMT to 775.3 million and stocks were taken down 1.4 million to 275.8 million. USDA did not make any changes to Canadian or Australian production, but they did lower the EU by 1 million and take Russia up 2 million.
Price projections revised below.
Price outlook:
December corn is seen in a $5.30-$5.80 range
March corn is seen in a $5.25-$6.00 range
Soybeans – January $11.60-$12.50 range, March $11.50-$13.50
Soybean meal – December $320-$340, March $310-$360
Soybean oil – December 57-60 cent range, March 56-65
December Chicago wheat is seen in a $7.30‐$8.25 range, March $7.25-$8.40
December KC wheat is seen in a $7.35‐$8.35, March $7.00-$8.50
December MN wheat is seen in a $9.70‐$11.50, March $9.00-$11.75
Terry Reilly
Senior Commodity Analyst – Grain and Oilseeds
Futures International
One Lincoln Center
18 W 140 Butterfield Rd.
Oakbrook Terrace, Il. 60181
W: 312.604.1366
ICE IM: treilly1
Skype: fi.treilly

Trading of futures, options, swaps and other derivatives is risky and is not suitable for all persons. All of these investment products are leveraged, and you can lose more than your initial deposit. Each investment product is offered only to and from jurisdictions where solicitation and sale are lawful, and in accordance with applicable laws and regulations in such jurisdiction. The information provided here should not be relied upon as a substitute for independent research before making your investment decisions. Futures International, LLC is merely providing this information for your general information and the information does not take into account any particular individual’s investment objectives, financial situation, or needs. All investors should obtain advice based on their unique situation before making any investment decision. The contents of this communication and any attachments are for informational purposes only and under no circumstances should they be construed as an offer to buy or sell, or a solicitation to buy or sell any future, option, swap or other derivative. The sources for the information and any opinions in this communication are believed to be reliable, but Futures International, LLC does not warrant or guarantee the accuracy of such information or opinions. Futures International, LLC and its principals and employees may take positions different from any positions described in this communication. Past results are not necessarily indicative of future results.