PDF Attached


Happy
New Year!


CBOT
markets are closed Monday.
https://www.cmegroup.com/tools-information/holiday-calendar.html 
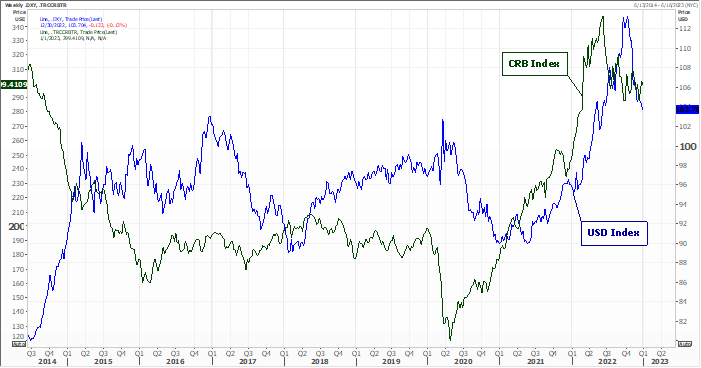


USD
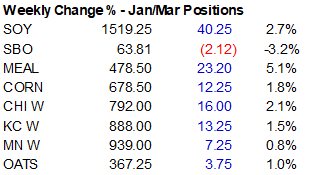
was lower, WTI higher and US equities lower. Soybeans and meal were higher on ongoing Argentina weather concerns and soybean oil lower from product spreading and heavier than expected deliveries. Soybean oil for US biofuel use was lower than expected for the
month of October. Bull spreading was a feature for soybean meal and soybeans. Corn settled lower on lack of fresh news. Wheat traded higher on spreading against corn and US crop concerns.


The
Bloomberg Agriculture Spot Index is up four consecutive years. Wheat, soybean oil and palm oil hit records in 2022 while corn and soybeans reached about a decade high. Bloomberg noted corn rose for a fifth year and soybeans are up a fourth year. Wheat was
little changed.


Weather

Map

Description automatically generated


World
Weather, INC.

MOST
IMPORTANT WEATHER FOR THE COMING WEEK

  • U.S.
    hard red winter wheat production areas will continue to be quite dry during the next two weeks, despite a couple of storm systems moving through the region.
    • Snow
      will impact a part of northeastern Colorado and western Nebraska Sunday into Monday and a few showers will occur in eastern Fringes of the production region, but the heart of wheat country will be left dry
    • A
      few spotty showers of snow and rain may occur during mid-week next week and near the Texas Panhandle, but moisture totals will not be significant
    • The
      balance of the two week weather outlook leaves the region dry
  • Nebraska,
    northwestern Kansas and areas northeast into Minnesota received some precipitation Thursday and early today.
    • Moisture
      totals were greatest in Nebraska with up to 0.27 inch resulting
  • Other
    precipitation in the United States Thursday was greatest in the Delta and  from western Washington through northern and into central California
    • Moisture
      totals in the Delta varied from 0.60 to 2.00 inches with the west side of the Mississippi River most impacted
    • Moisture
      totals in the Pacific Northwest into northern California varied from 0.30 to 1.50 inches with significant snow accumulations in the mountains
  • California
    and a part of the U.S. Pacific Northwest will receive additional bouts of snow and rain through the next full week before some drier weather evolves
    • Mountain
      snowpack will continue to improve through the coming week
  • U.S.
    eastern Midwest, Delta and southeastern States will receive frequent rain during the next week to ten days easing long term dryness
    • Recent
      precipitation has been below average for months in the central and eastern Midwest, although soil moisture has remained favorably rated due to seasonably cooler temperatures and lower evaporation conserving the moisture that has fallen
  • U.S.
    temperatures will be warmer than usual over the central and eastern parts of the nation later this week into next week with some cooler biased conditions evolving in the western states
  • West
    Texas will be dry biased for an extended period of time
  • Argentina’s
    rainfall outlook has not changed greatly overnight
    • Significant
      rain must fall to get planting completed and to improve crop emergence and establishment
    • Rain
      potentials are only good for Saturday into Monday at which time 0.15 to 0.85 inch of rain is expected with a “few” 1.00 to 2.00 inch totals
      • Most
        of the rain is not likely to have a lasting impact on crops or soil moisture even though most crop areas will get at least some moisture.
    • Net
      drying will resume next week and last through Jan. 12 even though a few more showers might pop up in parts of the production region
    • If
      rain stays limited through the first half of January acreage reductions will become permanent and emerged and established crops will begin dealing with waves of stress due to dry and warm weather until significant rain falls
    • If
      a generalized soaking rain comes along in these next two weeks the situation could end up much different with much of the planted acreage getting planted and crops having a renewed outlook, but such a rain event is not on the forecast charts today
    • Rainfall
      in Argentina should improve with the commencement of aggressive La Nina weakening in January, but that change may not occur fast enough to get all crops planted and well established.
  • Argentina
    weather Thursday was dry and warm with high temperatures in the lower to middle 90s Fahrenheit
  • Brazil
    weather has not changed in recent days. Both the past and forecast weather seems to be similar as each day comes and goes and the bottom line remains favorable for most of the nation’s crops
    • All
      crop areas will get rain with many getting it multiple times
    • Central
      and southern Rio Grande do Sul will experience the poorest distribution of rain and net drying will result leading to rising levels of crop stress
      • The
        region impacted with dryness, though, is mostly a rice and corn production region with some soybeans
    • Waves
      of heavier rainfall will impact center south Brazil often during the next two weeks and that will maintain wet field conditions
      • The
        wetter bias may have to back off a bit later in January and February to support soybean harvesting and Safrinha crop planting
    • All
      indicators suggest ongoing routinely occurring rainfall through the heart of summer with some potential for improved Rio Grande do Sul rainfall after La Nina has weakened
  • Brazil
    rainfall Thursday and early today was greatest from northeastern Sao Paulo and southernmost Minas Gerais into Goias where rainfall varied from 0.20 to 0.75 inch with local totals of 1.00 to 2.40 inches
    • Rain
      also fell in Mato Grosso with central and western areas wettest getting more than 1.00 inch
    • High
      temperatures were in the 80s and lower 90s Fahrenheit with a few 70s in east-central and southeastern production areas
  • North
    Africa rainfall has been limited recently no change is expected
    • Many
      areas from Morocco into Tunisia will require significant precipitation soon
    • Some
      increase in precipitation is expected in northeastern Algeria and coastal Tunisia late next week
  • South
    Africa weather will continue to be favorably mixed over the next two weeks supporting normal summer crop development
    • There
      may be some increasing need for precipitation in the far western and northeastern summer crop areas eventually
  • West-central
    Africa dryness will continue through the next ten days to two weeks
    • Dry
      conditions are normal at this time of year
    • No
      excessive heat is expected in this coming week, although warmer than usual conditions may begin to evolve a week from now and continue into January 10.
  • East-Central
    Africa rainfall is expected to be sporadic and light over the next week to ten days
    • Most
      coffee, cocoa, sugarcane, and a host of other crops should be developing relatively well and the lighter and less frequent rain should have little to no impact
  • Australia
    winter and summer crop areas are unlikely to get much precipitation during the coming week
    • The
      environment will be good for fieldwork, including late season harvest progress in southern winter crop areas
    • Rain
      is needed in interior east-central portions of the nation, although the situation is not a crisis
      • Unirrigated
        sorghum, cotton and other crops will need rain soon especially with temperatures trending hotter
      • Some
        increase in precipitation is expected in the east Jan. 7-13
  • Waves
    of heavy rain will return to the eastern Philippines this weekend and especially next week resulting in some additional flooding from time to time
    • Flooding
      already occurred in the past week from northern and eastern Mindanao into Samar
      • The
        same region may be impacted by the next round of heavy rainfall early to mid-week next week
  • Canada’s
    Prairies will be drying down over the coming week after widespread snow fell earlier this week
  • Europe
    and western Asia temperatures will be warmer biased over the next ten days to two weeks
    • Cooling
      is expected in north-central through northeastern Russia during the coming ten days, but mostly to the east of winter crop areas
  • Europe
    weather will be wet biased in the far west and north over the coming week to ten days maintaining wet field conditions and improving the spring runoff expectations
    • Most
      of the precipitation will occur as rain, but some mountain snow is likely as well
  • Western
    Russia, northern Ukraine, Belarus and the Baltic States will continue in a wet weather mode during the next ten days maintaining some concern over wet biased soil conditions in the spring in western Russia where some flooding may evolve
  • China
    weather over the coming week will continue relatively quiet biased with a little rain and mountain snow in the southwest including areas from Sichuan to Yunnan
    • Most
      other areas will receive limited amount of moisture and temperatures will be near to above normal
  • India
    weather will be rather quiet with limited amounts of moisture expected and seasonably to slightly warmer than usual temperatures
    • India’s
      winter crops will have need for precipitation soon to support improved pre-reproductive precipitation
  • Rain
    is expected in parts of the Middle East next week, although the resulting precipitation should be mostly light to locally moderate
    • Iran,
      Iraq, Saudi Arabia and Afghanistan will be wettest
  • Southeast
    Asia will continue to experience periodic rainfall and some periods of sunshine supporting most crops throughout the region
    • Mainland
      areas of Southeast Asia will experience the driest conditions and that is normal for this time of year
    • Heavy
      rain and local flooding will impact eastern parts of the Philippines and in some southern Indonesia locations
  • Today’s
    Southern Oscillation Index was +18.04 today and it will likely stay strongly positive over the next few days due to the presence of another tropical low pressure system in northern Australia near Darwin that will thwart the index anomalously high


Source:
World Weather INC


Bloomberg
Ag Calendar

Saturday,
Dec. 31:

  • Malaysia’s
    Dec. 1-31 palm oil export data by cargo surveyor AmSpec

Monday,
Jan. 2:

  • New
    Year’s holiday in several countries, including US, UK and Japan

Tuesday,
Jan. 3:

  • New
    Zealand global dairy trade auction
  • EU
    weekly grain, oilseed import and export data
  • US
    Purdue Agriculture Sentiment
  • USDA
    soybean crush, 3pm, USDA corn for ethanol use
  • HOLIDAY:
    Japan

Wednesday,
Jan. 4:

  • No
    major event scheduled

Thursday,
Jan. 5:

  • Census
    Trade Balance
  • EIA
    weekly US ethanol inventories, production
  • Port
    of Rouen data on French grain exports
  • Malaysia’s
    Jan. 1-5 palm oil exports

Friday,
Jan. 6:

  • FAO
    Food Price Index
  • Net-export
    sales for corn, soybeans, wheat, cotton, pork and beef, 8:30am
  • ICE
    Futures Europe weekly commitments of traders report
  • CFTC
    commitments of traders weekly report on positions for various US futures and options

Source:
Bloomberg and FI


Corn

·        
CBOT corn futures

traded
two-sided, ending lower on lack of direction and light news. Losses were limited from a higher trade in wheat and soybeans.

·        
Ukraine’s corn harvest is running at about 78 percent complete as of December 30, with 21.4 million tons collected from 3.3 million hectares. This is up from 20.2 million tons as of December 22. Ukraine grain exports are down
30 percent from this time year ago.

·        
China’s sow herd was up 0.2% in November from October to 43.88 million sows, 2.1% higher than a year ago.

·        
EIA reported October US ethanol production slightly above our working estimate. We left our corn for ethanol use unchanged at 5.250 billion bushels, 25 million below USDA.


Source:
Reuters and FI


Export
developments.

·        
None reported


Updated
12/27/22

March
corn $6.25-$7.25 range.
May
$6.00-$7.25


Soybeans

·        
CBOT soybeans and meal were higher on Argentina weather concerns and good export demand (soybeans and meal). Soybean oil was lower from product spreading and slow October soybean oil for US biofuel use.

·        
USDA reported 186,000 tons of soybeans sold to unknown destinations.

·        
Argentina producers planted 72% of their soybean crop, about 9 points below the year ago pace.

·        
Indonesia plans to reduce exports for palm oil from January 1. “Starting next year, exporters will be allowed to ship six times their domestic sales volume, smaller than the current ratio allowed of eight times, Indonesian Palm
Oil Association (GAPKI).” – Reuters

·        
Indonesia will enforce their mandatory 35% palm oil biodiesel blending program on Feb. 1, a month later than initially planned, from current 30%. The allocation is unchanged at 13.15 million kiloliters.

·        
The Russia export duty for sunflower oil in January will remain at zero percent, same as it was during Q4. Sunflower meal will increase to 1,826.90 rubles per ton, up from just 79.8 rubles in December.

·        
EIA reported soybean oil for US biofuel production well below our working estimate. At 906 million pounds during the month of October, it was down from 934 million pounds for September and up from 832 million pounds for October
2021. Note EPA didn’t recommend the lower-than-expected mandates until late November, so the October figure was a surprise.
https://www.epa.gov/renewable-fuel-standard-program/news-notices-and-announcements-renewable-fuel-standard

·        
We lowered our soybean oil for biofuel use to 11.800 billion pounds from 11.850 billion previously. USDA is at 11.600 billion pounds for 2022-23. Last year 10.348 billion pounds was used.


Source:
Reuters and FI


Export
Developments

·        
Under the 24-hour reporting system, USDA announced 186,000 tons of soybeans sold to unknown destinations.

·        
South Korea’s state-backed Agro-Fisheries & Food Trade Corp. seeks 25,000 tons of GMO-free food-quality soybeans, optional origin, on January 4 for arrival between December 2023 and June 2024.


Table

Description automatically generated


Updated
12/27/22

Soybeans
– January $14.60-$15.00, March $14.15-$15.25

Soybean
meal – January $440-$465, March $4.00-$500

Soybean
oil – January 65.00-69.00 range
,
March 55.00-70.00


Wheat

·        
After a slow start, US wheat futures rallied on US crop concerns and a lower USD. News was light. 

·        
Argentina’s BA Grains Exchange warned the Argentina wheat production estimate of 12.4 million tons could be lowered soon as they are seeing wheat yields coming in smaller than expected. At the beginning of the season, it was predicted
to reach 20.5 million tons. On Wednesday, about 91 percent of the wheat crop as harvested,

·        
March Paris milling wheat officially closed down 0.50 euro, or 0.2%, at 309.25 euros a ton ($330.93/ton). The nearby rolling contract rose 11 percent in 2022.

·        
SovEcon raised their Russian wheat export estimate for the 2022-23 crop year (July-June) by 200,000 tons to 44.1 million tons.

·        
Russian export taxes are set to increase for the sixth consecutive week (Jan 11-17) but we don’t see sales slowing. This week Egypt booked 200,000 tons of Russian wheat.


Source:
Reuters and FI


Export
Developments.

·        
None reported


Rice/Other

·        
Results awaited: South Korea’s state-backed Agro-Fisheries & Food Trade Corp. seeks 113,460 tons of rice on December 29 from the United States for arrival in South Korea in 2023 between Feb. 1 and June 30.


Updated
12/27/22

Chicago
– March $7.25 to $8.35

KC
– March 8.25-$9.50

MN
– March $8.75 to $
9.75


USDA Export sales

Grains were good for USDA export sales. Soybeans
are slowly fading but within expectations. Product sales were little lower than wanted for soybean meal and again poor for soybean oil.  No major surprises. Mexico dominated grain sales while China was the largest buyer for soybeans.


Export Sales Highlights

This
summary is based on reports from exporters for the period December 16-22, 2022.

Wheat: 
Net sales of 478,100 metric tons (MT) for 2022/2023 were primarily for Japan (139,000 MT), Mexico (101,900 MT, including 30,000 MT switched from unknown destinations and decreases of 11,600 MT), unknown destinations (87,000 MT), Taiwan (56,000 MT), and Nigeria
(24,000 MT). Total net sales of 33,000 MT for 2023/2024 were for Mexico. Exports of 337,100 MT were primarily to Mexico (92,800 MT), Thailand (54,100 MT), Iraq (52,500 MT), Italy (40,800 MT), and Japan (35,500 MT).  

Corn: 
Net sales of 781,600 MT for 2022/2023 primarily for Mexico (463,600 MT, including decreases of 37,200 MT), unknown destinations (102,600 MT), Colombia (68,500 MT, including decreases of 33,000 MT), Japan (65,600 MT, including 52,400 MT switched from unknown
destinations), and Honduras (28,100 MT, including decreases of 32,700 MT), were offset by reductions for China (9,300 MT). Total net sales of 170,000 MT for 2023/2024 were for Japan. Exports of 1,012,500 MT were primarily to Mexico (441,600 MT), China (278,400
MT), Japan (124,200 MT), Colombia (45,400 MT), and Guatemala (33,700 MT). 

Barley: 
No net sales or exports were reported for the week.

Sorghum: 
Net sales reductions of 100 MT for 2022/2023 resulting in increases primarily for Eritrea (33,000 MT switched from Sudan), were more than offset by reductions for Sudan (30,000 MT) and unknown destinations (10,700 MT). Exports of 42,200 MT were primarily to
Eritrea (33,000 MT) and Japan (7,600 MT).  

Rice:
 Net
sales of 98,700 MT for 2022/2023 were primarily for Iraq (80,000 MT), Haiti (8,100 MT), Canada (5,500 MT), Saudi Arabia (2,000 MT), and Guatemala (1,900 MT, including decreases of 200 MT). Exports of 20,800 MT were primarily to Haiti (15,200 MT), Mexico (2,800
MT), Canada (1,000 MT), Taiwan (1,000 MT), and Saudi Arabia (100 MT). 

Soybeans: 
Net sales of 705,800 MT for 2022/2023 primarily for China (521,200 MT, including 334,000 MT switched from unknown destinations and decreases of 137,400 MT), the Netherlands (142,600 MT, including 137,000 MT switched from unknown destinations and decreases
of 1,700 MT), Japan (96,800 MT, including 98,300 MT switched from unknown destinations and decreases of 2,700 MT), Thailand (77,800 MT), and Saudi Arabia (66,700 MT, including 70,000 MT switched from unknown destinations and decreases of 3,300 MT), were offset
by reductions primarily for unknown destinations (278,300 MT). Exports of 1,848,500 MT were primarily to China (1,077,800 MT), the Netherlands (142,600 MT), Japan (131,300 MT), Mexico (77,600 MT), and Thailand (74,100 MT).

Optional
Origin Sales:
 
For 2022/2023, the current outstanding balance of 300 MT, all South Korea.

Export
for Own Account:
 For
2022/2023, the current exports for own account outstanding balance is 1,500 MT, all Canada.

Export
Adjustments: 
Accumulated
exports of soybeans to China were adjusted down 71,179 MT for week ending December 15th. The correct destination for this shipment is Thailand.

Soybean
Cake and Meal:
 
Net sales of 264,300 MT for 2022/2023 primarily for Colombia (117,200 MT, including decreases of 9,500 MT), Morocco (43,000 MT), Ireland (30,000 MT), Mexico (14,100 MT), and Honduras (9,600 MT, including decreases of 1,000 MT), were offset by reductions for
Ecuador (7,000 MT) and the Philippines (1,100 MT). Exports of 212,900 MT were primarily to Denmark (49,500 MT), Colombia (39,200 MT), Mexico (34,600 MT), Morocco (33,000 MT), and the Philippines (23,200 MT).  

Soybean
Oil:
 
Net sales of 5,400 MT for 2022/2023 were reported for Venezuela (5,200 MT) and Canada (200 MT). Exports of 5,500 MT were to Venezuela (5,200 MT) and Canada (300 MT). 

Cotton: 
Net
sales of 82,300 RB for 2022/2023 were primarily for South Korea (17,800 RB), China (15,400 RB, including 8,800 RB switched from Vietnam and decreases of 400 RB), Turkey (15,200 RB, including decreases of 2,400 RB), Pakistan (11,800 RB, including decreases
of 1,700 RB), and Vietnam (4,100 RB, including 1,300 RB switched from South Korea and 200 RB switched from Japan). Total net sales of 3,500 RB for 2023/2024 were for Mexico. Exports of 140,300 RB were primarily to Pakistan (40,400 RB), China (30,200 RB), Vietnam
(11,900 RB), Turkey (10,800 RB), and Malaysia (8,700 RB). Net sales of Pima totaling 5,600 RB were primarily for Vietnam (3,700 RB) and India (1,600 RB). Exports of 4,300 RB were to China (2,600 RB) and India (1,700 RB). 

Optional
Origin Sales:
 For
2022/2023, the current outstanding balance of 9,300 RB, all Malaysia.

Export
for Own Account:
 For
2022/2023, new exports for own account totaling 600 RB were to China. Exports for own account totaling 6,500 RB to Pakistan (5,400 RB) and China (1,100 RB) were applied to new or outstanding sales. The current exports for own account outstanding balance of
119,600 RB are for China (87,500 RB), Vietnam (22,700 RB), Pakistan (7,500 RB), India (1,500 RB), and Indonesia (400 RB).

Hides
and Skins:
 
Net sales of 91,600 pieces for 2022 reported for China (55,200 whole cattle hides, including decreases of 27,300 pieces), South Korea (17,100 whole cattle hides, including decreases of 7,900 pieces), Mexico (16,300 whole cattle hides, including decreases of
400 pieces),  and Indonesia (6,900 whole cattle hides, including decreases of 1,800 pieces), were offset by reductions for Thailand (1,600 pieces), Egypt (1,400 pieces), Brazil (500 pieces), and Taiwan (300 pieces). Net sales of 163,000 pieces for 2023 were
primarily for China (91,600 whole cattle hides), South Korea (48,600 whole cattle hides), Mexico (8,400 whole cattle hides), Thailand (3,700 whole cattle hides), and Taiwan (3,600 whole cattle hides). In addition, net sales of 10,100 kip skins were reported
for Canada (8,700 kip skins) and Italy (1,400 kip skins). Exports of 315,300 whole cattle hides exports were primarily to China (231,400 pieces), Mexico (25,000 pieces), South Korea (23,700 pieces), Thailand (20,600 pieces), and Brazil (10,500 pieces).

Net
sales of 9,200 wet blues for 2022 primarily for Vietnam (3,800 unsplit, including decreases of 2,400 unsplit), Thailand (3,000 unsplit), the Dominican Republic (2,400 unsplit), Brazil (2,100 grain splits, including decreases of 100 grain splits), and Italy
(1,100 unsplit, including decreases of 2,200 unsplit), were offset by reductions for China (3,800 unsplit).
Net sales of 50,900 wet blues for 2023 primarily for Brazil (19,400 grain splits), Vietnam (9,900 unsplit), China (7,400 unsplit), Hong Kong (5,000 unsplit), and the Dominican Republic (4,800 unsplit), were
offset by reductions for Thailand (2,600 unsplit) and Italy (1,300 unsplit). Exports of 69,800 wet blues were primarily to Italy (27,600 unsplit and 1,900 grain splits), Thailand (17,500 unsplit), China (7,300 unsplit), Brazil (4,200 grain splits), and
Hong Kong (4,000 unsplit). Total net sales reductions of 3,100 splits were for Vietnam. Total net sales of 327,000 splits for 2023 were for Hong Kong. Exports of 164,700 splits were to China (84,700 pounds) and Vietnam (80,000 pounds).

Beef: 
Net sales of 2,300 MT for 2022 reported for Japan (1,800 MT, including decreases of 200 MT), South Korea (1,700 MT, including decreases of 400 MT), Mexico (200 MT, including decreases of 100 MT), and the Netherlands (100 MT), were offset
by reductions primarily for China (700 MT) and Vietnam (400 MT). Net sales of 7,200 MT for 2023 primarily for Japan (3,300 MT), China (1,300 MT), Taiwan (900 MT), Canada (500 MT), and Vietnam (400 MT)
, were offset by reductions for South Korea (500 MT).
Exports of 16,800 MT were primarily to South Korea (4,400 MT), Japan (4,400 MT), China (2,200 MT), Mexico (1,800 MT), and Taiwan (1,300 MT). 

Pork: 
Net sales of 15,100 MT for 2022 primarily for Mexico (9,100 MT, including decreases of 900 MT), Canada (1,600 MT, including decreases of 400 MT), China (1,600 MT, including decreases of 100 MT), Japan (1,300 MT, including decreases of 1,500 MT), and the Dominican
Republic (1,100 MT, including decreases of 100 MT), were offset by reductions primarily for South Korea (300 MT).
Net sales of 30,500 MT for 2023 were primarily for Mexico (11,900 MT), China (10,000 MT), Canada (1,700 MT), Japan (1,700 MT), and Colombia (1,600 MT).
Exports of 32,400 MT were primarily to Mexico (16,200 MT), China (4,600 MT), Japan (2,800 MT), South Korea (2,500 MT), and Canada (1,600 MT).


U.S.
EXPORT SALES FOR WEEK ENDING  12/22/2022


CURRENT
MARKETING YEAR

NEXT
MARKETING YEAR

COMMODITY

NET
SALES

OUTSTANDING
SALES

WEEKLY
EXPORTS

ACCUMULATED
EXPORTS

NET
SALES

OUTSTANDING
SALES

CURRENT
YEAR

YEAR

AGO

CURRENT
YEAR

YEAR

AGO


THOUSAND
METRIC TONS

WHEAT


HRW    

175.1

1,001.6

2,106.4

119.8

3,128.1

4,172.6

33.0

39.3

  
SRW    

74.3

648.6

738.5

21.6

1,735.2

1,572.9

0.0

13.6

  
HRS     

123.9

1,357.9

1,270.4

122.3

3,152.5

2,968.8

0.0

10.8

  
WHITE   

80.4

1,217.4

845.4

52.9

2,415.3

2,026.2

0.0

0.3

  
DURUM  

24.4

116.7

36.2

20.4

149.5

97.2

0.0

0.0

    
TOTAL

478.1

4,342.1

4,996.8

337.1

10,580.6

10,837.7

33.0

64.0

BARLEY

0.0

5.2

19.0

0.0

6.5

11.5

0.0

0.0

CORN

781.6

12,186.1

27,073.1

1,012.5

9,235.1

13,667.7

170.0

1,139.0

SORGHUM

-0.1

142.3

3,746.5

42.2

218.7

1,538.7

0.0

0.0

SOYBEANS

705.8

16,402.0

12,448.4

1,848.5

26,705.7

28,870.8

0.0

180.0

SOY
MEAL

264.3

3,642.3

3,181.3

212.9

2,478.3

2,913.6

0.0

18.3

SOY
OIL

5.4

18.3

287.5

5.5

18.4

150.3

0.0

0.6

RICE


L G RGH

1.9

168.6

166.7

1.3

146.1

580.7

0.0

0.0

  
M S RGH

0.0

13.7

6.3

0.3

13.2

2.9

0.0

0.0

  
L G BRN

1.0

8.5

4.0

0.1

7.3

26.8

0.0

0.0

  
M&S BR

0.1

8.2

68.4

1.0

6.6

15.2

0.0

0.0

  
L G MLD

93.8

134.5

94.4

17.1

279.1

344.5

0.0

0.0

  
M S MLD

2.1

133.4

104.6

0.9

96.7

176.4

0.0

0.0

    
TOTAL

98.7

466.9

444.3

20.8

549.0

1,146.6

0.0

0.0

COTTON


THOUSAND
RUNNING BALES      

   UPLAND

82.3

4,972.9

7,518.2

140.3

3,773.8

2,931.9

3.5

1,203.1

  
PIMA

5.6

69.3

234.9

4.3

51.4

137.6

0.0

1.1


Terry Reilly

Senior Commodity Analyst – Grain and Oilseeds

Futures International
One Lincoln Center
18 W 140 Butterfield Rd.

Oakbrook Terrace, Il. 60181

W: 312.604.1366

treilly@futures-int.com

ICE IM: 
treilly1

Skype: fi.treilly


Description: Description: Description: Description: FImail


Trading of futures, options, swaps and other derivatives is risky and is not suitable for all persons.  All of these investment products are leveraged, and you can lose more than your initial deposit.  Each investment product is offered
only to and from jurisdictions where solicitation and sale are lawful, and in accordance with applicable laws and regulations in such jurisdiction.  The information provided here should not be relied upon as a substitute for independent research before making
your investment decisions.  Futures International, LLC is merely providing this information for your general information and the information does not take into account any particular individual’s investment objectives, financial situation, or needs.  All investors
should obtain advice based on their unique situation before making any investment decision.  The contents of this communication and any attachments are for informational purposes only and under no circumstances should they be construed as an offer to buy or
sell, or a solicitation to buy or sell any future, option, swap or other derivative.  The sources for the information and any opinions in this communication are believed to be reliable, but Futures International, LLC does not warrant or guarantee the accuracy
of such information or opinions.  Futures International, LLC and its principals and employees may take positions different from any positions described in this communication.  Past results are not necessarily indicative of future results.