PDF Attached
Due
to the federal holiday on December 24 and December 25, the Commitments of Traders (COT) market report will be released on Monday, December 28, 2020.
![]()
US
agriculture markets were higher on ongoing Argentina strike problems and poor weather forecast. Fund buying supported grains. Option trading was active.
MOST
IMPORTANT WEATHER OF THE DAY
- Argentina’s
outlook trended a little wetter today – at least on the various GFS model runs. The European model run continued with traditional La Nina tendencies in South America which entail abundant precipitation from center west through center south Brazil, net drying
in the far south and some sporadic rain in the northeast of Brazil while eastern Argentina, Uruguay and southern Paraguay experience some net drying - The
European model solution is most favored - Argentina
will be dry and very warm through Friday and into Saturday - Isolated
to scattered showers and thunderstorms will develop in the west and northern parts of the nation late this weekend through next week with some of the rain expanding to the east - Eastern
Buenos Aires, Entre Rios, Uruguay and southeastern Santa Fe are not likely to get much precipitation and net drying should prevail despite some showers
- Higher
relative humidity and cloud cover during the weekend and next week will help hold back temperatures and evaporation until a greater rain event arrives which may occur in early January - Brazil
rainfall was greatest from Mato Grosso do Minas Gerais and northern Sao Paulo Tuesday - Rainfall
reached 4.30 inches in southwestern Minas Gerais and 2.50 inches in east-central Minas Gerais while up to 3.50 inches occurred in north-central parts of Mato Grosso.
- Temperatures
were seasonable - Brazil
outlook is similar to that of Tuesday favoring rain in center west and center south crop areas during the next two weeks while far southern Brazil gets rain more erratically. Far northeastern Brazil will also see sporadic rainfall for a while - Australia’s
summer cotton and sorghum production areas will receive additional rain late next week and especially in the first week of January while net drying occurs until then
- Recent
rain improved dryland field and crop conditions, but much more moisture was needed to ensure crop improvements - Irrigated
crops are rated favorably - South
Africa received some much needed rainfall in the west Monday and central areas Tuesday helping to ease long term dryness in some areas - Additional
rain is needed, but not likely to occur in some areas for a while - Fieldwork
will advance swiftly in the drier biased weather - Morocco
will remain dry through the weekend and showers expected next week will be brief and light - Some
areas in southwestern Morocco wheat and barley production areas have been dealing with drought for two years and this is the beginning of a third year - Other
areas in North Africa wheat and barley production areas have more favorable soil moisture and will continue to experience some timely rainfall - However,
rain is needed in northwestern Algeria and it may not come significantly for a while - India
will not receive much rain in the coming week, but it may get some needed rain in central and interior northern crop areas in the first days of January - The
precipitation event is too far out in time to have high confidence, but with La Nina conditions prevailing and a strongly positive Southern Oscillation the odds favor significant rain for some of these areas this winter - The
precipitation would help winter crop production potentials rise - China
weather will continue quiet over the next couple of weeks with only light snow occasionally in the far northeast and a mix of rain and winter precipitation types in the Yangtze River Basin and interior far south - Russia
and Ukraine will experience periodic snow and rain through the next two weeks - Resulting
precipitation will be near to above average except in a few Russian Southern region locations where amounts will remain lighter than usual - The
moisture will be good for spring crop development with some of the snow to protect crops from any harsh weather that evolves - However,
temperatures will be warmer than usual in western Russia, Belarus, the Baltic States, Ukraine and in a few areas in Russia’s Southern region - Temperatures
will be a little cooler bias farther east, but no threatening cold is expected in any winter crop region - Europe
will experience waves of rain and a little mountain snowfall during the coming week to ten days - Abundant
rain is expected in parts of central and northwestern Europe and some locations will receive multiple inches of rain - The
moisture abundance will translate into wetter field conditions and the potential for areas of standing water may rise - Flooding
in northwestern France and parts of the U.K. is most likely - Some
strong wind speeds are expected as well with port loading delays possible at times - U.S.
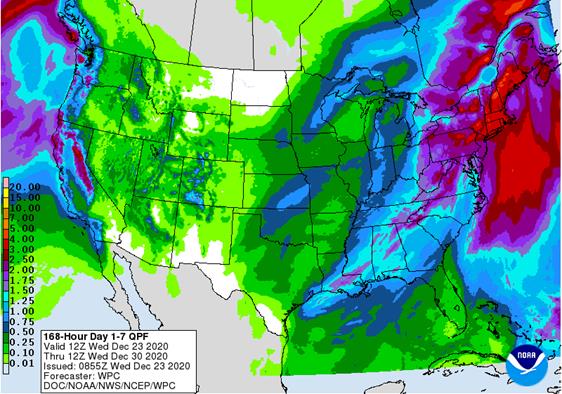
weather over the coming ten days will be more active than it has been - Frequent
weather systems will impact areas east of the Mississippi River; including the eastern Midwest, Delta and Atlantic Coast States - Moisture
totals will be greater than usual in the northeastern states - Most
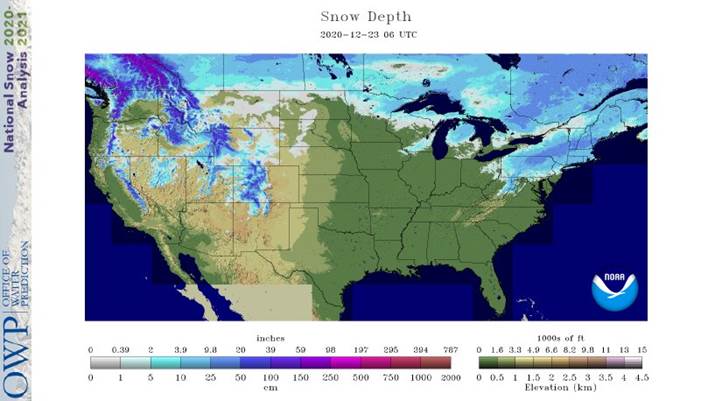
of the hard red winter wheat production areas will be left dry or mostly dry during this week and probably in the second week of the outlook as well, although a snow and rain event is possible during mid-week next week - Next
week’s storm should favor the north and eastern parts of the region leaving limited moisture for the west-central and especially the southwestern Plains - A
mini blizzard is under way today in the northern Plains and upper Midwest with similar conditions in southern Canada’s Prairies Tuesday and early this morning - The
storm will abate by Thursday morning - Wind
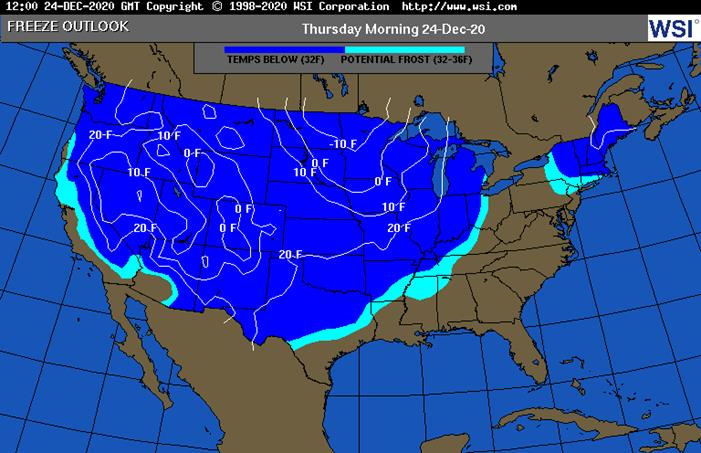
speeds of 30-50 mph and considerable blowing and drifting of snow will be stressful to livestock - Temperatures
in the coming week will be near to above average in the Plains and northeastern states and near to below average in the southeastern and middle Atlantic coast states; however, a short term bout of colder weather will surge from the northern Plains to the southeastern
states during mid- to late-week this week - Next
week temperatures will trend cooler in the western and north-central states
- Florida
citrus areas will be cold late this week with some low temperatures in the 30s and a few upper 20s Fahrenheit expected Friday and especially Saturday
- Crop
damage is not likely, but a close watch on the situation is warranted because anticipated temperatures could turn slightly colder as time moves along
- U.S.
northern Plains - Blizzard
conditions evolved overnight and will continue for a while in the southeast today wind speeds of 30-50 mph will occur with significant snow and blowing snow in Minnesota and eastern South Dakota - Snow
accumulations will vary from 3 to 8 inches with a few greater amounts in eastern Minnesota - U.S.
west-central and southwestern Plains will fail to get much “meaningful” moisture in the next ten days, although a little snow and rain is expected briefly during mid-week next week - Far
southwestern U.S. crop areas will remain drier biased over the next two weeks - U.S.
Delta and southeastern states will remain plenty moist over the next two weeks especially in the southeastern states - Southern
Canada’s Prairies will be trending drier over the balance of this week and into next week following this week’s snow storm - The
recent boost in snow cover will eventually improve soil moisture for crop use in the spring. - The
area impacted needed the precipitation and snow cover had been absent leaving winter crops vulnerable to damaging cold.
- Blizzard
conditions will end today in southern Manitoba - Temperatures
will be near to above average this week and next week - Indonesia
and Malaysia rainfall recently has become a little erratic and a boost in precipitation will eventually be needed - No
area is dry enough to pose a threat to short rooted crops, but greater volumes of rain would be welcome - The
pattern of erratic rainfall that is a little lighter than usual may prevail through the end of this month, but conditions will improve in early January - Southern
Vietnam, Thailand and Cambodia will receive some additional scattered showers and thunderstorms over the coming week
- Frequent
precipitation in recent weeks has kept the region moist and delayed fieldwork - No
serious crop quality changes have occurred, but the wetter bias will continue for several more days - Winter
crops benefitted from the expected moisture - Philippines
weather trended drier again Tuesday after excessive rain fell during the past week - Some
damage to low lying crops was suspected with rainfall of more than 20.00 inches in a single week for some areas - Another
bout of significant rain will evolve late this week and through early next week resulting in additional heavy rain - A
new tropical cyclone may evolve west of Palawan, Philippines next week before passing south of Vietnam later in that same week - This
system could bring more rain to southern Vietnam - The
storm looks weaker today than that of Tuesday’s outlook - Southern
Oscillation Index was at +15.16 today and it will remain strongly positive for a while even though some weakening is possible later in the week - World
Weather, Inc. believes the index is near its peak and weakening in the next few weeks will signal the beginning of a weakening trend in La Nina that will be most significant in February and March - Mexico
precipitation will be quite limited over the coming week which is not unusual for this time of year - Showers
will be mostly limited to the far south - Portions
of Central America will continue to receive erratic rainfall over the next couple of weeks, but the intensity and frequency will be low enough to support some farming activity - Costa
Rica and Caribbean coastal areas of both Nicaragua and Honduras will be wettest this week
·
West-central Africa weather is becoming more normal for this time of year with a few coastal showers
- Recent
rainfall has been greater than usual especially in Ivory Coast, Ghana, Senegal, southern Benin and coastal Nigeria
·
East-central Africa rain will be erratic and light in Ethiopia, Kenya and Uganda while rainfall will be greatest over Tanzania this week
·
New Zealand weather this week will trend greater than last week with some well-timed moisture across the nation
- Temperatures
will be below average
Source:
World Weather Inc. and FI
Wednesday,
Dec. 23:
- China
customs publishes data on imports of corn, wheat, sugar and cotton - USDA
weekly crop net-export sales for corn, soybeans, wheat, cotton, pork, beef, 8:30am - EIA
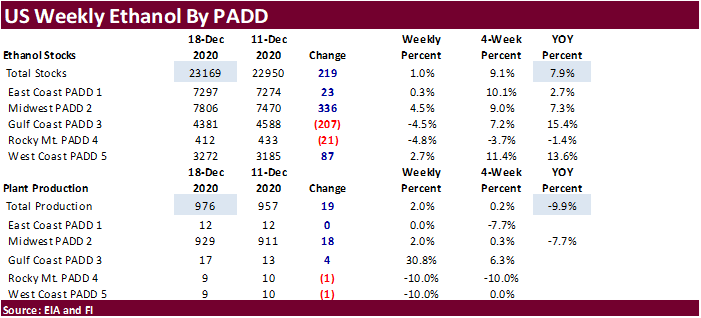
U.S. weekly ethanol inventories, production, 10:30am - USDA
hogs and pigs inventory, red meat production, 3pm
Thursday,
Dec. 24:
- Port
of Rouen data on French grain exports
Friday,
Dec. 25:
- Christmas
Day - NOTE:
Commitments of Traders reports for both ICE Futures Europe and CFTC will be delayed to Monday, Dec. 28 - China
customs publishes country-wise soybean and pork import data
Source:
Bloomberg and FI
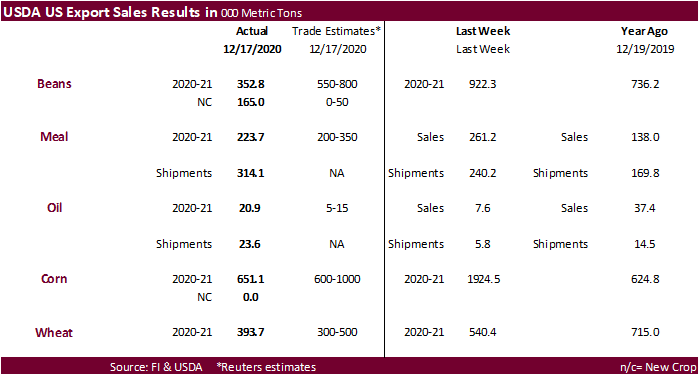
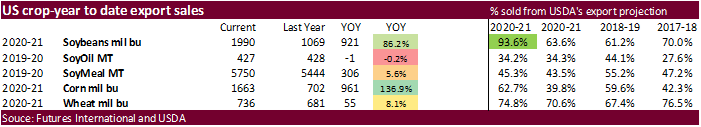
USDA
Export Sales
China
was very quiet in buying US agriculture goods for the week ending December 17.
·
US soybean export sales were reported at a marketing year low 352,800 tons. It included China but a chink of it was switched from unknown. (526,400 MT, including 396,000 MT switched from unknown destinations and decreases of
6,900 MT)
·
Soybean oil sales were 20,900 tons and meal at 223,700 tons. Soybean meal shipments were a good 314,100 tons and 23,600 tons of soybean oil were shipped.
·
US corn export sales were 651,100 tons.
·
Pork sales were 16,300 tons.
·
US all-wheat export sales were 393,700 tons and new-crop 24,000 tons.
US
Initial Jobless Claims: 803K (est 885K, prev 885K)
US
Continuing Claims: 5.337Mln (est 5.558Mln, prev 5.508Mln)
US
Core PCE Price Index (M/M) Nov: 0.0% (est 0.1%, prev 0.0%)
US
Core PCE Price Index (Y/Y) Nov: -0.4% (est 1.5%, prev 1.4%)
US
Consumption Adjusted (M/M) Nov: -0.4% (est -0.2%, prevR 0.3%)
US
Personal Income (M/M) Nov: -1.1% (est -0.3%, prevR -0.6%)
US
Consumption Adjusted (M/M) Nov: -0.4% (prevR 0.3 %)
US
University Of Michigan Sentiment Dec F: 80.7 (est 81.1; prev 81.4)
–
Current Conditions Dec F: 90.0 (prev 91.8)
–
Expectations Dec F: 74.6 (prev 74.7)
–
1 Year Inflation Expectations Dec F: 2.5% (prev 2.3%)
–
5-10 Year Inflation Expectations Dec F: 2.5% (prev 2.5%)
US
New Home Sales Change Nov: 841k (est 995K; prev 999K)
–
New Home Sales (M/M) Nov: -11.0% (est -0.5%; prev -0.3%)
Corn.
-
March
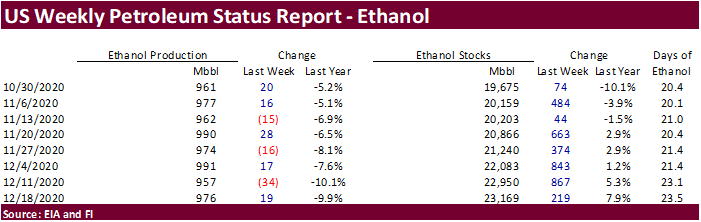
corn hit a new contract high again. Prices were higher for the ninth consecutive session, despite marketing year low in weekly US corn export sales. Higher soybeans and dry weather across Argentina supported corn. US ethanol production came in higher than
expected but stocks continues to swell. Funds bought an estimated net 20,000 corn contracts.
-
US
markets could see a turbulent end to the year. US President Trump threatened not to sign the COVID-19 relief bill as it included not high enough payments to Americans and included too much money allocated to foreign countries and unneeded domestic programs.
-
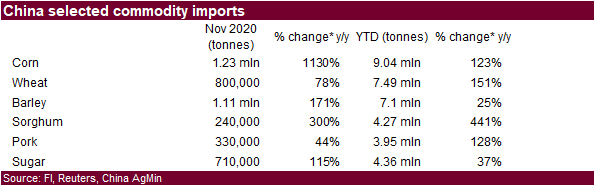
China
corn imports through November hit 9 million tons (Jan-Nov) after importing 1.23 million tons last month.
-
China
imported 330,000 tons of pork in November, up 39.4% from a year earlier. Jan-Nov 2020 imports total 3.95 million tons, up 115% on the same period a year earlier. Beef imports in November were down 9.9% year on year to 170,000 tons.
-
Anec
sees December Brazil corn exports at 4.423 million tons. -
India
bought 40,000 tons of US ethanol for Jan shipment at $555-$565/ton Mumbai.
-
The
USDA Broiler Report showed eggs set in the United States down 1 percent and chicks placed down slightly from a year ago. Cumulative placements from the week ending January 4, 2020 through December 19, 2020 for the United States were 9.42 billion. Cumulative
placements were down 1 percent from the same period a year earlier. -
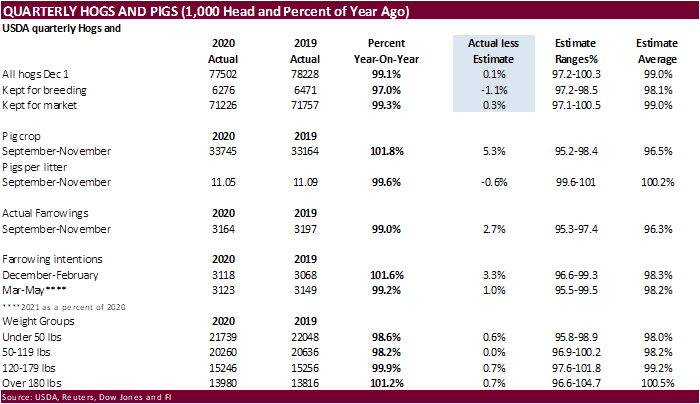
The
hogs and pigs report showed December 1 inventories near expectations.
Corn
Export Developments
-
Qatar
seeks 100,000 tons of bulk barley on January 12.
- Qatar
seeks 640,000 cartons of corn oil on January 12.
Updated
12/21/20
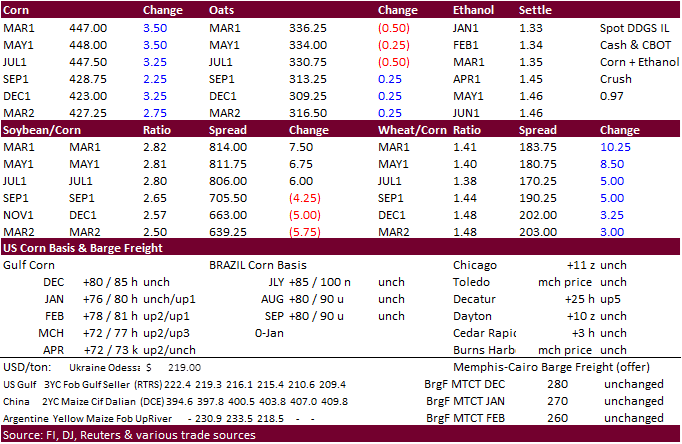
March
corn is seen
trading in a $4.25 and $4.55 range.