PDF Attached
WASHINGTON,
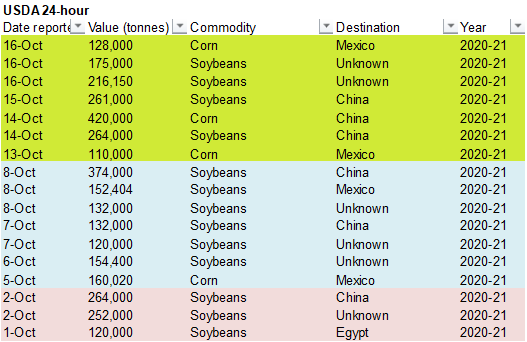
October 16, 2020—Private exporters reported to the U.S. Department of Agriculture the following activity:
-
Export
sales of 128,000 metric tons of corn for delivery to Mexico during the 2020/2021 marketing year;
-
Export
sales of 175,000 metric tons of soybeans for delivery to unknown destinations during the 2020/2021 marketing year; and -
Export
sales of 216,150 metric tons of soybeans received during the reporting period for delivery to unknown destinations during the 2020/2021 marketing year.
We
look for no changes in the US corn and soybean crop ratings.
Full
crop progress estimates will be out Monday morning as we access weekend weather.
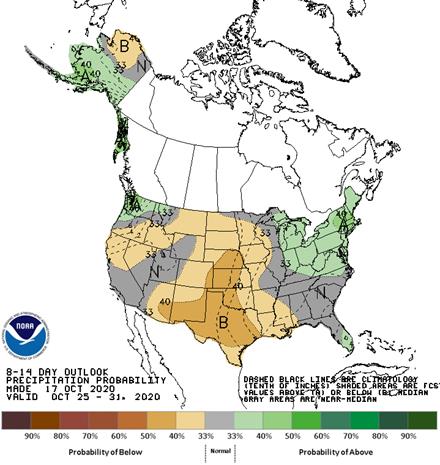
United
States
-
Today’s
outlook is wetter in the Midwest which may slow some fieldwork over the next week
-
Rain
is advertised to fall frequently Sunday through Friday of next week across the Midwest resulting in a much slower harvest pace especially in the lower and eastern Midwest -
The
moisture will ease dryness in the lower Midwest and improve winter crop establishment potentials -
No
change was noted in the dry areas of the west-central or southwestern U.S. Plains -
Waves
of snow and rain move through the northern Plains in the coming week improving topsoil moisture for some winter crops especially in Montana, but slowing harvest progress in a few areas as well -
Southeast
U.S. precipitation stays limited for much of the coming week to ten days benefiting fieldwork of all kinds -
U.S.
Delta gets some periodic rainfall that might slow farming activity a little -
Temperatures
will be colder than usual in the north-central U.S. and Canada’s Prairies with some cooling creeping into the Midwest as well over time
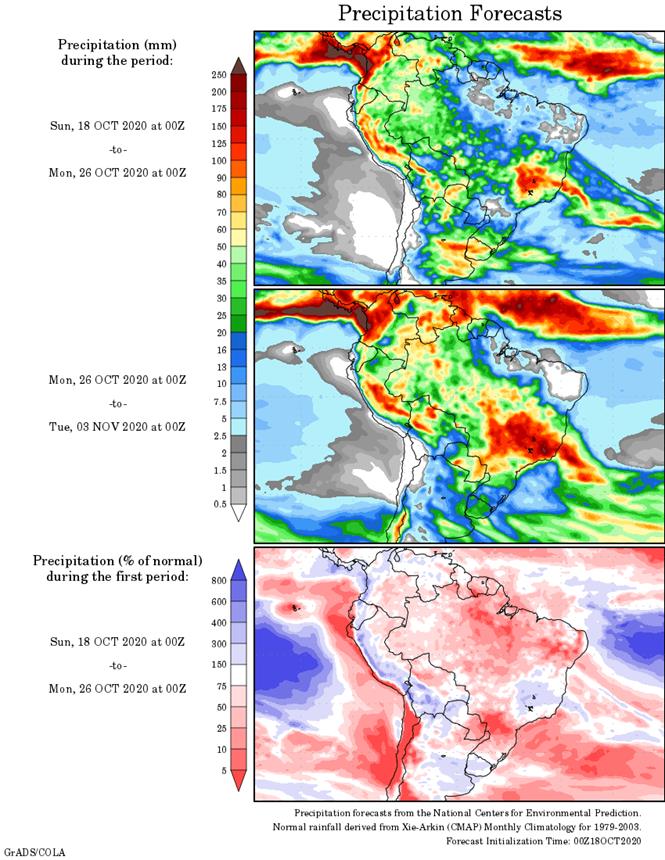
South
America
-
No
serious changes to the general theme were noted overnight -
Argentina
will get some needed rain early next week with a little follow up rain late next week and into the following weekend -
One
more round of rain occurs in Argentina, according to the GFS model run, October 26-27 followed by several days of drying -
Brazil
rainfall will be limited in center west crops areas, especially Mato Grosso, through the coming week and then will begin receiving more routinely occurring rainfall supporting planting and establishment of soybeans and other crops in the last week of this
month -
Brazil
rain will fall more routinely in some center south crop areas over the next two weeks
RUSSIA’S
SOUTHERN REGION/BLACK SEA REGION
-
Today’s
outlook for eastern Ukraine, Russia’s Southern Region and Kazakhstan has not changed for the coming ten days -
Some
showers are expected, but only a few locations will get enough moisture to support better winter crop establishment -
Greater
rain will still be needed to establish this year’s crops prior to dormancy
CHINA
-
No
significant changes were noted overnight -
A
general improving trend for the nation is expected over the next two weeks with less frequent and less significant rain expected
INDIA
-
Not
much changed overnight -
Central
India will be bothered by rain this weekend and early next week and then drier weather is expected -
Rain
will continue in southern and eastern parts of the nation for the coming week to ten days with some decreasing rainfall in the last days of this month
AUSTRALIA
-
The
overnight forecast model runs reduced some of the rain suggested for Queensland and northeastern New South Wales next week and into the following weekend -
This
change was needed -
No
other changes of significance were noted for the nation -
Wheat
areas of Western Australia may get a few brief showers in the far south, but net drying is expected to continue in general
Source:
World Weather Inc.
- USDA
weekly crop net-export sales for corn, soybeans, wheat, cotton, pork, beef, 8:30am - ICE
Futures Europe weekly commitments of traders report, 1:30pm (6:30pm London) - CFTC
commitments of traders weekly report on positions for various U.S. futures and options, 3:30pm - FranceAgriMer
weekly update on crop conditions - Asia
3Q cocoa grinds - Cocoa
Association of Asia’s webinar on Asian cocoa demand - Leman
China Swine Conference, Chongqing, day 3
Monday,
Oct. 19:
- USDA
weekly corn, soybean, wheat export inspections, 11am - U.S.
crop conditions, harvesting progress for soybeans, corn, cotton, 4pm - EU
weekly grain, oilseed import and export data - Ivory
Coast cocoa arrivals
Tuesday,
Oct. 20:
- Malaysia
Oct. 1-20 palm oil export data - Virtual
international palm oil sustainability conference, Q&A Session - USDA
total milk production, 3pm - New
Zealand global dairy trade auction
Wednesday,
Oct. 21:
- EIA
U.S. weekly ethanol inventories, production, 10:30am
Thursday,
Oct. 22:
- USDA
weekly crop net-export sales for corn, soybeans, wheat, cotton, pork, beef, 8:30am - Port
of Rouen data on French grain exports - USDA
red meat production, 3pm - U.S.
cold storage data – pork, beef, poultry
Friday,
Oct. 23:
- China
customs publishes trade data on imports of corn, wheat, sugar and cotton - ICE
Futures Europe weekly commitments of traders report, 1:30pm (6:30pm London) - CFTC
commitments of traders weekly report on positions for various U.S. futures and options, 3:30pm - FranceAgriMer
weekly update on crop conditions - Unica
data on Brazil’s cane crush, sugar production (tentative) - U.S.
cattle on feed, poultry slaughter, 3pm - HOLIDAY:
Thailand
Source:
Bloomberg and FI
·
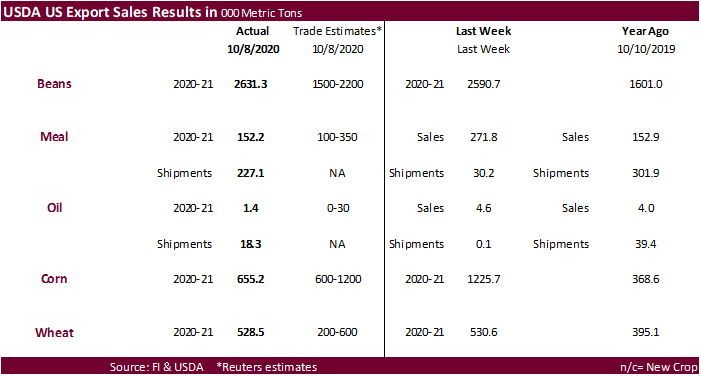
USDA export sales for soybeans were an excellent 2.631 million tons, slightly above the previous week and included 1.6 million tons for China (including 529,000 MT switched from unknown destinations).
·
Soybean meal sales dropped from the previous week to 152,200 tons but shipments were ok at 227,100 tons.
·
Soybean oil export sales were poor at only 1,400 tons. Shipments were 18,300.
·
USDA corn export sales were at the lower end of trade expectations at 652,200 tons. Mexico was the largest buyer. China was only 140,700 tons and included 65,000 tons switched from South Korea
and decreases of 3,200 tons.
·
All-wheat export sales were steady from the previous week at 528,500 tons. Mexico and Japan were the largest buyer. China was in there for a cargo but much of it was switched from unknown.
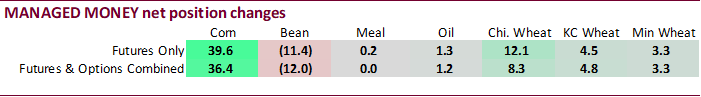
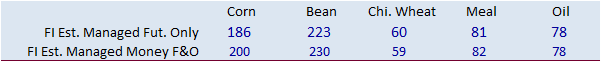
SUPPLEMENTAL
Non-Comm Indexes Comm
Net Chg Net Chg Net Chg
Corn
175,333 37,791 325,593 -7,031 -431,655 -26,113
Soybeans
187,628 -13,239 201,305 1,321 -374,056 14,790
Soyoil
65,828 2,930 114,402 -5,277 -198,908 -3,132
CBOT
wheat 16,424 8,706 130,079 -2,029 -126,653 -4,971
KCBT
wheat 12,363 -46 65,037 911 -77,197 -372
FUTURES
+ OPTS Managed Swaps Producer
Net Chg Net Chg Net Chg
Corn
170,869 36,404 166,689 -9,120 -388,968 -24,878
Soybeans
226,444 -11,950 125,711 3,501 -365,579 15,563
Soymeal
77,068 1 83,914 1,680 -206,624 6,865
Soyoil
82,188 1,194 94,015 1,562 -213,269 -6,006
CBOT
wheat 38,590 8,254 79,616 -469 -112,315 -3,940
KCBT
wheat 32,197 4,817 45,707 1,853 -76,617 -1,979
MGEX
wheat -1,774 3,338 2,244 28 -3,417 -3,199
———- ———- ———- ———- ———- ———-
Total
wheat 69,013 16,409 127,567 1,412 -192,349 -9,118
Live
cattle 56,038 -2,979 75,454 215 -134,782 814
Feeder
cattle -3,834 -1,962 5,118 -162 -2,725 550
Lean
hogs 37,154 1,481 51,339 -1,075 -95,025 1,528
Macros
US
Retail Sales (M/M) Sep 1.9% (est 0.7%; prev 0.6%)
-US
Retail Sales Ex. Auto (M/M) Sep 1.5% (est 0.5%; prevR 0.5%; prev 0.7%)
-US
Retail Sales Ex. Auto & Gas (M/M) Sep 1.5% (est 0.5%; prevR 0.5%; prev 0.7%)
-US
Retail Sales Control Group (M/M) Sep 1.4% (est 0.2%; prevR -0.3%; prev -0.1%)
Canada
Manufacturing Sales (M/M) Aug -2.0% (est -1.4%; prevR 7.2%; prev 7.0%)
US
Univ. Of Michigan Sentiment Oct P: 81.2 (est 80.5; prev 80.4)
–
Conditions Oct P: 84.9 (est 88.5; prev 87.8)
–
Expectations Oct P: 78.8 (est 77.0; prev 75.6)
–
1-Year Inflation Oct P: 2.7% (prev 2.6%)
–
5-10 Year Inflation Oct P: 2.4% (prev 2.7%)
US
Business Inventories (M/M) Aug: 0.3% (est 0.4%; prev 0.1%)
Acreage
2021
IHS
Vantage:
US
corn plantings 92, -1.7 from Sep
US
soybeans 89.2, +2.1 from last month
US
all-wheat 46.3, +0.87 from last month
US
cotton 12.6, up 0.015 from last month
FI:
Corn
at 91.0, soy 89.0, all wheat 46.1, cotton 13.25
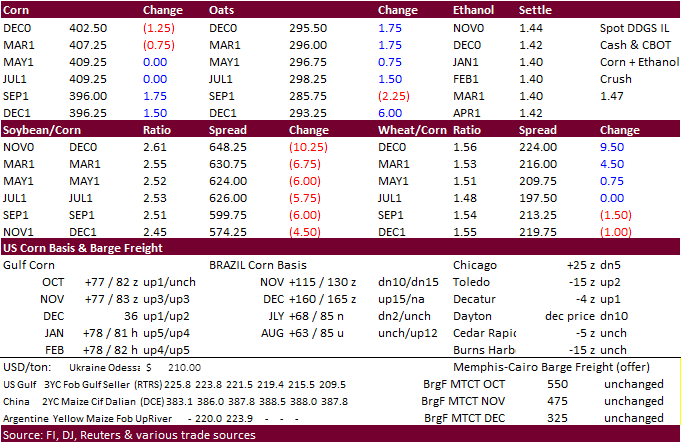
Corn.
-
Corn
futures ended mixed as bull spread traders shored up positions. -
December
corn ended 1.75 cents lower. -
Funds
sold an estimated net 3,000 corn.
-
We
have an upward target of $4.20 for December corn futures.
-
December
corn gained over March corn this week and it appears this spread has the potential to invert. Last time this happened with the CZ/CH spread was back in the drought year of 2012. See comment below the export development section.
-
Germany
ASF: One new case; 70 cases since September 10 -
Germany
is in talks with Asian countries to lift pork import bans.
Corn
Export Developments
-
USDA
announced private exporters sold: 128,000 tons of corn for delivery to Mexico during the 2020/2021 marketing year.
-
South
Korea’s KFA bought 65,000 tons of South America corn at $246.83/ton c&f for arrival around March 30, 2021. Two days ago, KFA paid $247.69/ton for arrival around Jan 20. Yesterday KOCOPIA paid $251.82/ton from Brazil for arrival by Jan 20.
-
Results
awaited: Algeria seeks 30,000 tons of feed corn and 25,000 tons of feed barley on October 15.
-
Iran
opened a new tender for 200,000 tons of barley, set to close October 21.
CZ-CH.
Inverted
front month spread possible? We think it could happen, but not stickily based on STU ratios. Comparing the corn consumption, stocks, and STU globally, this year is very different to the drought year of 2012, last time the CZ/CH inverted. What I think has
changed for this crop year is the China demand since 2012-13, and that is the main reason we are seeing strong prices through the July 2021 futures contract. Delayed Brazil corn plantings may translate they will start their large export campaign about month
or two later, to about July/August. This also depends on how large FH 2021 soybean shipment volumes will end up. If Brazil is knocked out until mid-July, look for decent US corn export demand during FH 2021. Attached are a few world related STU graphs that
can tell a story comparing these two crop years.
China
could
potentially have a large impact on the global corn balance sheet. Up until a few years ago, many analysts looked at the USDA global balance sheet to get a sense of global demand, or at least changes in stocks from year over year, until China stocks swelled.
Then analysts starting backing out China from the world balance sheet as stocks in that country were considered a mystery, until this year, after China depleted a large amount of corn from their reserves by selling old crop corn on the local market after domestic
prices rose to around 5-year highs. The September CPI food inflation index for China increased 7.9% from the previous year thanks to tightening meat supplies while nonfood inflation was unchanged.
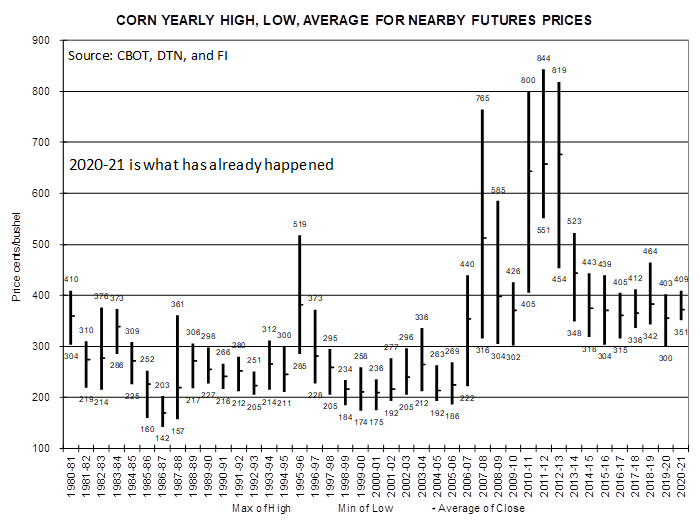
What
we found when going back to 1980-81 crop year, the current world STU ratio which includes China suggests 2020-21 CBOT corn should average $3.25. But when backing out China (World less China), the average price suggests $4.40 per bushel.
The
fact that China sold more than 55 million tons of corn out of 2014 & 2015 crop year state reserves in 2020 tells us the secret state run corn reserves could be much lower than what USDA has penciled in, as China has not procured a great amount of corn from
producers over the past three crop year campaigns, and that makes us think China will need to make up for the shortfall by importing large amounts of corn, if they want to ensure a large sizeable corn reserve.
China
over the next decade may change the landscape of the world corn balance sheet by becoming a very large major importer. World corn stocks could easily halve as early as 2023-24 if China drops their current self-sufficiency policy and allows both government
state run firms and private companies to import more than 20 million tons of corn per year. The largest impact may have to come from the private side. 2020 corn TRQ import ceiling is currently set at 7.2 million tons but raised it earlier this year to 9.2
million tons. If China changes their grain TRQ import policies by raising and/or abolishes TRQ’s, China corn, and other grain end users may end up importing large amounts of wheat, barley, oats, DDGS, sorghum and corn from 2021 onward. On the government
side, an initiative to restock reserves with 2019 and 2020 crop year corn could be massive, given China has already unleashed more than 55 million tons in 2020. Remember China is spending money to build out storage facilities throughout the country. China
could be the sleeping giant when it comes to the long-term outlook in corn futures.

Updated
10/15/20
December
corn is seen in a $3.90-$4.20 range (up 15 cents for the top end of the range)
China
could easily change the global balance sheet if they boost corn imports above 15 million tons in 2021.
Soybeans
-
The
soybean complex traded lower on end of week profit taking, especially in the bull spreads as traders await to see if Brazil planting progress increases over the next week. USDA announcement of soybean sales did little to limit losses.
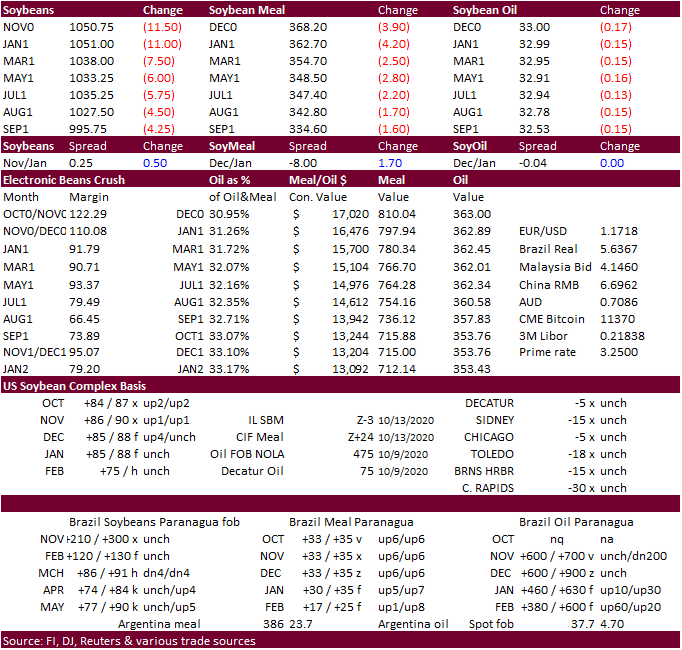
-
November
soybeans fell 12.25 cents and March was off 7.75 cents. December soybean meal was down $4.60 and December soybean oil off 18 points.
-
Funds
sold an estimated net 10,000 soybeans, 5,000 soybean meal and 2,000 soybean oil.
-
The
Brazilian government plans to lower the import tariffs on soybean. Soybean products, and corn imports for countries outside the Mercosur block trade until 2021. Back in September they cut rice import tariffs to zero through the end of the year. Brazil is
seeing extremely high corn and soybean domestic prices. The tariff on corn and soy imports from outside Mercosur, which includes Paraguay, Uruguay and Argentina, was 8%.
-
Offshore
values this morning were leading CBOT soybean oil 23 higher (54 lower for the week to date) and meal
$3.90 higher ($2.00 higher for the week
to date). -
China
cash crush margins were 97 cents on out our calculation (unchanged from previous) compared to 88 last week and 125 year ago.
-
USDA
announced private exporters sold: 175,000 tons of soybeans for delivery to unknown during the 2020/2021 marketing year and 216,150 tons of soybeans received during the reporting period for delivery to unknown destinations during the 2020/2021 marketing year.
-
Syria
seeks 50,000 tons of soybean meal and 50,000 tons of corn on October 26 for delivery within four months of contract.
Updated
10/12/20
November
soybeans are seen in a $10.25-$11.10 range
December
soybean meal is seen in a $345-$385 range
December
soybean oil is seen in a 32.50-35.00 range
-
Global
wheat prices have been on a tear recently due to an influx of global tender announcements.
-
Nearby
Chicago wheat is nearly trading at a 6-year high. KC is at an Aug 2018 high. EU wheat hit new highs on production concerns for Argentina and large French wheat sales to China.
-
Chicago
December wheat was up 7.0 cents, Dec KC up 0.75 and Dec MN up 1.0 cent. -
Funds
bought an estimated 4,000 soft red winter wheat contracts. -
Egypt
sales they have enough reserves for more than seven months. They may tender soon.
-
French
soft wheat planting progress was 12 percent as of October 12, up 6 percent from week earlier and compares to 16 percent in 2019. Winter barley was only 17 percent vs. 32% year ago.
-
Paris
(Matif) December wheat hit new highs and was up more than 11 percent over the past month. It ended 2.25 higher at 209.00 euros.
US
wheat associates weekly price report
https://www.uswheat.org/wp-content/uploads/2020/10/PR-201016.pdf
-
South
Korea’s MFG bought 60,000 tons of US feed wheat at $268.40/ton c&f out of the PNW for Feb 15-Mar 15 shipment.
-
Awaited:
Offers around $284/ton – Pakistan seeks 300,000 tons of wheat on October 14 for arrival by end of January.
-
Awaited:
5 participants – Ethiopia seeks 400,000 tons of wheat by October 13. -
Awaited:
(new 9/15) Ethiopia seeks about 200,000 tons of milling wheat on October 15. -
Jordan
issued a new tender for 120,000 tons of wheat set to close October 21. -
Japan
seeks 80,000 tons of feed wheat and 100,000 tons of feed barley on October 21 for arrival by February 25.
-
Turkey
seeks 175,000 tons of wheat on October 22 for shipment between November 9 and November 24.
·
Mauritius seeks 5,500 tons of white rice on October 20 for Dec 15-Mar 15, 2021 delivery.
Updated
10/9/20
December Chicago wheat is seen in a $5.70-$6.30 range
December KC wheat is seen in a $5.20-$5.70 range
December MN wheat is seen in a $5.35-$5.60 range
This
summary is based on reports from exporters for the period October 2-8, 2020.
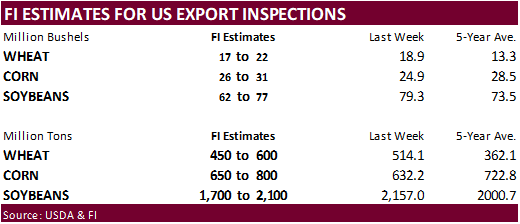
Wheat: Net
sales of 528,500 metric tons (MT) for 2020/2021 were unchanged from the previous week, but up 23 percent from the prior 4-week average. Increases primarily for Mexico (229,000 MT, including decreases of 11,000 MT), Japan (62,200 MT), China (57,400 MT, including
50,000 MT switched from unknown destinations and decreases of 2,000 MT), Thailand (55,000 MT), and unknown destinations (47,500 MT), were offset by reductions for the Philippines (28,400 MT) and Brazil (1,700 MT). For 2021/2022, nets sales of 71,200 MT were
for Brazil (60,000 MT) and Mexico (11,200 MT). Exports of 506,700 MT were down 28 percent from the previous week and 15 percent from the prior 4-week average. The destinations were primarily to China (182,400 MT), Nigeria (96,900 MT), Brazil (58,300 MT),
the Philippines (54,300 MT), and Mexico (36,200 MT). Optional Origin Sales: For 2020/2021, new optional origin sales of 10,000 MT were reported for Spain. The current outstanding balance of 10,000 MT, all Spain.
Late Reporting: For 2020/2021, exports totaling 9,900 MT were reported late. The destination was Colombia.
Corn:
Net sales of 655,200 MT for 2020/2021 were down 47 percent from the previous week and 63 percent from the prior 4-week average. Increases primarily for Mexico (203,800 MT, including decreases of 1,200 MT), Colombia (184,200 MT, including 33,000 MT switched
from unknown destinations and decreases of 5,800 MT), Japan (175,800 MT, including 70,900 MT switched from unknown destinations and decreases of 5,100 MT), China (140,700 MT, including 65,000 MT switched from South Korea and decreases of 3,200 MT), and Costa
Rica (47,800 MT), were offset by reductions for unknown destinations (152,100 MT) and South Korea (7,700 MT). Exports of 815,100 MT were down 13 percent from the previous week and 5 percent from the prior 4-week average. The destinations were primarily to
Mexico (306,500 MT), China (269,700 MT), South Korea (58,000 MT), Honduras (49,100 MT), and Colombia (43,200 MT).
Optional Origin Sales: For 2020/2021, new optional origin sales of 65,000 MT were reported for Ukraine. The current outstanding balance of 804,800 MT is for Vietnam (260,000 MT), Taiwan (204,200 MT), Argentina (127,000 MT), Ukraine (95,000 MT), South
Korea (65,000 MT), and unknown destinations (53,600 MT).
Barley:
No net sales were reported for the week. Exports of 200 MT were to Taiwan.
Sorghum:
No
net sales were reported for the week. Exports of 600 MT were primarily to China.
Rice:
Net
sales of 10,000 MT for 2020/2021 were down 96 percent from the previous week and 92 percent from the prior 4-week average. Increases were primarily for Canada (3,800 MT, including decreases of 100 MT), Jordan (2,100 MT), Israel (2,000 MT), Mexico (1,100 MT),
and Honduras (300 MT). Exports
of 35,200 MT were up noticeably from the previous week and up 79 percent from the prior 4-week average. The destinations were primarily to Colombia (23,000 MT), Canada (3,700 MT), Jordan (2,900 MT), Taiwan (1,600 MT), and Mexico (1,500 MT).
Export Adjustments: Accumulated export of medium brown rice to South Korea were adjusted down 1,000 MT for week ending June 25th. This shipment was reported in error.
Soybeans:
Net sales of 2,631,300 MT for 2020/2021were down 74 percent from the previous week, but up 18 percent from the prior 4-week average. Increases primarily for China (1,592,500 MT, including 529,000 MT switched from unknown destinations, 1,500 MT switched from
Taiwan, and decreases of 95,200 MT), Mexico (210,400 MT, including decreases of 3,700 MT), Germany (115,700 MT), Indonesia (110,800 MT, including 68,000 MT switched from unknown destinations), and Thailand (101,200 MT, including 65,000 MT switched from unknown
destinations), were offset by reductions primarily for unknown destinations (37,700 MT). Exports of 2,384,000 MT were down 8 percent from the previous week, but up 21 percent from the prior 4-week average. The destinations were primarily to China (1,743,300
MT), Mexico (147,400 MT), Germany (115,700 MT), Indonesia (97,200 MT), and the Netherlands (54,600 MT).
Optional Origin Sales: For 2020/2021, the current outstanding balance of 126,000 MT, all China.
Exports
for Own Account:
For 2020/2021, the current exports for own account outstanding balance is 7,300 MT, all Canada.
Export Adjustments: Accumulated export of soybeans to the Netherland were adjusted down 57,537 MT for week ending September 3rd and 58,117 MT for week ending September 10th. The correct destination for these shipments is Germany
and is included in this week’s report.
Soybean
Cake and Meal:
Net sales of 152,200 MT for 2020/2021, primarily for Ecuador (37,200 MT, including 30,000 MT switched from unknown destinations), Canada (32,300 MT, including decreases of 600 MT), Morocco (31,200 MT), Colombia (25,500 MT), and Venezuela (20,000 MT), were
offset by reductions primarily for unknown destinations (34,600 MT). Exports of 227,100 MT were primarily to the Philippines (100,100 MT), Ecuador (32,200 MT), Morocco (26,200 MT), Canada (24,400 MT), and Mexico (23,400 MT).
Soybean
Oil: Net
sales of 1,400 MT for 2020/2021 primarily for Canada (1,800 MT) and Mexico (200 MT), were offset by reductions for the Dominican Republic (500 MT), Guatemala (100 MT), and South Korea (100 MT). For 2021/2022, total net sales of 200 MT were for Canada. Exports
of 18,300 MT were primarily to Venezuela (5,700 MT), Colombia (4,800 MT), Jamaica (3,000 MT), Mexico (2,700 MT), and Canada (2,100 MT).
Cotton:
Net sales of 98,900 RB for 2020/2021 were down 45 percent from the previous week and 61 percent from the prior 4-week average. Increases primarily for Pakistan (36,500 RB, including 500 RB switched from Indonesia), China (20,000 RB, including decreases of
13,200 RB), Guatemala (14,900 RB), Vietnam (13,800 RB), and Turkey (10,400 RB), were offset by reductions for Bangladesh (4,000 RB) and Japan (1,300 RB). For 2021/2022, total net sales of 13,200 RB were for China. Exports of 192,600 RB were up 35 percent
from the previous week, but down 7 percent from the prior 4-week average. Exports were primarily to China (59,500 RB), Vietnam (51,200 RB), Mexico (20,400 RB), Pakistan (13,000 RB), and Turkey (9,700 RB). Net sales of Pima totaling 17,800 RB were down 18
percent from the previous week and 19 percent from the prior 4-week average. Increases were primarily for China (5,900 RB), Bangladesh (4,800 RB), India (4,200 RB, including decreases 1,800 RB), Switzerland (1,300 RB), and Pakistan (1,000 RB). Exports of
12,700 RB were down 20 percent from the previous week and 10 percent from the prior 4-week average. The primary destinations were China (8,200 RB), India (1,300 RB), Peru (700 RB), Vietnam (700 RB), and Honduras (700 RB).
Exports for Own account: For 2020/2021, the current exports for own account outstanding balance of 13,000 RB is for China (8,100 RB), Indonesia (3,900 RB), and Bangladesh (1,000 RB).
Hides
and Skins:
Net sales of 379,800 pieces for 2020 were up 33 percent from the previous week, but down 1 percent from the prior 4-week average. Increases primarily for China (229,400 whole cattle hides, including decreases of 16,200 pieces), Mexico (55,500 whole cattle
hides, including decreases of 400 pieces), South Korea (43,400 whole cattle hides, including decreases of 1,000 pieces), Hong Kong (6,400 whole cattle hides), and Thailand (2,300 whole cattle hides, including decreases of 100 pieces), were offset by reductions
for Turkey (200 pieces), Canada (200 pieces), and Indonesia (200 pieces). Additionally, total net sales of 42,000 kip skins were reported for Italy. Exports of 447,900 pieces reported for 2020 were down 3 percent from the previous week, but unchanged from
the prior 4-week average. Whole cattle hides exports were primarily to China (361,800 pieces), South Korea (40,200 pieces), Mexico (25,900 pieces), Hong Kong (6,400 pieces), and Thailand (5,000 pieces).
Net
sales of 107,300 wet blues
for 2020 were down 9 percent from the previous week and 17 percent from the prior 4-week average. Increases primarily for Italy (41,800 unsplit, including decreases of 200 unsplit), Thailand (28,200 unsplit, including decreases of 300 unsplit), Vietnam (10,100
unsplit and 4,000 grain splits, including decreases of 100 unsplit), China (11,900 unsplit), and Taiwan (5,100 unsplit), were offset by reductions for Mexico (100 unsplit). For 2021, total net sales of 57,000 wet blues unsplit were reported for Italy. Exports
of 128,100 wet blues for 2020 were down 31 percent from the previous week and 25 percent from the prior 4-week average. The destinations were primarily to China (38,000 unsplit), Italy (28,400 unsplit and 6,000 grain splits), Vietnam (28,800 unsplit), Thailand
(17,600 unsplit), and Mexico (4,400 unsplit and 2,300 grain splits). Net sales of 5,200 splits were for China (2,900 pounds, including decreases of 25,700 pounds) and China (2,300 pounds, including decreases of 2,000 pounds). Exports of 689,600 pounds
were to Vietnam (560,100 pounds) and China (129,500 pounds).
Beef:
Net
sales of 13,400 MT reported for 2020 were down 35 percent from the previous week and 31 percent from the prior 4-week average. Increases were primarily for Japan (3,900 MT, including decreases of 200 MT), Mexico (3,100 MT), South Korea (2,200 MT, including
decreases of 300 MT), Taiwan (1,000 MT, including decreases of 100 MT), and Canada (600 MT, including decreases of 100 MT). For 2021, net sales of 400 MT were reported for Japan (200 MT), Taiwan (100 MT), and Chile (100 MT). Exports of 16,200 MT were down
5 percent from the previous week and 1 percent from the prior 4-week average. The destinations were primarily to Japan (4,200 MT), South Korea (3,800 MT), Hong Kong (1,500 MT), China (1,500 MT), and Mexico (1,500 MT).
Pork:
Net
sales of 26,800 MT reported for 2020 were down 56 percent from the previous week and 43 percent from the prior 4-week average. Increases were primarily for Mexico (11,900 MT, including decreases of 800 MT), China (5,200 MT, including decreases of 1,400 MT),
Japan (4,700 MT, including decreases of 300 MT), Canada (1,100 MT, including decreases of 400 MT), and Colombia (800 MT, including decreases of 100 MT). For 2021, net sales of 1,600 MT were primarily for Mexico (700 MT), Chile (600 MT), and Australia (300
MT). Exports of 36,000 MT were down 2 percent from the previous week, but up 8 percent from the prior 4-week average. The destinations were primarily to Mexico (11,700 MT), China (10,700 MT), Japan (4,600 MT), Canada (2,200 MT), and South Korea (1,800 MT).
U.S. EXPORT SALES FOR WEEK ENDING 10/8/2020
|
|
CURRENT MARKETING YEAR |
NEXT MARKETING YEAR |
||||||
|
COMMODITY |
NET SALES |
OUTSTANDING SALES |
WEEKLY EXPORTS |
ACCUMULATED EXPORTS |
NET SALES |
OUTSTANDING SALES |
||
|
CURRENT YEAR |
YEAR |
CURRENT YEAR |
YEAR |
|||||
|
|
THOUSAND METRIC TONS |
|||||||
|
WHEAT |
|
|
|
|
|
|
|
|
|
HRW |
243.0 |
1,533.4 |
1,296.9 |
222.0 |
4,096.7 |
3,896.0 |
11.2 |
22.0 |
|
SRW |
30.5 |
317.9 |
590.1 |
26.9 |
876.4 |
1,138.4 |
60.0 |
100.0 |
|
HRS |
85.7 |
1,530.0 |
1,302.0 |
223.1 |
2,825.8 |
2,472.2 |
0.0 |
5.0 |
|
WHITE |
169.0 |
1,450.0 |
1,011.1 |
34.7 |
1,876.9 |
1,618.2 |
0.0 |
0.0 |
|
DURUM |
0.3 |
220.6 |
184.5 |
0.0 |
321.6 |
312.4 |
0.0 |
0.0 |
|
TOTAL |
528.5 |
5,051.9 |
4,384.5 |
506.7 |
9,997.4 |
9,437.1 |
71.2 |
127.0 |
|
BARLEY |
0.0 |
33.2 |
39.5 |
0.2 |
8.9 |
18.0 |
0.0 |
0.0 |
|
CORN |
655.2 |
22,010.1 |
7,726.7 |
815.1 |
4,492.9 |
2,637.8 |
0.0 |
206.0 |
|
SORGHUM |
0.0 |
2,541.8 |
223.1 |
0.7 |
393.4 |
43.8 |
0.0 |
136.0 |
|
SOYBEANS |
2,631.3 |
34,217.2 |
13,004.1 |
2,384.0 |
9,018.0 |
4,848.4 |
0.0 |
60.0 |
|
SOY MEAL |
152.2 |
3,361.9 |
3,237.1 |
227.1 |
257.3 |
379.0 |
0.0 |
18.1 |
|
SOY OIL |
1.4 |
159.8 |
155.9 |
18.3 |
18.4 |
44.0 |
0.2 |
0.2 |
|
RICE |
|
|
|
|
|
|
|
|
|
L G RGH |
0.2 |
543.6 |
418.6 |
23.7 |
78.8 |
307.9 |
0.0 |
0.0 |
|
M S RGH |
0.0 |
26.5 |
18.8 |
0.0 |
2.4 |
12.0 |
0.0 |
0.0 |
|
L G BRN |
0.9 |
11.3 |
11.2 |
2.8 |
9.0 |
3.5 |
0.0 |
0.0 |
|
M&S BR |
0.1 |
23.0 |
0.5 |
1.1 |
26.4 |
0.8 |
0.0 |
0.0 |
|
L G MLD |
2.1 |
61.2 |
123.5 |
2.5 |
66.7 |
256.9 |
0.0 |
0.0 |
|
M S MLD |
6.7 |
98.4 |
106.9 |
5.0 |
72.1 |
125.7 |
0.0 |
0.0 |
|
TOTAL |
10.0 |
764.1 |
679.6 |
35.2 |
255.4 |
706.9 |
0.0 |
0.0 |
|
COTTON |
|
THOUSAND RUNNING BALES |
||||||
|
UPLAND |
98.9 |
5,728.2 |
7,078.8 |
192.6 |
2,505.0 |
2,056.8 |
13.2 |
498.9 |
|
PIMA |
17.8 |
232.4 |
121.3 |
12.7 |
115.8 |
81.3 |
0.0 |
0.7 |
Terry Reilly
Senior Commodity Analyst – Grain and Oilseeds
Futures International │0ne Lincoln Centre, Suite 1450 | Oakbrook Terrace, IL 60181
W: 312.604.1366
ICE IM:
treilly1
Skype: fi.treilly

Trading of futures, options, swaps and other derivatives is risky and is not suitable for all persons. All of these investment products are leveraged, and you can lose more than your initial deposit. Each investment product is offered
only to and from jurisdictions where solicitation and sale are lawful, and in accordance with applicable laws and regulations in such jurisdiction. The information provided here should not be relied upon as a substitute for independent research before making
your investment decisions. Futures International, LLC is merely providing this information for your general information and the information does not take into account any particular individual’s investment objectives, financial situation, or needs. All investors
should obtain advice based on their unique situation before making any investment decision. The contents of this communication and any attachments are for informational purposes only and under no circumstances should they be construed as an offer to buy or
sell, or a solicitation to buy or sell any future, option, swap or other derivative. The sources for the information and any opinions in this communication are believed to be reliable, but Futures International, LLC does not warrant or guarantee the accuracy
of such information or opinions. Futures International, LLC and its principals and employees may take positions different from any positions described in this communication. Past results are not necessarily indicative of future results.