PDF Attached
USDA
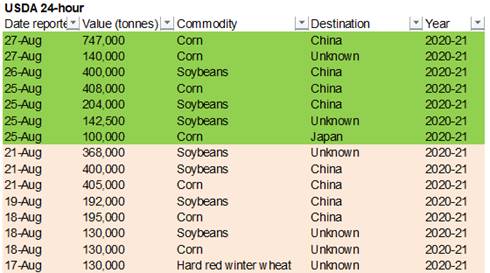
reported sales of 747,000 tons of corn to China and 140,000 tons to unknow, both for new-crop. There were no major surprises in the USDA export sales report. US agricultures futures are higher on follow through buying related to US, EU, and Black Sea crop
concerns.
We
look for US corn conditions to decline 3 points, soybeans down 2, and spring wheat unchanged, when updated on Monday.
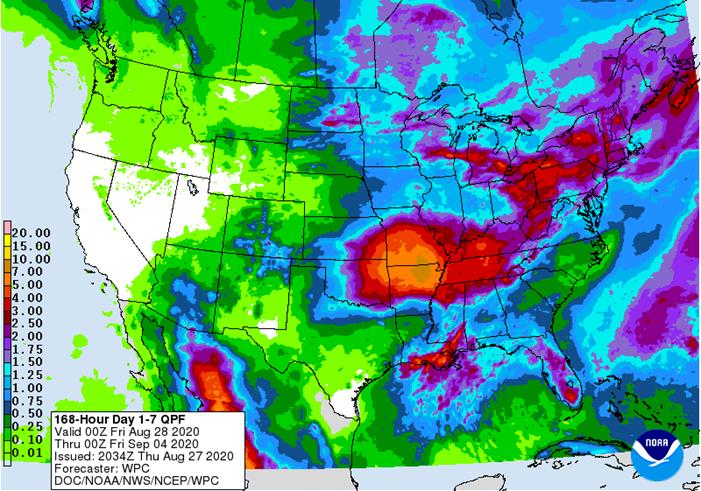
![[Image of WPC Flash Flooding/Excessive Rainfall Outlook]](https://www.eoxlive.com/wp-content/uploads/2020/08/image004-14.jpg)
MOST
IMPORTANT WEATHER AROUND THE WORLD
- Changes
Overnight - More
frost and freezes occurred in eastern Australia this morning; including Queensland and easternmost New South Wales where winter crops will be first to reproduce soon – frequent freezes have occurred this week
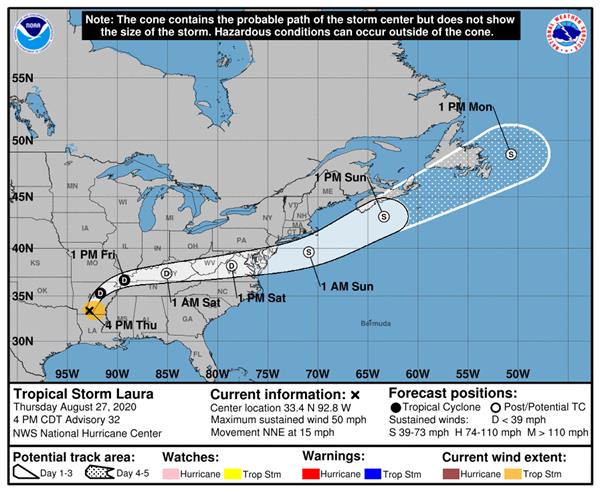
- Hurricane
Laura slammed into southwestern Louisiana producing very strong wind flooding rain and a huge storm surge – damage is widespread, but more so to structures and personal property than to Agriculture, although losses to sugarcane and some minor corn, soybean,
cotton and rice might have occurred as well - Cooling
in Canada’s Prairies next week may eventually bring a threat of frost and a few light freezes, but there is time for changes in the outlook and a widespread killing freeze might be avoided for a while - Northeastern
China is dealing with Typhoon Bavi today with heavy rainfall expected over saturated areas of Liaoning and Jilin, China as well as northwestern North Korea where flooding is expected - India
has a new monsoon low that will move to central parts of the nation inducing some new flooding rainfall over the next few days; this event will eventually reach Gujarat and southern Rajasthan this weekend - Argentina
rainfall this week has been a little disappointing and it will stay that way, but today’s GFS model run is trying to bring additional opportunities for rain to the region as time moves along in the next two weeks - West-central
Africa rainfall may increase gradually over the next couple of weeks - Hurricane
Laura has had a profound impact on western Louisiana today - At
0800 CDT today, the center of the storm was 80 miles south southeast of Shreveport, La. at 31.4 north, 93.2 west moving northerly at 15 mph and producing a sustained wind speed of 100 mph - Observed
peak wind speeds noted so far were 132 mph at the time of landfall - Hurricane
force wind occurred as far to the east as Lafayette, La. - Rainfall
has varied from 2.50 to more than 7.65 inches with the greatest rainfall noted in west-central Louisiana and near the Lafayette area - Widespread
power outages have occurred - Storm
surge reached 40 miles inlands - Typhoon
Bavi was located 249 miles north of Inchon, South Korea at 0900 GMT today near 42.5 north, 126.5 east moving north northeasterly at 26 mph while producing a maximum sustained wind speed of 46 mph
- The
storm was losing its tropical characteristics and was expected to dissipate in the next 24 hours over northeastern China - The
storm will continue to race northeast through the remainder of northeastern China - Rapid
weakening is under way - A
new tropical cyclone is forming east of the Philippines that is expected to become a very intense storm and threaten Japan and the Korean Peninsula next week - East-central
China will experience net drying over the coming week - Totally
dry weather is not expected, but warm temperatures and quick evaporation will lead to some firming soil - The
change will be welcome after recent abundant rain - Southeastern
China will experience more frequent rainfall over the coming week ending the recent stretch of drier days that has firmed the soil in some areas after recent months of flooding - Xinjiang
China will continue to experience milder than usual conditions at times today but a warming trend is expected this weekend and next week that will help to bring on better late season crop maturation - Temperatures
in northeastern Xinjiang slipped to the 40s and lower 50s Fahrenheit this morning after being in the 60s and lower 70s Wednesday afternoon - High
temperatures in the key areas in the west and south were in the 90s to near 100 and lows were in the upper 60s and lower 70s - Flooding
on the Yangtze River will continue for a while as the region continues to drain surplus water from behind the Three Gorges Dam - India
rain will be greatest in Madhya Pradesh over the next few days and the into Gujarat and southern Rajasthan this weekend - Some
of this region is already saturated and flooding has occurred in the past week and more may occur as the additional rain arrives - concern
over rice, sugarcane, pulse, soybean and other crops produced in the region remains high - Frequent
rain may impact northern India during the weekend and early next week perpetuating concern over some crop conditions - Early
maturing cotton may be opening bolls and could encounter some decline in fiber quality because of the rain in far northern India during the weekend and early next week - Second
week of September looks drier in northern India which is suggestive of a possible withdrawing monsoon - Australia
experienced additional frost and a few freezes in southeastern Queensland and eastern New South Wales this morning, but no more damage of significance than that which occurred earlier this week was suspected - Australia
rainfall over the coming week will be most significant in Victoria while very light showers occur in other southernmost locations in the nation - Interior
parts of Australia will be left mostly dry - Queensland
still needs rain immediately to support reproduction that is expected to begin in early September - Europe
will experience alternating periods of rain and sunshine during the next ten days favoring the North and Baltic Sea regions and areas from the Alps into western Ukraine, northern Romania and western Russia - Central
France to central Germany will not see much precipitation of significance for a while, although a few showers will be possible - Temperatures
will be seasonable in the west and above average in the southeast - Eastern
and southern Ukraine, Russia’s Southern Region, southeastern Romania and eastern Bulgaria will continue too dry for at least another ten days, despite a few sporadic showers - Rain
is most likely from Moldova to eastern Bulgaria next week and it may bring a little relief to persistent dryness - Any
showers that occur in eastern Ukraine or Russia’s Southern region will be minimal and offer little to no relief to persistent dryness - Russia’s
easternmost New Lands will receive rain periodically during the next week - Drying
is needed to support wheat and sunseed maturation and harvesting - Central
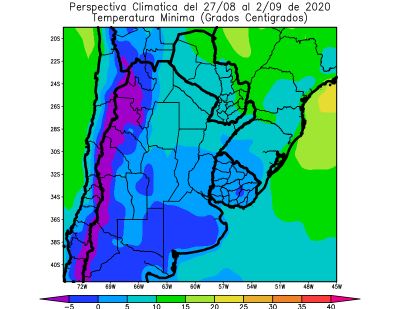
and southwestern portions of the spring wheat and sunseed area will experience net drying - Argentina’s
rainfall this week has been a little disappointing with only light rain occurring and much of it missed the drier areas in Cordoba and parts of Santa Fe - Additional
rain is expected today - Today’s
forecast offers other opportunities for very light rain to impact many of the nation’s crop areas during the next couple of week periodically - The
moisture will help ease dryness, but amounts will not be enough to seriously bolster soil moisture - A
greater soaking of rain is needed - Brazil
rainfall over the coming week will be confined to the upper east coast through mid-week and then alternating periods of light rain and sunshine will occur in Rio Grande do Sul during the following full week - Aggressive
corn planting is expected - Wheat
development will continue to advance well - Some
areas in Rio Grande do Sul may become too wet over time as some of the rain becomes heavy - Temperatures
will be warmer in Argentina and southern Brazil this week after last week’s bitter cold - U.S.
weather - Rain
over the next ten days in the Midwest will be greatest in the central and east where 0.50 to 1.50 inches is expected
- The
exception will be in the Ohio River Valley and areas south into Kentucky where 1.00 to 3.00 inches and a few totals to 4.00 inches will result from Hurricane Laura’s remnants Friday into Saturday - Western
Midwest rainfall in the next ten days will vary from 0.20 to 0.75 inch with a few 1.00 to 2.00-inch amounts in Wisconsin, southeastern Minnesota and possibly northeastern Iowa. A few areas in northern Missouri might also get upwards to 1.50 inches - Iowa,
Nebraska and a few South Dakota and southwestern Minnesota locations will be driest - Cooling
is expected to come in waves across the Great Plains and Midwest during the next two weeks - Southeastern
U.S. will experience frequent showers and thunderstorms for the next week to ten days - Net
drying will occur in the Great Plains and Midwest over much of the forecast period, despite some scattered showers and thunderstorms - Resulting
moisture will be restricted and light - West
Texas will not receive much rain of significance and will stay very warm to hot over the next week and then cool down somewhat late next week into the following weekend
- Some
showers will accompany the cool down - Far
western U.S. rainfall will remain restricted over the next two weeks - Northwestern
U.S. Plains and far southern Canada’s Prairies will also remain drier bias for a while - Cooler
air advertised in Canada’s Prairies and the northwestern U.S. Plains August 30-September 5 will bring down temperatures and induce a little precipitation - Some
frost or a brief bout of light freezing conditions might occur in a small part of Alberta and far northern Saskatchewan during this period, but the greatest risk of such conditions will occur from the end of next week into the second week in September.
- Cooling
will begin to impact the northern U.S. Plains and southern Canada over the next week to ten days - The
coolest conditions will occur briefly early next week and again in the second weekend of the two week outlook -
Ontario
and Quebec weather is mostly good with alternating periods of rain and sunshine over the next two weeks -
Temperatures
will be seasonable
Source:
World Weather Inc.
- USDA
weekly crop net-export sales for corn, soybeans, wheat, cotton, pork, beef, 8:30am - International
Grains Council monthly report - Port
of Rouen data on French grain exports - EARNINGS:
Sime Darby Plantation
FRIDAY,
August 28:
- ICE
Futures Europe weekly commitments of traders report, 1:30pm (6:30pm London) - CFTC
commitments of traders weekly report on positions for various U.S. futures and options, 3:30pm - FranceAgriMer
weekly update on crop conditions - U.S.
agricultural prices paid, received, 3pm
Source:
Bloomberg and FI
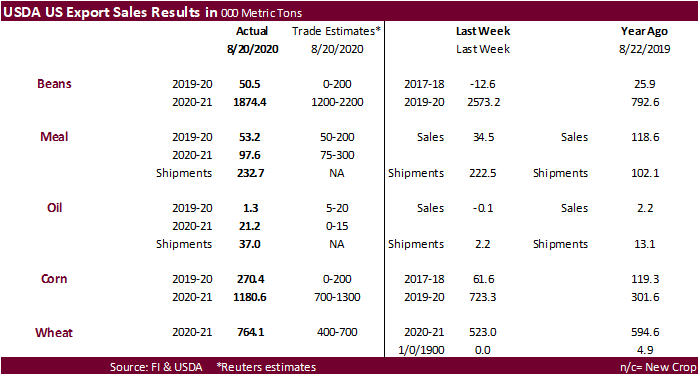
USDA
export sales.
No
major surprises in USDA’s export sales report. Meal and SBO sales remain on the light side but shipments were ok. All-wheat exceeded expectations and corn and soybean new-crop sales were within expectations. Pork sales were robust again at 39,400 tons with
China and Mexico taking about two-thirds of the amount.
US
GDP Annualized (Q/Q) Q2 S: -31.7% (est -32.5%; prev -32.9%)
US
GDP Price Index Q2 S: -2.0% (est -1.8%; prev -1.8%)
US
Core PCE (Q/Q) Q2 S: -1.0% (est -1.1%; prev -1.1%)
US
Initial Jobless Claims Aug 22: 1006K (est 1000K; prevR 1104K; prev 1106K)
US
Continuing Claims Aug 15: 14535K (est 14400K; prevR 14758K; prev 14844K)
US
Personal Consumption Q2 S: -34.1% (est -34.2%; prev -34.6%)
US
Pending Home Sales (M/M) Jul: 5.9% (est 2.0%; prev R 15.8%)
–
Pending Home Sales NSA (Y/Y) Jul: 15.4% (est 10.8%; prev R 11.8%)
-
Corn
rose on exports and spillover strength from soybeans. -
Export
sales for corn were at the high-end of expectation at 1.451 million tons. -
Demand
has also increased on inflation concerns which has been a persistent, underlying, bid in the ag markets for the past couple weeks. We expect this to continue and dips will be met with end-users extending coverage. On the other side of this, we have the farmer
still needing to sell grain and will be there on rallies. -
Funds
bought an estimated net 10,000 corn contracts. -
IGC:
Global corn production 1.166 billion tons, up 2 million tons. -
StoneX:
Ukraine corn production 34.5MMT from 38MMT. One trade estimate is as low as 31 million tons.
-
A
Reuters poll for South Africa’s corn production came in at 15.386 million tons for 2019-20, down from 15.545 estimated by the CEC in July. That includes 8.954MMT white and 6.432 million tons of yellow.
-
China
plans to auction off 10,000 tons of pork from reserves on August 28. More than 500,000 tons had been sold so far this year.
Corn
Export Developments
-
Under
the 24-hour reporting system, private exporters reported to the U.S. Department of Agriculture the following activity: -
Export
sales of 747,000 metric tons of corn for delivery to China during the 2020/2021 marketing year; and -
Export
sales of 140,000 metric tons of corn for delivery to unknown destinations during the 2020/2021 marketing year. -
China
sold 89 percent or 3.547 million tons of corn offered from state reserves at an average price of 1,919 yuan per ton.

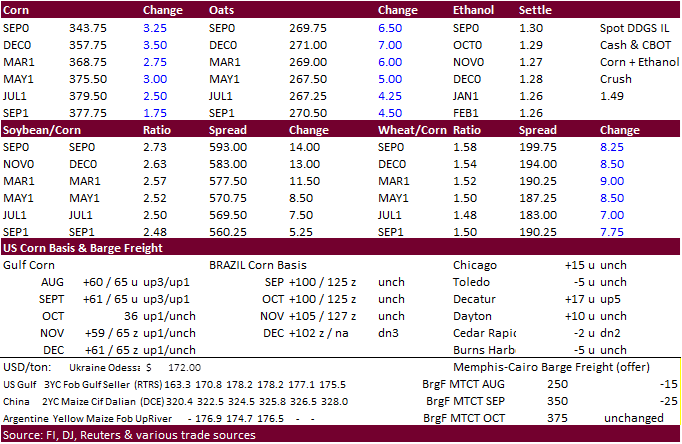
-
September
corn is seen in a $3.35 and $3.60 range. December $3.40-$3.85 range.
-
CBOT
November soybeans exploded higher on US crop concerns of dry weather coupled with earlier damage to the crop in Iowa.
-
Export
sales of 1.925 million tons were in-line with expectations. -
Soybean
crush margins continue to slide from the rally in soybeans and soybean oil. Soybeans reached the highest level in 7.5 months on a record volume session.
-
Funds
bought an estimated net 20,000 soybean contracts, 4,000 soy meal, and 6,000 soybean oil.
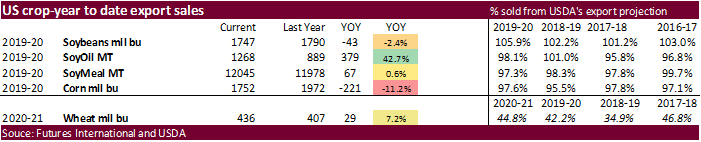
-
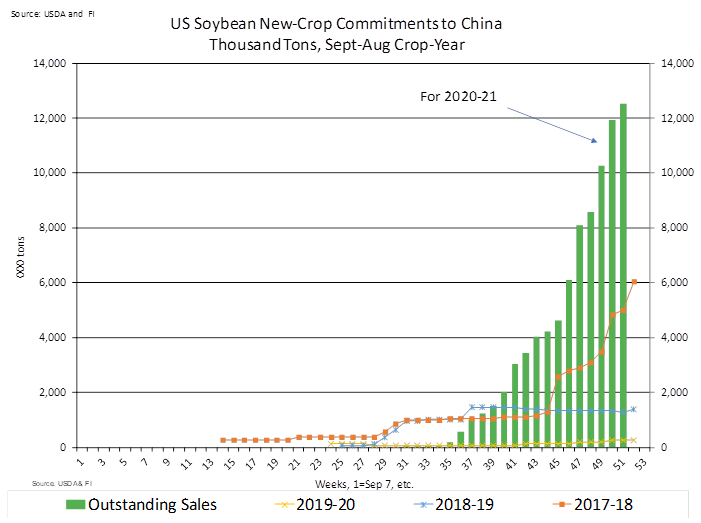
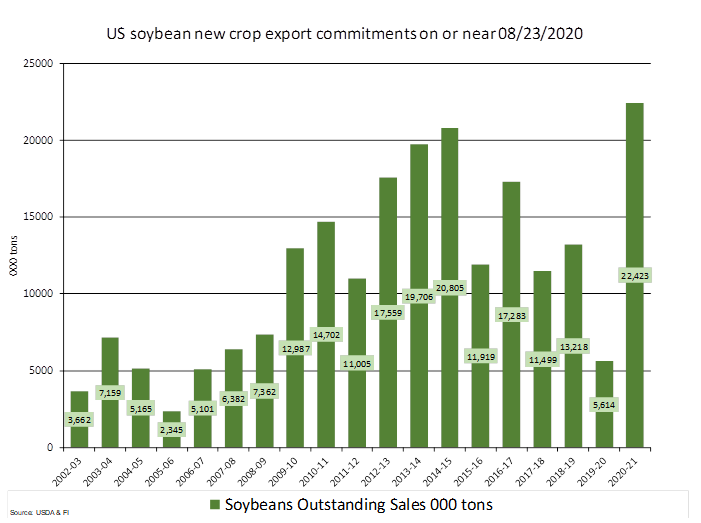
Calendar
year 2020 (from about Jan 1) US soybean old crop sales to China total 6.57 million tons (includes recent sales announcements) and new crop for this time of year are a record 12.516 million tons. So, excluding unknown sales, China purchased about 19.1 million
tons of 2020 US soybeans to date. Note unknown soybean old and new-crop outstanding sales stand at 7.775 million tons. That could put China commitments between 23 and 25.5 million tons. Note USDA export inspections show roughly 5.4 million tons of US soybeans
were shipped to China from early January through August 20.
-
We
heard China bought at least 1 cargo of US soybeans out of the US Gulf and at least 1 Brazil new-crop soybean cargo.
-
Brazil
will temporarily remove import tariffs for countries outside Mercosur, on rice, corn and soybeans, to battle inflation. No dates were cited.
-
China’s
Sinograin will offer 98,831 tons of domestic soybeans on August 28. China’s Sinograin sold 51% of the 98,807 tons of soybeans offered at auction earlier this week. AgriCensus noted Sinograin has a target to sell up to 3 million tons of soybeans from reserves
and replenish supplies with recent purchases. This rotation will ensure temporary supplies for the upcoming marketing year.
-
South
Korea’s NOFI bought about 60,000 tons of soybean meal at an estimated $386.25 / ton c&f for shipment from South America between October 8 and October 27.
-
Results
awaited: Algeria seeks 30,000 tons of soybean meal for shipment by September 25, optional origin.
-
Results
awaited: Syria
seeks 50,000 tons of soybean meal and 50,000 tons of corn on Aug 25 for delivery within four months of contract signing.

-
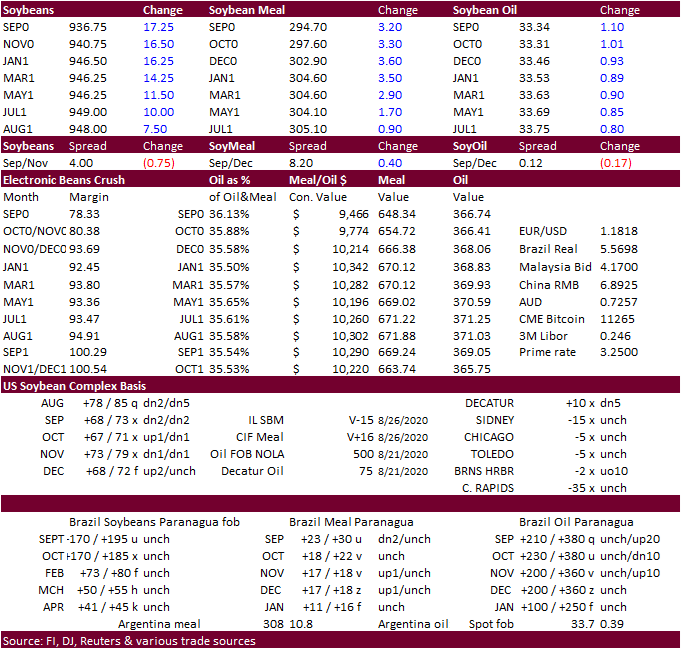
September
soybeans are seen in a $9.30-$9.60 range. November $9.25-$10.00. -
September
soybean meal is seen in a $285 to $305 range. December $290-$325. -
September
soybean oil range is seen in a 33 to 34 range. December 32.50-35.00 range.
-
US
wheat futures climbed on technical buying after breaking the 200-day moving average at $5.4250 basis WZ0. Inflation hedge themed buying also lent support, and that type of buying in commodities will be more pronounced in SRW due to its lower volumes when
compared to soybeans and corn. -
Funds
bought an estimated net 10,000 Chicago wheat contracts. -
IGC:
Global wheat production 763MMT, up 1MMT. -
Argentina
salles of barley to China have increased dramatically. Reuters noted Argentina is on track to send at least 250,000 tons this year and a record 380,000 tons in 2021…up from virtually nothing in 2019. 2021 Argentina shipments to China could reach 800,000
tons. China has also been a good buyer of EU barley and other feedgrains.
-
Paris
December wheat was up 2.75 euros at 186.75 (5-week high).
-
South
Korea’s NOFI bought about 65,000 tons of feed wheat at an estimated $245.95 / ton c&f for arrival by December 25.
-
Taiwan
bought 99,895 tons of US wheat for Oct/Nov shipment. -
First
consignment: shipment between Oct. 13 and Oct. 27 -
30,955
tons of U.S. dark northern spring wheat of 14.5% protein content bought at $273.19 a ton FOB U.S. Pacific Northwest coast.
-
14,160
tons of hard red winter wheat of 12.5% protein content bought at $264.74 a ton FOB
-
5,285
tons of soft white wheat with 9% protein bought at $226.16 a ton FOB. -
Second
consignment for shipment between Oct. 29 and Nov. 12 -
30,635
tons of dark northern spring wheat of 14.5% protein content bought at $271.14 a ton FOB U.S. Pacific Northwest coast.
-
14,030
tons of hard red winter wheat of 12.5% protein content bought at $263.62 a ton FOB -
4,830
tons of soft white wheat of 9% protein bought at $226.23 a ton FOB. -
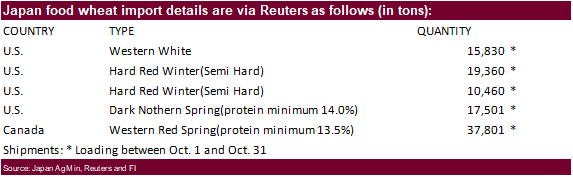
Japan
bought 100,952 tons of food wheat this week. Original detail as follows:
-
After
picking up 60,000 tons, Jordan issued another import tender for 120,0,00 tons of wheat set to close Sep 2.
-
Syria
looks to sell and export 100,000 tons of feed barley with offers by Sep 1.
-
Syria
seeks 200,000 tons of soft wheat from EU/Russia on Sept. 9 and 200,000 tons of wheat from Russia on Sept. 14. -
Results
awaited: Pakistan seeks 1.5 million tons of wheat. Lowest offer was $233.85/ton for 200,000 tons of milling wheat.
Chicago
wheat (WZ0) with 20, 50, and 200-day moving average and Bollinger bands.
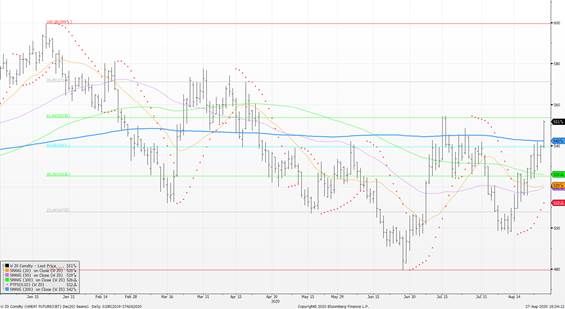
Updated
8/27/20
- Chicago September is seen in a $5.35-$5.55 range. December $5.30-$5.75
range. - KC September; $4.50-$4.75 range. December $4.50-$5.60.
- MN September $5.10-$5.30 range. December $5.25-$5.70.
This
summary is based on reports from exporters for the period August 14-20, 2020.
Wheat: Net
sales of 764,100 metric tons (MT) for 2020/2021 were up 46 percent from the previous week and 41 percent from the prior 4-week average. Increases primarily for Mexico (134,300 MT, including decreases of 100 MT), China (123,000 MT), unknown destinations (102,500
MT), Indonesia (86,100 MT), and the Philippines (53,600 MT, including decreases of 1,400 MT), were offset by reductions primarily for Ecuador (9,800 MT), Sri Lanka (3,400 MT), and Italy (2,000 MT). For 2020/2021, net sales of 11,900 MT were for Mexico (10,900
MT) and Malaysia (1,000 MT). Exports of 646,400 MT were up 59 percent from the previous week and 31 percent from the prior 4-week average. The destinations were primarily to the Philippines (91,600 MT), China (63,000 MT), Mexico (60,800 MT), Taiwan (60,500
MT), and Thailand (59,900 MT).
Corn:
Net sales of 270,400 MT for 2019/2020 were up noticeably from the previous week and from the
prior
4-week average. Increases primarily for Japan (97,900 MT, including decreases of 7,700 MT), Taiwan (91,200 MT), Mexico (62,300 MT, including decreases of 11,100 MT), Colombia (45,800 MT, including 65,000 MT switched from unknown destinations and decreases
of 27,700 MT), and China (19,400 MT), were offset by reductions primarily for unknown destinations (64,500 MT). For 2020/2021, net sales of 1,180,500 MT primarily for China (666,000 MT), Mexico (233,000 MT), unknown destinations (156,200 MT), Japan (50,000
MT), and Guatemala (20,300 MT), were offset by reductions for Canada (4,600 MT). Exports of 939,100 MT were down 22 percent from the previous week and 10 percent from the prior 4-week average. The destinations were primarily to Mexico (255,300 MT), Japan
(227,600 MT), Colombia (219,100 MT), China (135,400 MT), and Canada (33,300 MT).
Optional
Origin Sales: For 2019/2020, the current outstanding balance of 390,000 MT is for South Korea (260,000 MT), Vietnam (65,000 MT), and Taiwan (65,000 MT). For 2020/2021, the current outstanding balance of 260,000 MT is for Vietnam (195,000 MT) and South Korea
(65,000 MT).
Barley:
No net sales for 2020/2021 were reported for the week. Exports of 300 MT were down 25 percent from the previous week and 83 percent from the prior 4-week average. The destination was Japan.
Sorghum:
Net sales reductions of 3,900 MT for 2019/2020 were down 16 percent from the previous week and down noticeably from the prior 4-week average. Increases reported for China (56,100 MT, including 60,000 MT switched from unknown destinations and decreases of
3,900 MT), were offset by reductions for unknown destinations (60,000 MT). For 2020/2021, net sales of 312,500 MT were reported for China (177,000 MT) and unknown destinations (135,500 MT). Exports of 56,100 MT were up 16 percent from the previous week,
but down 71 percent from the prior 4-week average. The destination was China.
Rice:
Net
sales of 75,300 MT for 2020/2021 were primarily for Mexico (21,400 MT), Haiti (15,000 MT), Honduras (12,600 MT), Jordan (12,000 MT), and Guatemala (5,000 MT). Exports of 48,500 MT were primarily to Honduras (22,000 MT), Japan (12,400 MT), South Korea (4,500
MT), Saudi Arabia (4,000 MT), and Mexico (2,200 MT).
Soybeans:
Net sales of 50,400 MT for 2019/2020 were down noticeably from the previous week and down 82 percent from the prior 4-week average. Increases primarily for the Netherlands (213,500 MT, including 196,500 MT switched from unknown destinations and decreases
of 1,600 MT), China (168,600 MT, including 200,000 MT switched from unknown destinations and decreases of 7,100 MT), Spain (71,500 MT, including 65,000 MT switched from unknown destinations), Lebanon (21,600 MT, switched from Egypt), and Thailand (20,200 MT),
were offset by reductions primarily for unknown destinations (469,300 MT). For 2020/2021, net sales of 1,874,400 MT were primarily for unknown destinations (822,000 MT), China (592,000 MT), Pakistan (136,000 MT), Indonesia (75,800 MT), and Thailand (74,500
MT), were offset by reductions for Japan (100 MT). Exports of 1,276,400 MT were up 42 percent from the previous week and 49 percent from the prior 4-week average. The destinations were primarily to China (762,900 MT), the Netherlands (213,500 MT), Spain
(71,500 MT), Mexico (54,800 MT), and Egypt (30,900 MT).
Exports
for Own Account:
For 2019/2020, the current exports for own account outstanding balance is 61,600 MT, all Canada.
Soybean
Cake and Meal:
Net sales of 53,200 MT for 2019/2020 were up 54 percent from the previous week, but down 63 percent from the prior 4-week average. Increases primarily for Canada (31,500 MT, including decreases of 600 MT), Ecuador (30,900 MT, including 30,000 MT switched
from unknown destinations), Japan (12,000 MT, switched from unknown destinations), Mexico (10,400 MT), and Honduras (6,300 MT, including 6,000 MT switched from El Salvador), were offset by reductions primarily for unknown destinations (42,000 MT), Guatemala
(8,300 MT), Colombia (1,300 MT), and Belgium (1,200 MT). For 2020/2021, net sales of 97,600 MT were primarily for the Philippines (45,000 MT), Canada (26,100 MT), Costa Rica (10,000 MT), Guatemala (7,600 MT), and El Salvador (5,300 MT). Exports of 232,700
MT were up 5 percent from the previous week and 11 percent from the prior 4-week average. The destinations were primarily to the Philippines (75,700 MT), Ecuador (30,900 MT), Colombia (27,400 MT), Mexico (26,100 MT), and Guatemala (16,100 MT).
Soybean
Oil: Net
sales of 1,300 MT for 2019/2020 resulting in increases primarily for Algeria (10,000 MT, switched from unknown destinations), Morocco (8,000 MT, switched from unknown destinations), and Canada (1,100 MT, including decreases of 100 MT), were offset by reductions
for unknown destinations (18,000 MT). For 2020/2021, net sales of 21,200 MT were reported for South Korea (15,000 MT), Venezuela (5,500 MT), and Canada (700 MT). Exports of 37,000 MT were up noticeably from the previous week and from the prior 4-week average.
The destinations were primarily to South Korea (13,000 MT), Algeria (10,000 MT), Morocco (8,000 MT), Venezuela (3,800 MT), and Canada (1,500 MT).
Cotton:
Net sales of 156,600 RB for 2020/2021 primarily for Vietnam (75,500 RB), China (46,800 RB, including decreases of 177,700 RB), Turkey (11,200 RB), Pakistan (7,000 RB, including decreases of 200 RB), and Indonesia (4,800 RB, including 100 RB switched from Japan),
were offset by reductions for Japan (1,100 RB) and Ecuador (400 RB). For 2021/2022, total net sales of 7,900 RB were for China. Exports of 277,500 RB were primarily to China (153,500 RB), Vietnam (29,400 RB), Indonesia (16,100 RB), Bangladesh (14,800 RB),
and Pakistan (13,100 RB). Net sales of Pima totaling 12,600 RB were primarily for Peru (4,400 RB), India (3,300 RB), Vietnam (2,600 RB), China (900 RB), and Bangladesh (900 RB). Exports of 10,200 RB were primarily to China (2,400 RB), Vietnam (2,200 RB),
India (1,900 RB), Pakistan (1,700 RB), and Indonesia (900 RB).
Exports
for Own account:
For 2020/2021, exports for own account totaling 17,100 RB primarily to China (10,700 RB) and Malaysia (3,300 RB) were applied to new or outstanding sales. The current exports for own account outstanding balance of 13,600 RB is for China (8,700 RB), Indonesia
(3,900 RB), and Bangladesh (1,000 RB).
Hides
and Skins:
Net sales of 403,100 pieces for 2020 were down 37 percent from the previous week and 13 percent from the prior 4-week average. Increases primarily for China (291,200 whole cattle hides, including decreases of 7,400 pieces), Mexico (52,300 whole cattle hides,
including decreases of 800 pieces), South Korea (27,100 whole cattle hides, including decreases of 2,400 pieces), Thailand (11,500 whole cattle hides), and Cambodia (11,300 whole cattle hides), were offset by reductions primarily for Brazil (800 pieces).
Additionally, net sales of 800 kip skins resulting in increases for China (1,300 kip skins), were offset by reductions for Belgium (500 kip skins). Exports of 473,400 pieces reported for 2020 were down 1 percent from the previous week and 4 percent from the
prior 4-week average. Whole cattle hides exports were primarily to China (385,500 pieces), South Korea (36,800 pieces), Mexico (25,500 pieces), Vietnam (9,300 pieces), and Brazil (2,700 pieces). In addition, exports of 6,400 kip skins were to Belgium (5,100
kip skins) and China (1,300 kip skins).
Net
sales of 116,500 wet blues
for 2020 were down 55 percent from the previous week and 23 percent from the prior 4-week average. Increases primarily for China (45,600 unsplit), Thailand (26,500 unsplit), Vietnam (16,000 unsplit and 200 grain splits), South Korea (12,400 grain splits),
and Taiwan (9,100 unsplit), were offset by reductions primarily for Italy (200 unsplit). Exports of 90,800 wet blues for 2020 were down 7 percent from the previous week and 18 percent from the prior 4-week average. The destinations were primarily to China
(33,200 unsplit), Italy (17,100 unsplit and 4,800 grain splits), Thailand (15,400 unsplit), Vietnam (7,700 unsplit and 3,800 grain splits), and Mexico (4,400 unsplit and 2,100 grain splits). Net sales of 1,822,100 splits reported for Vietnam (1,822,400 pounds,
including decreases of 24,700 pounds), were offset by reductions for China (300 pounds). Exports of 156,800 pounds were to Vietnam (115,800 pounds) and China (41,000 pounds).
Beef:
Net
sales of 11,800 MT reported for 2020 were down 40 percent from the previous week and 36 percent from the prior 4-week average. Increases primarily for China (3,300 MT), Hong Kong (3,200 MT, including decreases of 300 MT), South Korea (1,500 MT, including
decreases of 2,200 MT), Japan (1,100 MT, including decreases of 1,800 MT), and Mexico (800 MT), were offset by reductions primarily for Indonesia (300 MT) and Chile (100 MT). Exports of 18,200 MT were down 1 percent from the previous week, but up 2 percent
from the prior 4-week average. The destinations were primarily to South Korea (6,000 MT), Japan (4,900 MT), Taiwan (1,400 MT), Mexico (1,100 MT), and Canada (1,100 MT).
Pork:
Net
sales of 39,400 MT reported for 2020 were up 91 percent from the previous week and 56 percent from the prior 4-week average. Increases primarily for China (11,200 MT, including decreases of 400 MT), Mexico (10,700 MT, including decreases of 1,100 MT), Canada
(6,600 MT, including decreases of 400 MT), Japan (3,300 MT, including decreases of 100 MT), and South Korea (1,900 MT, including decreases of 100 MT), were offset by reductions primarily for Nicaragua (200 MT). For 2021, net sales of 500 MT were primarily
for Australia (400 MT). Exports of 32,600 MT were up 2 percent from the previous week, but down 2 percent from the prior 4-week average. The destinations were primarily to Mexico (9,900 MT), China (9,500 MT), Japan (3,500 MT), Canada (3,200 MT), and South
Korea (1,500 MT).
U.S. EXPORT SALES FOR WEEK ENDING 8/20/2020
|
|
CURRENT MARKETING YEAR |
NEXT MARKETING YEAR |
||||||
|
COMMODITY |
NET SALES |
OUTSTANDING SALES |
WEEKLY EXPORTS |
ACCUMULATED EXPORTS |
NET SALES |
OUTSTANDING SALES |
||
|
CURRENT YEAR |
YEAR |
CURRENT YEAR |
YEAR |
|||||
|
|
THOUSAND METRIC TONS |
|||||||
|
WHEAT |
|
|
|
|
|
|
|
|
|
HRW |
483.7 |
1,856.3 |
1,519.2 |
269.9 |
2,636.9 |
2,741.2 |
10.9 |
10.9 |
|
SRW |
8.5 |
638.3 |
696.6 |
61.4 |
446.3 |
688.1 |
1.0 |
1.0 |
|
HRS |
147.6 |
1,882.5 |
1,700.3 |
142.8 |
1,572.8 |
1,340.0 |
0.0 |
5.0 |
|
WHITE |
124.2 |
1,200.7 |
970.7 |
168.3 |
1,180.3 |
982.5 |
0.0 |
0.0 |
|
DURUM |
0.0 |
250.9 |
296.5 |
4.0 |
213.3 |
148.1 |
0.0 |
0.0 |
|
TOTAL |
764.1 |
5,828.6 |
5,183.3 |
646.4 |
6,049.6 |
5,900.0 |
11.9 |
16.9 |
|
BARLEY |
0.0 |
30.8 |
45.8 |
0.3 |
8.4 |
11.1 |
0.0 |
0.0 |
|
CORN |
270.4 |
2,333.8 |
1,558.6 |
939.1 |
42,158.0 |
48,542.1 |
1,180.5 |
13,384.1 |
|
SORGHUM |
-3.9 |
229.1 |
85.0 |
56.1 |
4,396.1 |
1,640.1 |
312.5 |
2,157.6 |
|
SOYBEANS |
50.4 |
4,308.3 |
3,721.2 |
1,276.4 |
43,240.2 |
44,992.1 |
1,874.4 |
22,423.1 |
|
SOY MEAL |
53.2 |
1,284.4 |
1,605.7 |
232.7 |
10,760.7 |
10,372.2 |
97.6 |
1,308.9 |
|
SOY OIL |
1.3 |
139.6 |
149.6 |
37.0 |
1,128.3 |
738.9 |
21.2 |
102.0 |
|
RICE |
|
|
|
|
|
|
|
|
|
L G RGH |
41.1 |
163.1 |
316.0 |
22.8 |
49.5 |
111.8 |
0.0 |
0.0 |
|
M S RGH |
0.0 |
27.9 |
26.9 |
0.2 |
1.0 |
1.9 |
0.0 |
0.0 |
|
L G BRN |
0.1 |
8.7 |
2.3 |
0.5 |
2.0 |
1.7 |
0.0 |
0.0 |
|
M&S BR |
0.0 |
26.1 |
0.1 |
4.1 |
5.8 |
0.2 |
0.0 |
0.0 |
|
L G MLD |
20.5 |
69.4 |
228.7 |
5.8 |
11.9 |
107.4 |
0.0 |
0.0 |
|
M S MLD |
13.5 |
52.9 |
84.5 |
15.1 |
34.1 |
48.7 |
0.0 |
0.0 |
|
TOTAL |
75.3 |
348.0 |
658.5 |
48.5 |
104.3 |
271.6 |
0.0 |
0.0 |
|
COTTON |
|
THOUSAND RUNNING BALES |
||||||
|
UPLAND |
156.6 |
5,874.1 |
7,222.8 |
277.5 |
977.7 |
861.9 |
7.9 |
329.1 |
|
PIMA |
12.6 |
183.6 |
124.3 |
10.2 |
24.3 |
29.3 |
0.0 |
0.0 |
Terry Reilly
Senior Commodity Analyst – Grain and Oilseeds
Futures International │190 S LaSalle St., Suite 410│Chicago, IL 60603
W: 312.604.1366
AIM: fi_treilly
ICE IM:
treilly1
Skype: fi.treilly

Trading of futures, options, swaps and other derivatives is risky and is not suitable for all persons. All of these investment products are leveraged, and you can lose more than your initial deposit. Each investment product is offered
only to and from jurisdictions where solicitation and sale are lawful, and in accordance with applicable laws and regulations in such jurisdiction. The information provided here should not be relied upon as a substitute for independent research before making
your investment decisions. Futures International, LLC is merely providing this information for your general information and the information does not take into account any particular individual’s investment objectives, financial situation, or needs. All investors
should obtain advice based on their unique situation before making any investment decision. The contents of this communication and any attachments are for informational purposes only and under no circumstances should they be construed as an offer to buy or
sell, or a solicitation to buy or sell any future, option, swap or other derivative. The sources for the information and any opinions in this communication are believed to be reliable, but Futures International, LLC does not warrant or guarantee the accuracy
of such information or opinions. Futures International, LLC and its principals and employees may take positions different from any positions described in this communication. Past results are not necessarily indicative of future results.