PDF Attached
Lower
than expected US corn and soybean yields and a large cut to global wheat stocks sent futures flying higher after the release of the USDA reports. The soybean complex paired gains to end mixed while corn and wheat ended sharply higher. At 1 pm CT, FSA prevented
plantings were released and early consensus is for the US planted area for corn and soybeans to be revised higher later this crop season.
USDA
released their August supply and demand outlook
Reaction:
Initially
bullish. Soybean oil was the first commodity to tip over after traders realized US SBO for biofuel use was cut by a large 700 million pounds for combined old and new-crop.
USDA
OCE Secretary Briefing
https://www.usda.gov/sites/default/files/documents/august-2021-wasde-lockup-briefing.pdf
USDA
NASS Recap
https://www.nass.usda.gov/Newsroom/Executive_Briefings/2021/08-12-2021.pdf
USDA
update.
USDA’s
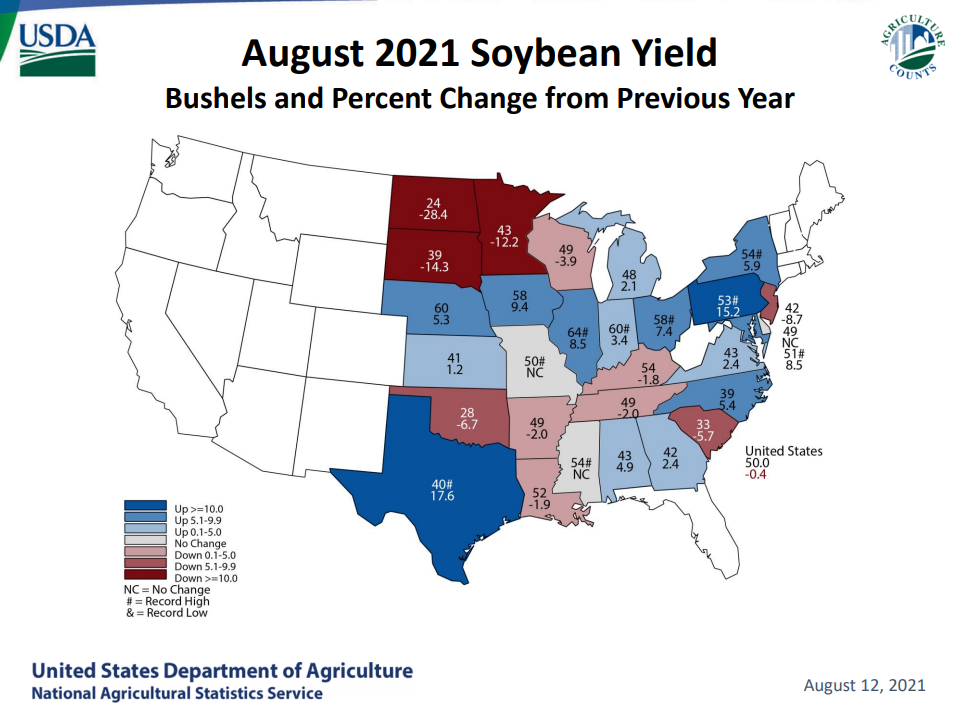
initial survey for the US soybean yield was 50.0, 0.4 below trade expectations and 0.8/bu below the July estimate. The harvested area was unchanged. US production of 4.339 billion was 66 million below July but still 204 million above 2020. With lower supply,
USDA revised down new-crop total use by 41 million by shaving off 20 million off the crush and 20 million off exports. Note the old crop crush and exports were down 15 and 10 million, respectively. Old crop stocks were taken up 25 million to 160 million
and new-crop unchanged at 155 million. One notable change the trade didn’t see off the bat was the combined 700-million-pound reduction to old and new crop soybean for biofuel use. Since USDA reduced the old crop crush by 15 million bushels, this cut production
for the products. Soybean oil production was taken down 175 million pounds. They lowered old crop SBO for biofuel by 200 million pounds and raised food use by 100 million. Food use was too low to begin with. 2020-21 soybean oil exports were lowered 75
million pounds to 1.700 billion, leaving stocks unchanged. For new crop, soybean oil production was lowered 235 million pounds after USDA lowered new crop crush by 20 million bushels. They raised new-crop food use by 300 million pounds, took biofuel use
down 500 million, resulting in a 35-million-pound reduction in the carryout stocks. The US ending stocks for meal were unchanged for old and new crop. However, with lower production, domestic use and exports were trimmed for both crop years.
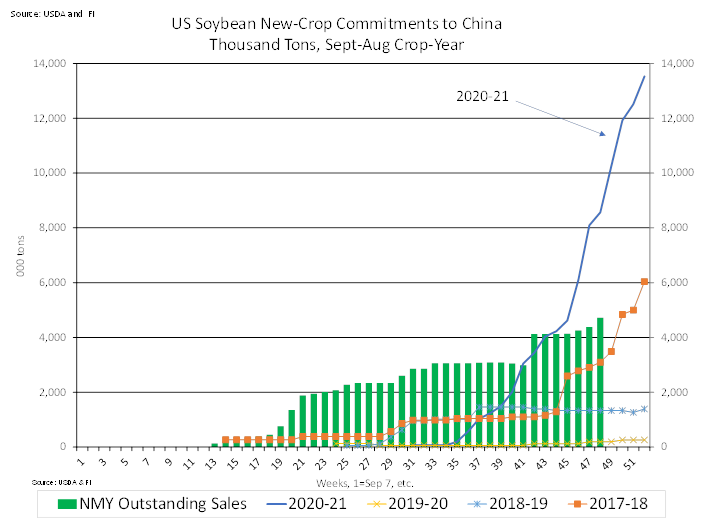
Soybean
world stocks for both crop years were reported above expectations after USDA trimmed old and new-crop China soybean imports by 1.0 million tons, despite tighter supplies for 2020-21 and 2021-22. The 2020-21 Argentina soybean production was taken down 0.5
million tons and Brazil soybean exports were lowered 0.5 million. China
old crop soybean imports were lowered 1 million tons to 97 million and new-crop was taken down 1 million to 101 million. Traders be warned. If September and October US exports fail to live up to expectations, it might be warranted to lower the US export
forecast, which is heavy on many balance sheets. For the 2021-22 world balance sheet, the largest change was the 1.8-million-ton reduction to the US soybean production. Global stocks at the end of 2021-22 were raised 1.7 million tons to 96.2 million tons,
3.3 million above 2020-21, or 3.6% higher.
The
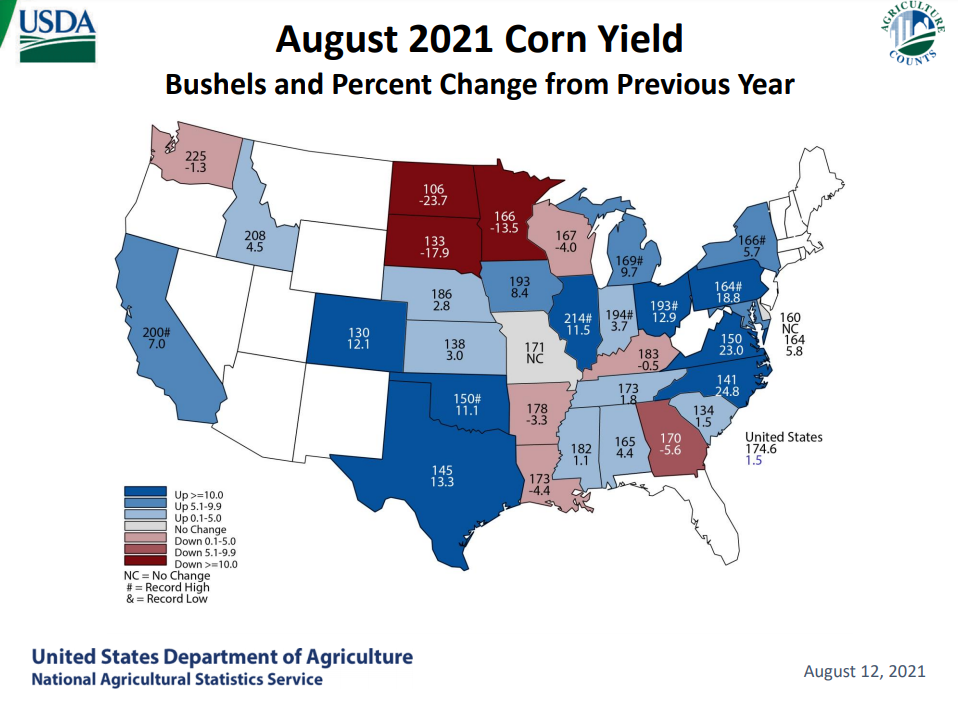
US corn yield was projected at 174.6 bushels per acre, 3.0 bushels below expectations and 4.9 below USDA July. The harvested area was left unchanged by USDA from June, resulting in US production dropping 415 million from the previous month to 14.750 billion
bushels, 254 million below trade expectations. USDA took old crop corn stocks 35 million higher and old crop was lowered 190 million from the previous month. With old crop sitting at 1.117 billion (7.4% STU), that was 21 million above an average trade guess.
New-crop is expected to expand to 1.242 million from the previous year (8.5%), still a tight carryout, and that was 55 million below the trade average. For the current crop year, USDA lowered corn exports by a more than expected 75 million bushels to 2.775
billion, and raised ethanol by 25 to 5.075 billion, and food use by 40 million, resulting in a 35 million higher carryout. New crop corn supplies were cut 380 million bushels (415 reduction in production and 35 higher begging stocks). USDA took new-crop
feed down 100, raised food by 10, lowered exports by 100 (we don’t agree given the 6.0-million-ton reduction in Brazil production), resulting in a 190 million reduction in ending stocks. China corn imports for new-crop were left unchanged at 26 million tons,
despite USDA slashing Brazil 2020-21 corn output by 6 million tons to 87 million (still too high).
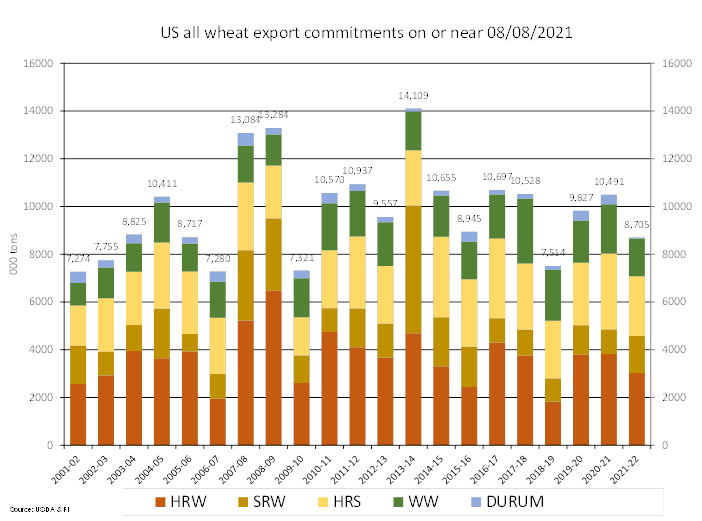
US
all wheat production was 1.697 billion bushels, 26 million below an average trade guess, down 3 percent or 49 million bushels from the previous forecast and down 129 million bushels or 7 percent from 2020. The US yield was 44.5 bushels per acre, down 1.3
bushel from July and down 5.2 bushels from 2020. The harvested area of 38.1 million acres was unchanged. Winter wheat production was projected at 1.319 billion bushels, down 45 million bushels or 3 percent from last month and 44 million below an average
trade guess. Hard Red Winter production was 777 million bushels, 29 million below trade expectations. Soft Red Winter was 366 million, slightly above expectations and Winter White 176 million bushels, 18 million below expectations. Other Spring wheat was
343 million bushels, only 1 million down from July and 18 million above trade expectations. Durum wheat was down 3 million from July to 35 million bushels. US 2021-22 new-crop wheat ending stocks were lowered 38 million bushels to 627 million, 17 million
below trade expectations. USDA lowered feed by 10 million and food use by 1 million, resulting in the 38 million decline in stocks. Outside the US, Russia wheat production was reduced 12.5 million tons to 72.5 million. Canada was lowed 7.5 million to 24
million tons. World production was reduced 16.5 million tons to 776.9 million, 1.1 million above 2020 and global stocks cut 12.6 million tons to 279.1 million, 9.8 million below the end of 2020-21.
Weather
WORLD
WEATHER INC.
NOT
MANY CHANGES AROUND THE WORLD
- Dryness
remains a concern in southeastern Europe where the Balkan Countries have been and will continue to be too dry in unirrigated areas
o
Temperatures will continue warmer than usual as well
o
This pattern will prevail for at least ten days and possibly longer
- Rainfall
in the heart of Europe has diminished this week while temperatures are mild to warm
o
The impact of this has been much improved small grain and winter oilseed maturation and harvest conditions
o
Fieldwork has been increasing as well
o
Rain is expected, but it will be infrequent and light enough to allow field progress to advance without any new risk to crops
- Eastern
Ukraine the upper and middle Volga River Basin, Kazakhstan and neighboring areas of Russia’s southern New Lands are unlikely to see much significant rain for a while
o
Spring wheat and sunseed production has been cut from unirrigated areas in Kazakhstan and neighboring areas of Russia
o
Summer crops are becoming more stressed from parts of Ukraine into the upper and middle Volga River Basin, but production cuts have been low
- Rain
expected in Russia’s Southern Region in this coming week will be very good for late season coarse grain and oilseed crops
o
Heavy rain is expected in the Krasnodar region where local flooding may result
- CIS
crop areas will be wettest across the north from the Baltic States through northern Russia during the next ten days
o
Rainfall of 1.00 to 2.00 inches is expected with a few amounts reaching 2.00 to 4.00 inches
o
Southern Russia rainfall will be more restricted, but some showers are expected
- Some
significant rain will fall in Krasnodar and the southwestern one-third of Russia’s Southern Region where 2.00 to more than 6.00 inches is possible - Wettest
near the Black Sea coast
o
Kazakhstan rainfall will be minimal for the coming week and temperatures will continue very warm to hot at times
o
Net drying is expected in much of Ukraine, much of the Volga River Basin and from northeastern parts of Russia’s Southern Region into Kazakhstan
o
Rain is expected in northern parts of Russia’s Southern Region into the lower Volga River Basin benefiting some late summer crops
- Southern
China is expected to trend too wet once again in the next ten days with frequent rain and cooler than usual temperatures
o
The ground is already saturated in some areas and flooding will come quickly for those areas
o
Rice will be most vulnerable to a change in condition because of too much rain, but some other crops may also be negatively impacted
- Other
areas in China from the Yellow River Basin northward through northeastern parts of the nation will see a good mix of weather - Northwestern
India will continue to experience a poor rainfall potential and some crop areas are drying out a little too much
o
Western and northern Rajasthan, Gujarat, Punjab, Haryana and central and southern parts of Pakistan are included in the driest areas
- Only
unirrigated crops are being stressed and there is still time for improved weather - Not
much rain is expected in these drier areas for at least another ten days - Most
of India’s weather continues favorable and summer crops have performed relatively well so far this season; too much rain has fallen recently in northern Madhya Pradesh and southeastern Rajasthan, however - Tropical
Depression Fred has reached the north coast of far eastern Cuba this morning
o
The storm will produce some heavy rain and windy conditions, but crop impacts are expected to be low due to the storm’s weak intensity and distance from key production areas
o
Fred will become a threat to Florida Saturday through Monday with heavy rain expected to begin in the Keys and along the southwest coast late Friday night into the weekend
o
Landfall is still expected near the Apalachicola area of northwestern Florida Monday
- Fred
will produce heavy rain and windy conditions in Florida citrus and sugarcane areas, but damage potentials are low unless the storm intensifies more than expected - Wind
gusts near the west coast of Florida will vary from 40 to 60 mph while eastern citrus and sugarcane areas will not experience wind much greater than 45 mph in gusts - Minor
citrus fruit droppage is possible – greatest near the west coast - Sugarcane
may get pushed down, but no permanent harm is anticipated - Another
disturbance in the central tropical Atlantic Ocean will be closely monitored for possible development through the weekend
o
This disturbance should take a path to the left (west) of Tropical Storm Fred which might bring the system into the eastern Gulf of Mexico next late week
- Confidence
is very low, though - The
system will impact the Greater Antilles next week with additional heavy rainfall - Another
heat wave is expected to evolve in the far western U.S. and western Canada over the next few days before advancing east into the Canada Prairies and northern U.S. Plains this weekend and early next week
o
Temperature extremes in the 90s and over 100 degrees Fahrenheit will occur in many areas once again and little to no rain will occur as the heatwave evolves
o
Most of the heat wave will shift to Ontario, Quebec and a part of both the U.S. Great Lakes region and northeastern states next week
- Cooling
that follows the weekend North America heatwave next week will be significant in western Canada and the U.S. Pacific Northwest
o
A strong low-pressure center is expected to evolve as a frontal system develops separating the heat wave from the cooler air to the west
- The
low-pressure center “may” pull some monsoon moisture from the Rocky Mountain region and some Gulf of Mexico moisture northward to set the stage for some needed rain in parts of the northern Plains and eastern Canada’s Prairies
- The
environment looks favorable of slow-moving thunderstorms and some significant rain, but the event is too far away to have high confidence.
- The
situation should be closely monitored, though - U.S.
central and southern Plains will experience sporadic shower and thunderstorm activity during the next week to ten days resulting in favorable mix of weather for many crops
o
Unirrigated summer coarse grain and oilseed crops would benefit from greater rainfall
- West
Texas cotton would benefit from a continuation of warmer temperatures at least some rainfall
o
The moisture is expected, but temperatures may be a little milder than desired for a while with cooling expected over the next few days
- U.S.
Delta weather will be favorably mixed over the next ten days for crop development
o
Harvest progress will advance around the precipitation
- South
Texas weather is expected to be dry for ten days favoring cotton, corn and sorghum harvesting
o
Rain is needed for citrus, sugarcane and many fruit and vegetable areas, although irrigation water is available and support most crops.
- U.S.
southeastern states will receive a good mix of rain and sunshine into the weekend, but could turn much wetter Sunday into Wednesday of next week due to Tropical Storm Fred
o
The storm is unlikely to produce damaging conditions for very many crops, but some flooding rain is expected and windy conditions should stay mostly in northwestern Florida
- Canada’s
Prairies will receive a few showers and experience cool weather into Friday morning
o
Low temperatures this morning slipped to the upper 40s and 50s
o
Dramatic warming is expected in western parts of the Prairies Friday and throughout the region Saturday and Sunday
- Temperatures
will rise from the 40s and 50s Fahrenheit Friday morning in the east to highs in the 90s to over 100 in much of the Prairies during the weekend and Monday
o
Cooling is expected next week and some thunderstorms producing significant rain may impact a part of the region as the cooler air arrives
- Far
western Alberta and the southeastern Prairies may be wettest next week - Southeastern
Canada corn and soybean production areas will experience a good mix of weather during the next ten days, although several days of drying and rising temperatures are expected from this weekend into next week
o
Soil moisture will become depleted in some areas and extreme temperatures may impact a part of the region briefly
o
Good wheat harvest conditions are expected as the region becomes drier
- Northwestern
India and central and southern Pakistan will continue dry biased for the next ten days with some rain possible after Aug. 20
o
Gujarat, western and northern Rajasthan, Haryana , Punjab and the middle and southern parts of Pakistan will be left driest leading to stress for most unirrigated crops
- Southeast
Asia nations will all receive sufficient rain to support crops during the next two weeks
o
The forecast includes an improving rain distribution for Sumatra, Java, Kalimantan, Thailand and the central and southern Philippines all of which have been trending a little too dry recently
- East-central
Africa rainfall in this coming week will continue abundant in Ethiopia and a routine occurrence of rain will also occur in Kenya and Uganda - West
Central Africa weather will be seasonable over the next two weeks
o
Rain fell significantly Tuesday in central and northern Ivory Coast benefiting some coffee and cocoa production areas
o
Rain will continue to fall periodically over the next couple of weeks, although the lightest rainfall will be in southern Ivory Coast and Ghana
- Australia
weather will continue favorably for wheat, barley and canola which are semi-dormant at this time of year. Soil moisture is favorable and ready to support spring growth when warming comes along especially if timely rainfall continues a advertised
o
Queensland and northern New South Wales still need significant rain to restore soil moisture after recent drying
- Argentina
will be dry through Monday with some rain possible later next week in the south and east
o
Western parts of the nation will continue dry and will need greater rain prior to spring to protect wheat and barley production potentials and to improve spring planting prospects
- Rain
will occur infrequently in southern Brazil during the next ten days benefiting wheat production areas and possibly improving some moisture for early season corn planting and establishment - South
Africa received some coastal showers in the southwest Wednesday
o
A greater rain event is possible Friday into the weekend that may bring some needed moisture from Western and Eastern Cape into Free State
- Rainfall
will be light, but beneficial to unirrigated wheat areas in particular - Follow
up rain will still be needed - Southern
Oscillation Index has reached +9.58 and it will vary in a narrow range for a while - Mexico
weather will remain wettest in the far west and extreme south for the next ten days
o
Greater rain is needed in the northeast and some east-central areas
o
Crop conditions have improved in recent weeks especially in the west
- Central
America rainfall has been plentiful and will remain that way for the next ten days
o
Some net drying is expected in Honduras and Nicaragua
- New
Zealand rainfall during the coming week will be above average in the coming week while temperatures are a little cooler than usual
Source:
World Weather Inc.
Thursday,
Aug. 12:
- USDA’s
monthly World Agricultural Supply and Demand (WASDE) report, noon - USDA
weekly crop net-export sales for corn, soybeans, wheat, cotton, pork, beef, 8:30am - China
farm ministry’s monthly supply-demand report (CASDE) - New
Zealand Food Prices - Port
of Rouen data on French grain exports - HOLIDAY:
Thailand
Friday,
Aug. 13:
- ICE
Futures Europe weekly commitments of traders report (6:30pm London) - CFTC
commitments of traders weekly report on positions for various U.S. futures and options, 3:30pm - FranceAgriMer
weekly update on crop conditions - EARNINGS:
Olam, Golden Agri
Source:
Bloomberg and FI
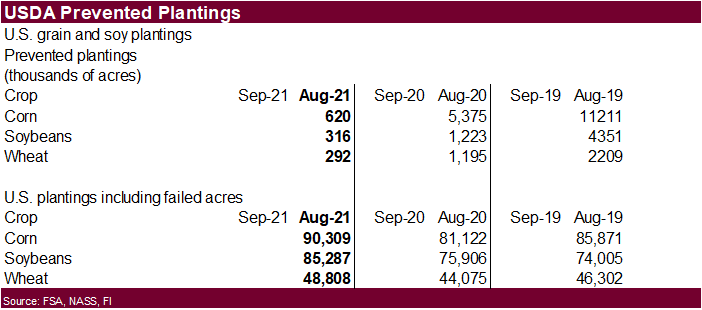
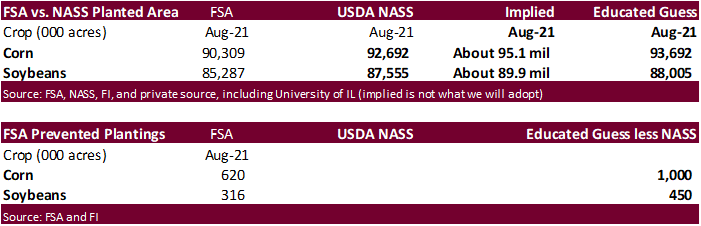
USDA
FSA initial
crop data showed corn at 90,309 million acres, a figure that suggests the corn planted area is above USDA’s NASS acreage estimate released in June. Soybeans of 85,287 million and all‐wheat was 48,808 million (higher than what we would expect). Prevented plantings
were low relative to average for August, but keep in mind initial August FSA data tends to be a poor correlation when predicting changes in planted area in October by USDA/NASS, but for now we think corn and soybeans will end up higher. Wheat area is still
hard to predict as harvesting of the spring wheat is ongoing.
74
Counterparties Take $1087.342 Bln At Fed’s Fixed-Rate Reverse Repo (prev $1000.460 Bln, 70 Bidders)
Indian
CPI (Y/Y) Jul: 5.59% (est 5.72%; prev 6.26%)
Indian
CPI Food Inflation (Y/Y) Jul: 3.96% (prev 5.15%)
US
PPI Final Demand (Y/Y) Jul: 7.8% (est 7.2%; prev 7.3%)
US
PPI Ex Food, Energy (Y/Y) Jul: 6.2% (est 5.6%; prev 5.6%)
US
PPI Ex Food, Energy, Trade (Y/Y) Jul: 6.1% (est 5.7%; prev 5.5%)
US
PPI Final Demand (M/M) Jul: 1.0% (est 0.6%; prev 1.0%)
US
PPI Ex Food, Energy (M/M) Jul: 1.0% (est 0.5%; prev 1.0%)
US
PPI Ex Food, Energy, Trade (M/M) Jul: 0.9% (est 0.5%; prev 0.5%)
US
Initial Jobless Claims Aug 7: 375K (est 375K; prevR 387K; prev 385K)
US
Continuing Claims Jul 31: 2866K (est 2900K; prevR 2980K; prev 2930K)
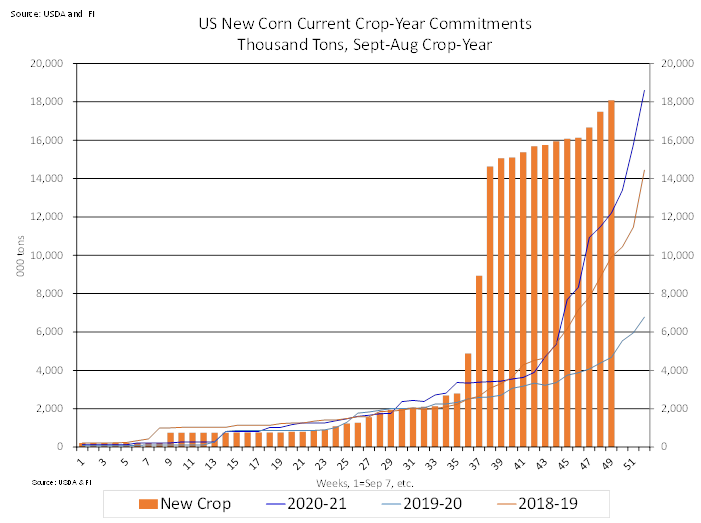
- US
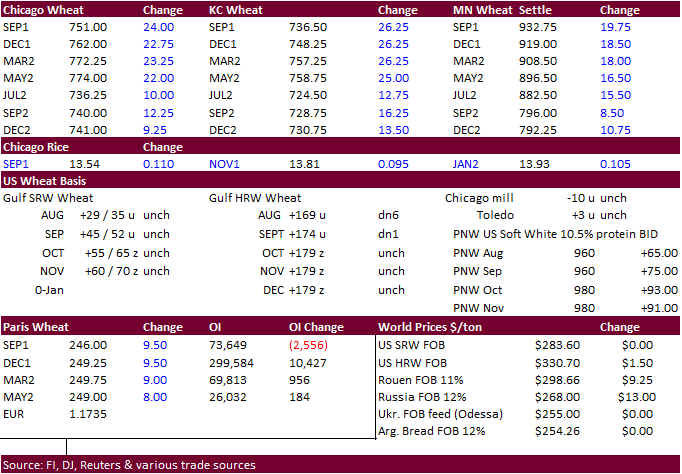
corn futures ended higher on a bullish USDA report calling for tight stocks at the end of the 2021-22 season. US corn export sales were supportive. See USDA recap at the top of this comment. December closed 14.0 cents higher and during the trade closed
a $5.7350 gap. - USDA
FSA prevented plantings indicate a 1+ million-acre higher planted area for the US (see above).
https://www.fsa.usda.gov/news-room/efoia/electronic-reading-room/frequently-requested-information/crop-acreage-data/index
-
Argentina’s
Rosario Exchanged estimated the 2021-22 corn crop at 55 million tons, up from 54 previous. The corn area is expected to increase 6% to 6.83 million hectares for 2020-21.
Export
developments.
- South
Korea’s MFG bought
207,000 tons of corn
all
at an estimated $319.99 a ton c&f.
One
consignment for arrival around Nov. 13 was expected to be sourced from South America or South Africa.
A
second consignment for arrival Nov. 21 was optional
origin.
The third
consignment for arrival around Nov. 10 was
expected to be sourced from South America or South Africa.
All three shipments are sometime in Sep and/or Oct. (Reuters) - North
Cyprus seeks 30,000 tons of animal feed barley and 5,000 tons of corn on Aug. 12. The barley is for shipment in August, September, and October. The corn is sought for August shipment. - Jordan
passed on 120,000 tons of feed barley for Late October through December shipment.
- China
will auction off 36,789 tons of imported Ukrainian corn and 265,667 tons of imported US corn on August 13.
- Qatar
seeks about 100,000 tons of barley on August 18 for Sep-Nov delivery.
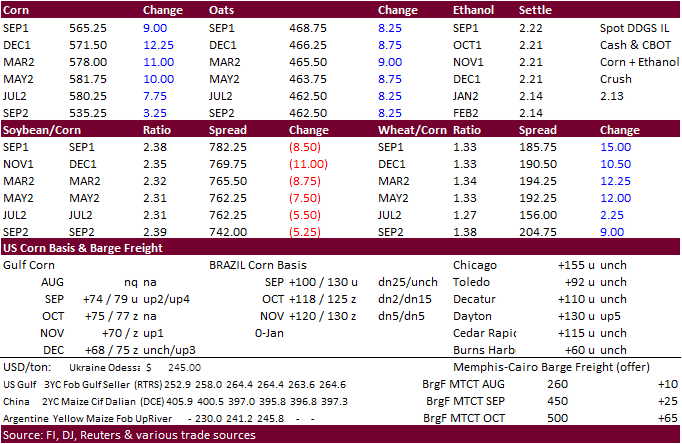
September
corn is seen is a $5.40-$6.00 range. (up 15, unch)
December
corn is seen in a $4.75-$6.00 range
(up 50, unch)
-
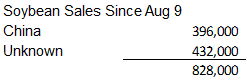
The
soybean complex rocked higher post USDA report but paired most gains late on profit taking and a US weather outlook calling for no major threat to US soybean development for the remainder of August. USDA cut SBO for biofuel demand by a large amount and that
market eventually led to the weakness in soybeans. See USDA section at the top of the comment. Meal ended higher. Some traders are still waiting to see if India will buy large amounts of soybean meal. Some think logistically it will be hard to secure additional
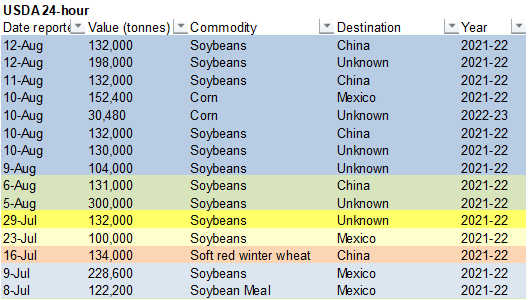
SA supplies through at least September. USDA announced additional soybean sales to China and unknown (table below and after export developments section). 828,000 tons of soybean have been sold since Aug 9 .
-
Decatur
IL soybean basis was down 35 to 40 over the November. -
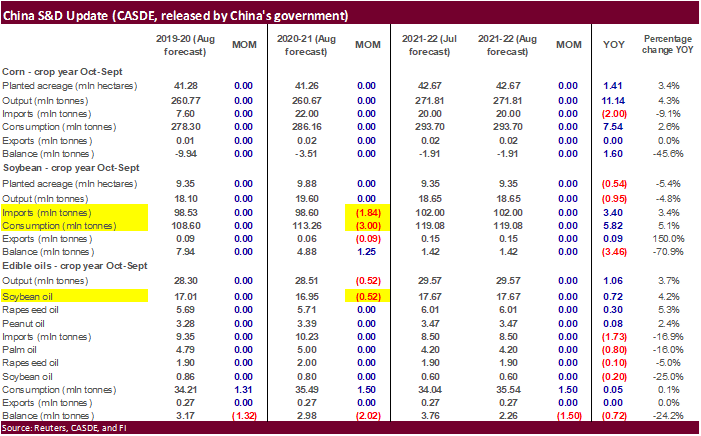
In
its monthly CASDE report, China lowered its estimates of soybean imports for 2020-21 by 1.84 million tons to 98.6 million, due to falling crush since July amid poor crush margins. They lowered edible oils output by 520,000 tons, to 28.51 million tons for
2020-21. -
China’s
State Council Information Office noted China grain production reached 669 million tons, up from 113 million tons in 1949.
-
There
were no CBOT soybean complex deliveries posted and 37 soybean oil registrations cancelled out of Volga and Emmetsburg. SBO registrations are now 298 versus 668 at the end of June.
-
Argentina’s
Rosario Exchanged estimated the 2021-22 soybean crop at 49 million tons, up from 45 million for 2020-21. The soybean planted area was expected to fall for the sixth straight season, to 16.4 million hectares, a 3% decrease from 2020.
-
Cargo
surveyor SGS reported Aug 1-10 Malaysian palm exports at 423,888 tons, 16,991 tons above the same period a month ago or up 4.2%, and 51,821 tons above the same period a year ago or up 13.9%. This contradicts AmSpec that reported a 10.3 decrease and
ITS
that reported a 13% decrease. -
Malaysia
palm oil futures eased 37 ringgit after surging more than 7 percent yesterday, and cash was down $10/ton to $1,125/ton.
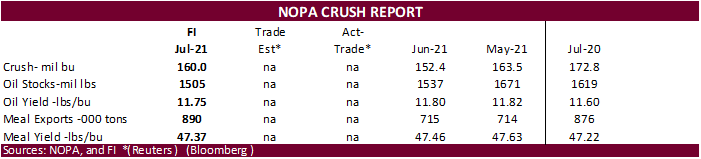
- NOPA
will report July US crush and end of month soybean oil stocks on Monday. We are at 160.0 million bushels for the soybean crush and 1.505 billion for stocks, compared to 152.4 million during June and 1.537 billion stocks previous month. For other trade guesses,
we heard as high as 162 and low as 158, and stocks below 1.450 billion. -
Note
the Pro Farmer crop tour starts Tuesday, Aug 17, lasting until Friday the 20th.
Export
Developments
- Under
the 24-hour USDA announcement system, private exporters sold 132,000 tons of soybean to China for 2021-22 delivery, and 198,000 tons to unknown.
- USDA
On August 17 seeks 290,000 tons of veg oil for use in export programs. 210 tons in 4-liter cans and 80 tons in 4-liter cans or plastic bottles, for shipment Sep16 to Oct 15 (Oct 1-31 for plants at ports).
- South
Korea’s Agro-Fisheries & Food Trade Corp. seeks 3,700 tons of non-GMO soybeans on August 19 for arrival between Oct. 20 and Nov. 19.
Updated
8/12/21
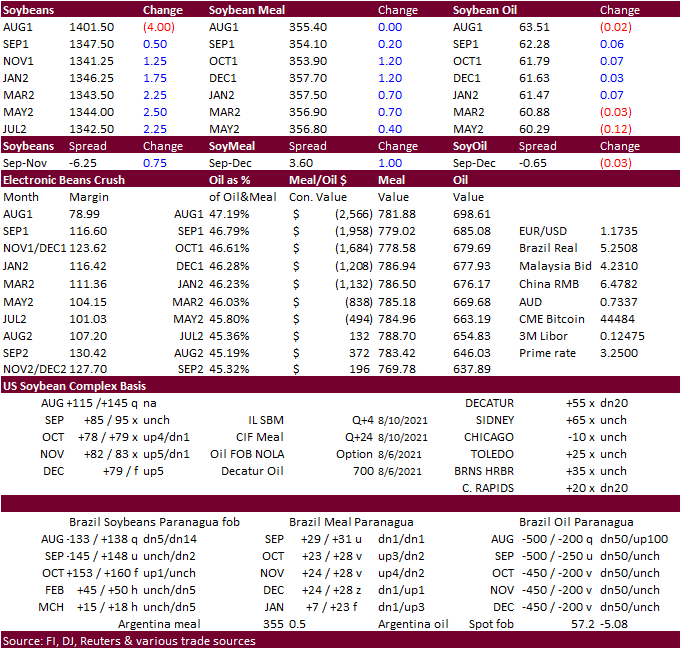
September
soybeans are seen in a $12.75-$14.50 range; November $11.75-$15.00
September
soybean meal – $335-$370; December $320-$425
September
soybean oil – 60.00-65.00; December 48-67 cent range
- US
wheat ended sharply higher on French wheat crop concerns and a large downward revision to world production and stocks. Russia, Canada, and US wheat production were downward revised by USDA.
-
Argentina’s
Rosario Exchanged lowered the wheat crop for 2021-22 by 400,000 tons to 20.1 million.
- Paris
December wheat settled 9.50 higher or up nearly 4%, at 248.75, a fresh contract high.
- Soufflet
noted the French soft wheat and durum wheat crops were showing weak quality after the wet end to the growing season.
- Reuters
via CPC: “U.S. WEATHER FORECASTER CPC: ENSO-NEUTRAL IS FAVORED FOR THE REMAINDER OF SUMMER (~60% CHANCE IN THE JULY-SEPTEMBER SEASON), WITH LA NIÑA POSSIBLY EMERGING DURING THE AUGUST-OCTOBER SEASON”
- Thailand
may have passed on 139,500 tons of feed wheat for OND shipment. Lowest
price offer was believed to be around $337 a ton c&f. - Japan
(SBS) seeks 80,000 tons of feed wheat and 100,000 tons of feed barley on August 18 for loading by November 30.
- Bangladesh
seeks 50,000 tons of wheat on August 18. - Morocco
seeks 363,000 tons of US durum wheat under a tariff import quota on August 24 for shipment by December 31.
- Pakistan
seeks 400,000 tons of wheat on August 23 for Sep/Oct shipment.
Rice/Other
- South
Korea’s Agro-Fisheries
& Food Trade Corp. bought
22,222 tons of rice from the US at
an estimated $1,224.54 a ton c&f. Medium grain, non-glutinous brown rice of U.S. grade 3 was bought for arrival in South Korea around March 31, 2022.
No
purchase was reported of a second consignment of 17,004 tons of U.S. rice also sought in the tender.
(Reuters) - (Bloomberg)
— U.S. 2021-22 cotton production seen at 18.15m bales, 346,000 bales above USDA’s previous est., according to the avg in a Bloomberg survey of 11 analysts.
Estimates
range from 17.6m to 19.4m bales
U.S.
ending stocks seen at 3.5m bales vs 3.3m in July
Global
ending stocks seen 402,000 bales higher at 88.14m bales
Updated 8/12/21
September Chicago wheat is seen in a $6.75‐$7.75 range (up 25 cents)
September KC wheat is seen in a $6.50‐$7.70 (up 25, up 35)
September MN wheat is seen in a $8.50‐$9.75
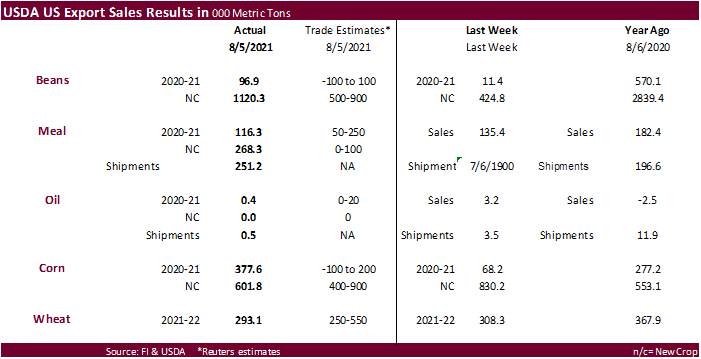
USDA export sales
US soybean export sales were good for soybean meal, new-crop soybeans, and old-crop corn. Old-crop corn sales included late reporting net sales totaling 222,300 tons, including China for 71,500 tons. New-crop corn sales were 601,800 tons,
within expectations. Soybean old-crop sales were 96,900 tons included China for 84,500 tons. New-crop soybean sales of 1.120 million tons (MT) included unknown destinations (643,400 MT, including 6,800MT – late) and China (328,000 MT). Soybean meal sales
were good with 116,300 tons old crop and 268,200 tons new-crop. Meal shipments were 251,200 tons. Soybean oil sales were minimal. All-wheat sales of 293,100 tons were within trade expectations but below a 4-week average.
U.S. EXPORT SALES FOR WEEK ENDING 8/5/21
FAX 202-690-3275
|
|
CURRENT MARKETING YEAR |
NEXT MARKETING YEAR |
||||||
|
COMMODITY |
NET SALES |
OUTSTANDING SALES |
WEEKLY EXPORTS |
ACCUMULATED EXPORTS |
NET SALES |
OUTSTANDING SALES |
||
|
CURRENT YEAR |
YEAR |
CURRENT YEAR |
YEAR |
|||||
|
WHEAT |
THOUSAND METRIC TONS |
|||||||
|
HRW |
173.8 |
1,625.1 |
1,558.3 |
285.0 |
1,403.4 |
2,263.0 |
0.0 |
0.0 |
|
SRW |
21.1 |
1,003.8 |
678.3 |
71.5 |
549.4 |
351.0 |
0.0 |
0.0 |
|
HRS |
97.1 |
1,442.9 |
1,853.0 |
91.9 |
1,057.8 |
1,325.0 |
0.0 |
0.0 |
|
WHITE |
0.6 |
881.4 |
1,318.2 |
179.1 |
690.9 |
748.0 |
0.0 |
0.0 |
|
DURUM |
0.5 |
8.4 |
187.0 |
0.5 |
42.2 |
209.3 |
0.0 |
0.0 |
|
TOTAL |
293.1 |
4,961.6 |
5,594.9 |
627.9 |
3,743.7 |
4,896.3 |
0.0 |
0.0 |
|
BARLEY |
0.0 |
22.7 |
31.4 |
0.0 |
2.3 |
7.8 |
0.0 |
0.0 |
|
CORN |
377.6 |
5,518.2 |
4,137.9 |
1,060.0 |
64,582.9 |
40,021.9 |
601.8 |
18,088.7 |
|
SORGHUM |
6.6 |
527.5 |
342.2 |
72.3 |
6,662.1 |
4,291.5 |
0.0 |
1,594.9 |
|
SOYBEANS |
96.9 |
2,571.7 |
6,445.9 |
129.7 |
59,445.4 |
40,996.9 |
1,120.3 |
11,722.8 |
|
SOY MEAL |
116.3 |
1,726.7 |
1,652.0 |
251.2 |
10,201.8 |
10,305.5 |
268.3 |
1,417.4 |
|
SOY OIL |
0.3 |
17.4 |
177.7 |
0.5 |
665.5 |
1,089.2 |
0.0 |
0.6 |
|
RICE |
|
|
|
|
|
|
|
|
|
L G RGH |
25.4 |
203.8 |
164.8 |
0.0 |
0.0 |
4.4 |
0.0 |
0.0 |
|
M S RGH |
0.0 |
9.2 |
28.2 |
0.0 |
0.0 |
0.7 |
0.0 |
0.0 |
|
L G BRN |
0.1 |
11.9 |
8.9 |
0.3 |
0.3 |
0.7 |
0.0 |
0.0 |
|
M&S BR |
0.1 |
0.2 |
30.9 |
0.0 |
0.0 |
0.9 |
0.0 |
0.0 |
|
L G MLD |
38.7 |
215.4 |
38.7 |
1.5 |
1.5 |
3.4 |
0.0 |
0.0 |
|
M S MLD |
2.8 |
77.4 |
65.9 |
2.8 |
2.8 |
4.5 |
2.1 |
2.1 |
|
TOTAL |
67.1 |
517.8 |
337.2 |
4.6 |
4.6 |
14.7 |
2.1 |
2.1 |
|
COTTON |
|
THOUSAND RUNNING BALES |
|
|||||
|
UPLAND |
342.7 |
4,785.8 |
6,288.5 |
190.6 |
190.6 |
278.6 |
15.3 |
516.1 |
|
PIMA |
10.2 |
106.0 |
172.9 |
7.7 |
7.7 |
5.6 |
0.0 |
0.0 |
|
FINAL 2020/21 MARKETING YEAR |
||||
|
COMMODITY |
NET SALES |
CARRYOVER
SALES 1/ |
7/31/21
EXPORTS |
ACCUMULATED
EXPORTS |
|
PIMA |
0.0 |
88.8 |
3.1 |
754.9 |
|
COTTON |
|
|
|
|
|
UPLAND |
-13.4 |
1,310.9 |
49.1 |
14,882.1 |
|
RICE |
|
|
|
|
|
L G RGH |
0.4 |
128.1 |
37.2 |
1,679.9 |
|
M S RGH |
0.0 |
2.2 |
0.1 |
30.6 |
|
L G BRN |
0.0 |
11.3 |
0.0 |
40.5 |
|
M&S BR |
0.1 |
0.1 |
0.1 |
157.1 |
|
L G MLD |
0.3 |
30.8 |
0.7 |
654.5 |
|
M S MLD |
1.6 |
64.7 |
1.8 |
633.4 |
|
TOTAL |
2.5 |
237.2 |
39.8 |
3,195.9 |
This
summary is based on reports from exporters for the period July 30-August 5, 2021.
Wheat: Net
sales of 293,100 metric tons (MT) for 2021/2022 were down 5 percent from the previous week and 32 percent from the prior 4-week average. Increases primarily for unknown destinations (98,600 MT, including 82,600 MT – late), Japan (34,300 MT, including decreases
of 700 MT and 500 MT – late), Nigeria (31,800 MT), Venezuela (27,100 MT – late), and Chile (21,500 MT), were offset by reductions primarily for the Dominican Republic (17,400 MT) and Guatemala (5,000 MT). Exports of 627,900 MT–a marketing-year high–were
up 62 percent from the previous week and 60 percent from the prior 4-week average. The destinations were primarily to Japan (130,400 MT, including 500 MT – late), Mexico (89,600 MT), Nigeria (82,300 MT), China (64,700 MT), and South Korea (62,800 MT).
Late
Reporting: For
2020/2021, net sales totaling 123,800 MT of wheat were reported late for unknown destinations (82,600 MT), Venezuela (27,100 MT), Haiti (11,500 MT),
Leeward and Windward Islands (2,200 MT), and Japan (500 MT). Exports totaling 41,300 MT of wheat were reported late to Venezuela (27,100 MT), Haiti (11,500 MT), Leeward and Windward Islands (2,200 MT), and Japan (500 MT).
Corn:
Net sales of 377,600 MT for 2020/2021 were up noticeably from the previous week and from the prior 4-week average. Increases primarily for Mexico (144,500 MT, including decreases of 38,500 MT), Japan (80,500 MT, including 81,700 MT switched from unknown destinations
and decreases of 1,200 MT), Venezuela (59,200 MT, including 39,200 MT – late), Colombia (54,800 MT, including 21,000 MT switched from unknown destinations and 31,700 MT – late), and Canada (45,700 MT, including decreases of 8,900 MT), were offset by reductions
primarily for unknown destinations (76,800 MT) and the Dominican Republic (7,500 MT). For 2021/2022, net sales of 601,800 MT were primarily for unknown destinations (278,400 MT, including 20,400 MT – late), Colombia (80,500 MT), Costa Rica (60,800 MT), Mexico
(52,200 MT), and Japan (45,000 MT). Exports of 1,060,000 MT were down 25 percent from the previous week and 12 percent from the prior 4-week average. The destinations were primarily to China (352,600 MT, including 71,500 MT – late), Mexico (337,300 MT, including
9,700 MT – late), Japan (80,500 MT), Saudi Arabia (57,900 MT), and Colombia (54,800 MT, including 31,700 MT – late).
Optional
Origin Sales:
For 2020/2021, the current outstanding balance of 30,500 MT is for unknown destinations. For 2021/2022, the current outstanding balance of 50,000 MT is for unknown destinations.
Late
Reporting: For
2020/2021, net sales totaling 222,300 MT of corn were reported late for China (71,500 MT), Venezuela (39,200 MT), Colombia (31,700 MT), unknown destinations (25,900 MT), Guyana (22,800 MT), Trinidad and Tobago (19,900 MT), Suriname (4,000 MT), Jamaica (3,300
MT), Haiti (2,100 MT), and Leeward and Windward Islands (1,900 MT). For 2021/2022, net sales totaling 20,400 MT of corn were reported late for unknown destinations. Exports totaling 206,200 MT of corn were reported late to China (71,500 MT), Venezuela (39,200
MT), Colombia (31,700 MT), Guyana (22,800 MT), Trinidad and Tobago (19,900 MT), Mexico (9,700 MT), Suriname (4,000 MT), Jamaica (3,300 MT), Haiti (2,100 MT), and Leeward and Windward Islands (1,900 MT).
Barley:
No net sales or exports were reported for the week.
Sorghum:
Net sales of 6,600 MT for 2020/2021 were reported for China (5,600 MT) and Mexico (1,000 MT). Exports of 72,300 MT were up 37 percent from the previous week and 14 percent from the prior 4-week average. The destination was primarily to China (70,600 MT).
Rice:
Net
sales of 67,100 MT were reported for 2021/2022, which began August 1. Increases were primarily for Haiti (37,800 MT), Mexico (20,900 MT), Guatemala (4,500 MT), Canada (1,800 MT), and the Dominican Republic (700 MT).
Total net sales for 2022/2023, of 2,100 MT were for Japan. A total of 237,200 MT in sales were outstanding on July 31 and carried over to 2021/2022. Accumulated exports in 2021/2022 totaled 3,195,900 MT were up 2 percent from the
prior year’s total of 3,135,500 MT. The primary destinations were to Mexico (31,600 MT), El Salvador (5,900 MT), Canada (900 MT), Jordan (300 MT), and Belgium (200 MT). Exports for August 1 totaled 4,600 MT, with Canada (1,300 MT), Saudi Arabia (1,000 MT),
Japan (800 MT), Jordan (700 MT), and Haiti (300 MT) being the primary destinations.
Exports
for Own Account:
For 2021/2022, the current exports for own account outstanding balance is 100 MT, all Canada.
Soybeans:
Net sales of 96,900 MT for 2020/2021 were up noticeably from the previous week and from the prior 4-week average. Increases primarily for China (84,500 MT), Japan (18,600 MT, including 18,300 MT switched from unknown destinations and decreases of 1,300 MT),
Colombia (15,300 MT, including 9,000 MT switched from unknown destinations and decreases of 7,000 MT), Indonesia (6,000 MT, including decreases of 1,500 MT), and Taiwan (4,500 MT, including decreases of 1,600 MT), were offset by reductions primarily for unknown
destinations (30,000 MT). For 2021/2022, net sales of 1,120,300 MT primarily for unknown destinations (643,400 MT, including 6,800 MT – late), China (328,000 MT), Taiwan (79,500 MT), Turkey (60,000 MT), and Portugal (15,000 MT), were offset by reductions
for Japan (18,900 MT) and Colombia (13,000 MT). Exports of 129,700 MT–a marketing-year low–were down 40 percent from the previous week and 37 percent from the prior 4-week average. The destinations were primarily to Mexico (39,000 MT), Canada (22,500 MT),
Japan (21,300 MT), Indonesia (13,600 MT), and Saudi Arabia (9,900 MT).
Exports
for Own Account:
For 2020/2021, the current exports for own account outstanding balance is 5,800 MT, all Canada.
Late
Reporting:
For 2020/2021, net sales and exports totaling 4,300 MT of soybeans were reported late for Venezuela. For 2021/2022, net sales totaling 6,800 MT of soybeans were reported late for unknown destinations.
Soybean
Cake and Meal:
Net sales of 116,300 MT for 2020/2021 were down 14 percent from the previous week, but up 29 percent from the prior 4-week average. Increases primarily for Venezuela (20,600 MT, including 10,600 MT – late), Guyana (17,900 MT – late), Trinidad (13,000 MT,
including 9,400 MT – late), Colombia (11,600 MT, including decreases of 11,600 MT), and the Philippines (9,900 MT), were offset by reductions primarily for Costa Rica (900 MT) and Ecuador (400 MT).
For 2021/2022, net sales of 268,300 MT were primarily for the Philippines (89,000 MT), Canada (79,900 MT), Colombia (75,000 MT), unknown destinations (11,800 MT), and Panama (6,300 MT). Exports of 251,200 MT were up 33 percent from
the previous week and 21 percent from the prior 4-week average. The destinations were primarily to the Philippines (99,100 MT), the Dominican Republic (20,600 MT), Guyana (17,900 MT – late), Canada (17,500 MT), and Colombia (14,200 MT).
Late
Reporting: For
2020/2021, net sales totaling 47,700 MT of soybean cake and meal were reported late for Guyana (17,900 MT), Venezuela (10,600 MT), Trinidad and Tobago (9,400 MT), unknown destinations (7,400 MT),
Leeward and Windward Islands (1,100 MT), Haiti (700 MT), and Suriname (500 MT). Exports totaling 40,300 MT of soybean cake and meal were reported late to Guyana (17,900 MT), Venezuela (10,600 MT), Trinidad and Tobago (9,400 MT),
Leeward and Windward Islands (1,100 MT), Haiti (700 MT), and Suriname (500 MT).
Soybean
Oil:
Total net sales for 2020/2021, of 300 MT were down 89 percent from the previous week and 73 percent from the prior 4-week average. The destination was for Canada. Exports of 500 MT were down 86 percent from the previous week and 77 percent from the prior
4-week average. The destination was to Canada.
Cotton:
Net sales for 2021/2022, which began August 1, totaled 342,700 RB. Increases primarily for China (123,800 RB), Turkey (72,500 RB), Bangladesh (39,400 RB, including decreases of 200 RB), Pakistan (39,100 RB, including decreases of 700 RB), and Vietnam (30,500
RB, including 300 RB switched from Japan and decreases of 2,300 RB), were offset by reductions for Taiwan (200 RB). For 2022/2023, net sales of 15,300 MT were reported for Mexico (6,500 RB), Turkey (4,400 RB), and South Korea (4,400 RB). A total of 1,310,900
RB in sales were carried over from the 2020/2021 marketing year, which ended July 31. Exports for the period ending July 31 of 49,100 RB brought accumulated exports to 14,882,100 RB, up 5 percent from the prior years’ total of 14,174,500 RB. The destinations
were primarily Mexico (10,900 RB), Pakistan (8,000 RB), Turkey (6,700 RB), Vietnam (6,400 RB), and Indonesia (5,900 RB). Exports for August 1-5 totaled 190,600 RB, with Pakistan (38,900 RB), Vietnam (36,500 RB), China (30,100 RB), Turkey (23,700 RB), and
Mexico (14,000 RB) being the primary destinations. Net sales of Pima for 2021/2022 totaled 10,200 RB. Increases were primarily for Pakistan (3,400 RB), India (2,600 RB), Honduras (2,200 RB), Egypt (1,300 RB), and Guatemala (400 RB). For 2022/2023, net sales
of 99,000 RB were primarily for India (52,100 RB), Peru (11,400 RB), Pakistan (10,100 RB), China (9,500 RB), and Honduras (4,400 RB). A total of 88,800 RB in sales were carried over from the 2020/2021 marketing year, which ended July 31. Exports for the
period ending July 31 of 3,100 RB brought accumulated exports to 754,900 RB, up 55 percent from the prior years’ total of 486,600 RB. The destinations were primarily Turkey (1,400 RB), India (500 RB), Bangladesh (400 RB), China (400 RB), and Pakistan (200
RB). Exports for August 1-5 totaled 7,700 RB, with Peru (2,500 RB), India (2,100 RB), Pakistan (1,800 RB), China (700 RB), and Bangladesh (300 RB) being the primary destinations.
Exports
for Own Account:
For 2021/2022, exports for own account total of 4,700 RB were carried over from the 2020/2021 marketing year, which ended July 31. The outstanding balance of 4,700 RB, including carryover, is for China.
Hides
and Skins:
Net sales of 328,400 pieces for 2021 were up 24 percent from the previous week, but down 3 percent from the prior 4-week average. Increases primarily for China (224,300 whole cattle hides, including decreases of 4,300 pieces), Mexico (49,400 whole cattle
hides, including decreases of 600 pieces), South Korea (21,800 whole cattle hides, including decreases of 2,400 pieces), Japan (11,300 whole cattle hides, including decreases of 200 pieces), and Brazil (8,100 whole cattle hides, including decreases of 300
pieces), were offset by reductions primarily to Vietnam (1,700 whole cattle hides). Exports of 416,800 pieces were up 26 percent from the previous week and 9 percent from the prior 4-week average. Whole cattle hides exports were primarily to China (288,300
pieces), South Korea (58,100 pieces), Taiwan (16,400 pieces), Mexico (16,100 pieces), and Thailand (15,200 pieces).
Net
sales of 135,700 wet blues for 2021 were up noticeably from the previous week, but down 15 percent from the prior 4-week average. Increases primarily for China (106,500 unsplit), Vietnam (22,400 unsplit), Thailand (5,300 unsplit, including decreases of 700
unsplit), Mexico (900 unsplit), and Brazil (800 unsplit), were offset by reductions for Italy (100 unsplit). Exports of 161,700 wet blues were up noticeably from the previous week and up 20 percent from the prior 4-week average. The destinations were to
China (58,800 unsplit), Italy (37,200 unsplit and 11,000 grain splits), Vietnam (29,000 unsplit), Thailand (14,000 unsplit), and Taiwan (9,800 unsplit). Net sales of 121,000 splits resulting in increases for Taiwan (125,100 pounds, including decreases of
900 pounds), were offset by reductions for China (4,100 pounds). Exports of 452,000 pounds were to Vietnam (320,000 pounds), China (89,900 pounds), and Taiwan (42,100 pounds).
Beef:
Net
sales of 13,600 MT reported for 2021 were down 9 percent from the previous week and 24 percent from the prior 4-week average. Increases were primarily for Japan (6,000 MT, including decreases of 700 MT), South Korea (2,500 MT, including decreases of 800 MT),
Mexico (1,900 MT, including decreases of 100 MT), China (1,000 MT, including decreases of 100 MT), and Taiwan (700 MT, including decreases of 100 MT). Exports of 18,600 MT were down 9 percent from the previous week and 3 percent from the prior 4-week average.
The destinations were primarily to South Korea (6,000 MT), Japan (4,400 MT), China (3,100 MT), Taiwan (1,500 MT), and Mexico (1,200 MT).
Pork:
Net
sales of 14,600 MT reported for 2021 were down 62 percent from the previous week and 48 percent from the prior 4-week average. Increases primarily for Mexico (5,300 MT, including decreases of 700 MT), Japan (5,200 MT, including decreases of 1,400 MT), South
Korea (2,000 MT, including decreases of 100 MT), China (600 MT, including decreases of 300 MT), and Canada (600 MT, including decreases of 500 MT), were offset by reductions for Australia (1,000 MT). Exports of 27,600 MT were down 3 percent from the previous
week and from the prior 4-week average. The destinations were primarily to Mexico (12,600 MT), China (5,200 MT), Japan (3,800 MT), Canada (1,700 MT), and South Korea (1,500 MT).
NOTE:
“Late” reporting is included in the U.S. Weekly Export Sales Report: 1) Whenever an exporter discovers an error or is advised by the Export Sales Reporting office of an error on a prior report, the error shall be corrected in the current weekly export sales
report to reflect the proper outstanding export sales and exports; and 2) When new exporters register, their first submission includes all export sales and exports in the current marketing year for the specific commodity.
Terry Reilly
Senior Commodity Analyst – Grain and Oilseeds
Futures International
One Lincoln Center
18 W 140 Butterfield Rd.
Oakbrook Terrace, Il. 60181
W: 312.604.1366
ICE IM:
treilly1
Skype: fi.treilly

Trading of futures, options, swaps and other derivatives is risky and is not suitable for all persons. All of these investment products are leveraged, and you can lose more than your initial deposit. Each investment product is offered
only to and from jurisdictions where solicitation and sale are lawful, and in accordance with applicable laws and regulations in such jurisdiction. The information provided here should not be relied upon as a substitute for independent research before making
your investment decisions. Futures International, LLC is merely providing this information for your general information and the information does not take into account any particular individual’s investment objectives, financial situation, or needs. All investors
should obtain advice based on their unique situation before making any investment decision. The contents of this communication and any attachments are for informational purposes only and under no circumstances should they be construed as an offer to buy or
sell, or a solicitation to buy or sell any future, option, swap or other derivative. The sources for the information and any opinions in this communication are believed to be reliable, but Futures International, LLC does not warrant or guarantee the accuracy
of such information or opinions. Futures International, LLC and its principals and employees may take positions different from any positions described in this communication. Past results are not necessarily indicative of future results.