PDF attached
Soybeans:
Down 2-4
Soybean
meal: Steady to $1.50 lower
Soybean
oil: 10-20 points higher
Corn:
unchanged to 2 lower
Chicago
wheat: 1-3 lower
KC
wheat: 2-4 lower
Minn
wheat: 3-5 lower
We
updated our price trading ranges
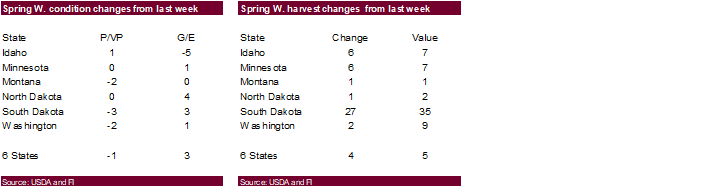
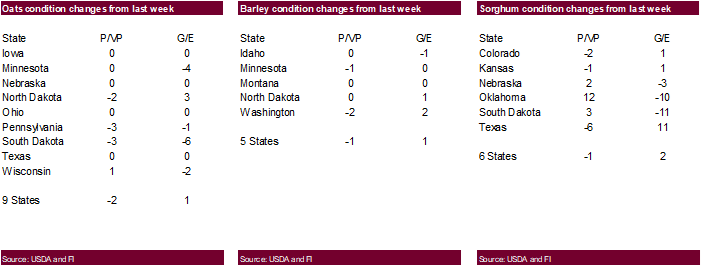
US
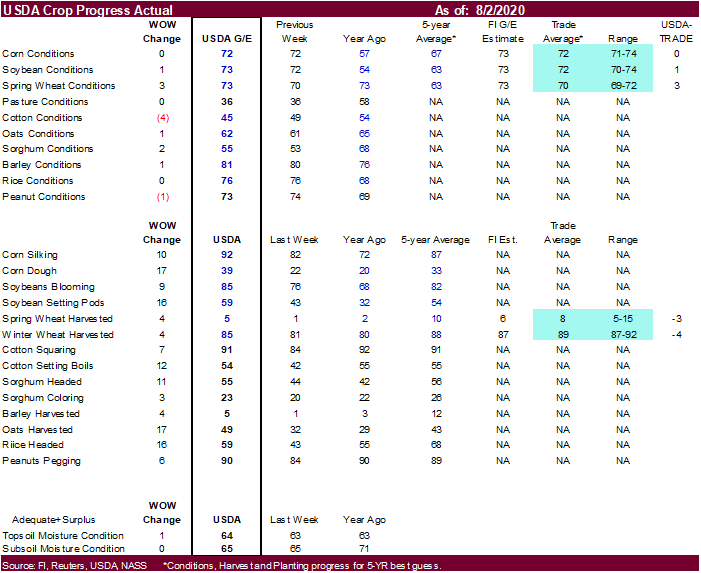
soybean crop ratings increased one point (trade looking for unchanged) to 73. Corn was unchanged, as expected. Spring wheat conditions increased 3 points to 73 (trade was unch.). US wheat harvesting progress fell below trade expectations. This morning
USDA reported 260,000 tons of soybeans to unknown.
7
Day Precipitation Outlook
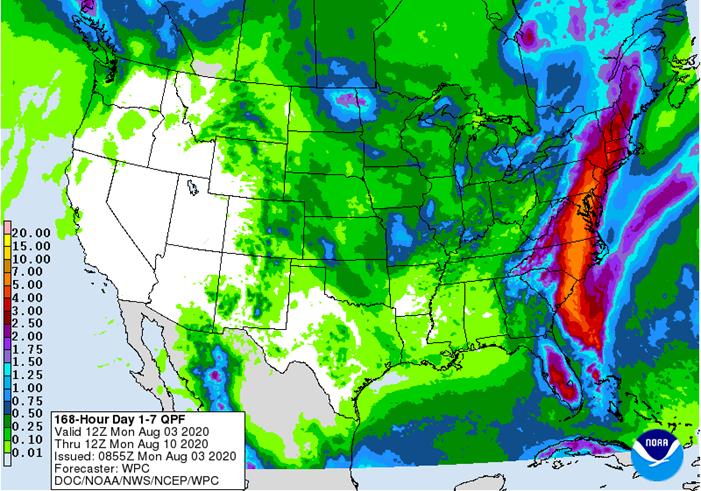
MARKET
WEATHER MENTALITY FOR CORN AND SOYBEANS: U.S. weather is expected to be mostly favorable as it should continue to be in India and China.
Net
drying will occur in parts of Canada’s Prairies for a while this week into next week which may stress a few crops like those of the northwestern Plains. Crop conditions are improving in Mexico and still look good for Australia with significant rain coming
soon to that nation.
Early
season corn planting will advance quickly in Brazil, but rain is needed to improve soil moisture for emergence and establishment. Dryness and some excessive heat will be a concern for summer coarse grain and oilseed crops in parts of western and southeastern
Europe as well as eastern Ukraine into Russia’s Southern Region. Dryness will also continue in some of the sunseed areas of Russia’s eastern New Lands.
Some
concern over net drying will also continue in oil palm production areas of Indonesia.
Overall,
weather today will likely produce a mixed influence on market mentality with a bearish bias remaining.
MARKET
WEATHER MENTALITY FOR WHEAT: Most of the damage done to this year’s spring cereals has already been done and no further change of great significance is expected unless the harvest season turns wet. Some lower production is expected from Russia and Europe
due to dryness in the New Lands and in various areas in northwestern and far southeastern Europe. China’s spring wheat has performed well. Australia’s winter crops will benefit greatly from rain coming over the next two weeks and some ongoing dryness in Canada’s
Prairies may further stress late filling crops. Argentina drought will not change over the next two weeks.
Overall,
weather today will likely leave a neutral to slightly bullish bias to market mentality.
- USDA
weekly corn, soybean, wheat export inspections, 11am - International
Cotton Advisory Committee updates global outlook - ABAG,
Brazil’s agri-business association, hosts annual conference - U.S.
crop conditions for soybeans, corn, cotton; wheat harvesting progress, 4pm - USDA
soybean crush, 3pm - U.S.
DDGS production, corn for ethanol, 3pm - Malaysia
palm oil export data for July 1-31 from AmSpec, SGS - Honduras,
Costa Rica coffee exports for July - EU
weekly grain, oilseed import and export data - Ivory
Coast cocoa arrivals - HOLIDAY:
Canada
TUESDAY,
August 4:
- U.S.
Purdue Agriculture Sentiment - New
Zealand global dairy trade auction - Australia
commodity index
WEDNESDAY,
August 5:
- EIA
U.S. weekly ethanol inventories, production, 10:30am - China’s
CNGOIC to release supply-demand reports on corn, soybeans - French
Agriculture ministry’s 2020 grain estimates - Malaysia’s
palm oil export data for August 1-5 - New
Zealand Commodity Price
THURSDAY,
August 6:
- FAO
World Food Price Index - USDA
weekly crop net-export sales for corn, soybeans, wheat, cotton, pork, beef, 8:30am - Port
of Rouen data on French grain exports
FRIDAY,
August 7:
- China’s
foreign trade data for July, including imports of soybeans and meat - ICE
Futures Europe weekly commitments of traders report, 1:30pm (6:30pm London) - CFTC
commitments of traders weekly report on positions for various U.S. futures and options, 3:30pm - FranceAgriMer
weekly update on crop conditions
Source:
Bloomberg and FI
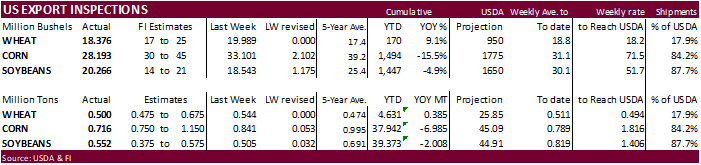
USDA
inspections versus Reuters trade range
Wheat
500,110 versus 450000-675000 range
Corn
716,127 versus 700000-1150000 range
Soybeans
551,543 versus 375000-700000 range
Reuters
headlines for selected Brazil exports:
·
BRAZIL JULY SOYBEAN EXPORTS TOTAL 10.37 MILLION T VERSUS 7.44 MILLION T IN SAME MONTH YEAR AGO – GOVERNMENT DATA
·
BRAZIL JULY CORN EXPORTS TOTAL 4.15 MILLION TNS VERSUS 5.9 MILLION TNS IN SAME MONTH YEAR AGO – GOVERNMENT DATA
·
BRAZIL JULY SUGAR EXPORTS TOTAL 3.48 MILLION TNS VERSUS 1.82 MILLION TNS IN SAME MONTH YEAR AGO – GOVERNMENT DATA
·
BRAZIL JULY COFFEE EXPORTS TOTAL 167,800 TNS VERSUS 175,000 TNS IN THE SAME MONTH A YEAR AGO – GOVERNMENT DATA
·
BRAZIL JULY BEEF EXPORTS TOTAL 169,200 TNS VERSUS 133,200 TNS IN THE SAME MONTH A YEAR AGO – GOVERNMENT DATA
·
BRAZIL JULY CHICKEN EXPORTS TOTAL 337,500 TNS VERSUS 371,800 TNS IN THE SAME MONTH A YEAR AGO – GOVERNMENT DATA
·
BRAZIL JULY PORK EXPORTS TOTAL 90,200 TNS VERSUS 61,480 TNS IN THE SAME MONTH A YEAR AGO – GOVERNMENT DATA
(Reuters)
– U.S.
manufacturing activity
accelerated to its highest level in nearly 1-1/2 years in July as orders increased despite a resurgence in new COVID-19 infections, which is raising fears about the sustainability of a budding economic recovery.
-
Corn
futures ended 1.50 cents higher basis Sep and Dec was up the same amount. The Sep-Dec spread remains wide at 11 cents, Dec premium.
-
Technical
buying was noted after prices hit a one-month low on Friday despite a higher USD.
-
StoneX:
US corn yield and production: 182.4/15.320 billion; soybeans: 54.2/4.496 billion
-
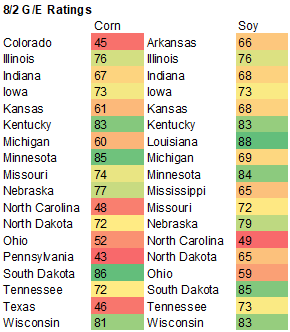
US
corn conditions were unchanged at 72% G/E, at trade expectations, and compare to 57% a year ago. Corn dough 39% vs 22% last week, and 20% a year ago. Corn silking 92% vs 82% last week, and 72% a year ago.
-
US
end users were active in buying US corn but from what we understand, its only in the front months as the CBOT corn carry is wide.
-
US
export business is slow. -
USDA
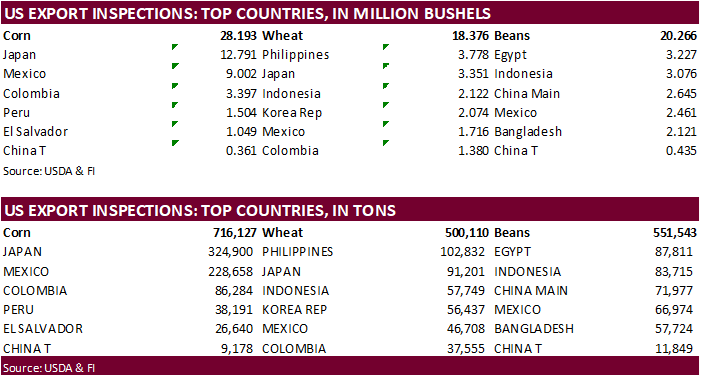
US corn export inspections as of July 30, 2020 were 716,127 tons, within a range of trade expectations, below 840,796 tons previous week and compares to 645,822 tons year ago. Major countries included Japan for 324,900 tons, Mexico for 228,658 tons, and Colombia
for 86,284 tons. -
Australia
reported an outbreak of H7N7 bird flu at a free-range egg farm in the state of Victoria.
Corn
Export Developments
-
None
reported
From
Trade News Service:
- September
corn is seen in a $3.00 and $3.25 range. December lows could reach $2.95 (Updated 8/3). The US is staring down at a large crop.