US
corn and wheat balances attached.
USDA
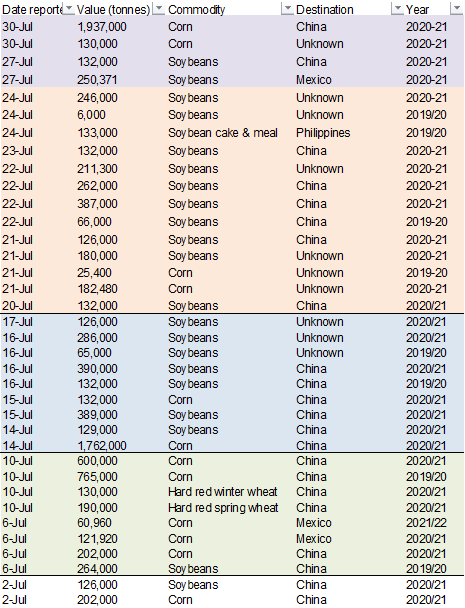
reported 1.937 MMT corn to China and 130,000 corn to unknown.
![]()
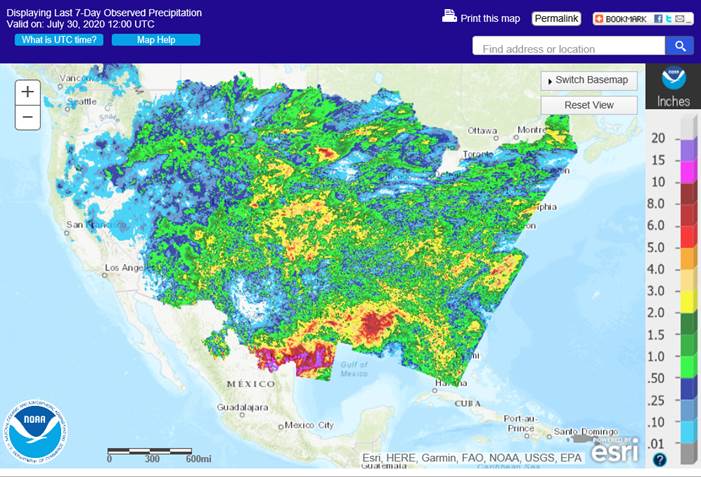
WEATHER
ISSUES OF THE DAY
-
U.S.
crop weather still looks very good (in general) with some pockets of dryness -
The
outlook remains highly favorable for this time of year over the next couple of weeks -
Normal
August weather includes some net drying and that will occur in parts of the Midwest and Delta while the southeastern states will remain wettest -
No
extreme heat is expected in the heart of the Midwest or any crop region in the eastern U.S. during the next two weeks -
West
Texas weather will continue favorably mixed for summer crops and even though the rainfall will be minimal it will help hold the temperatures down and supplement irrigation -
Northern
U.S. Plains will struggle to get enough rain to seriously raise soil moisture and dryness may slowly return to parts of the region -
Canada’s
Prairies are drying out and this trend will continue despite some showers and thunderstorms
-
Parts
of Alberta and northwestern Saskatchewan may be exceptions with sufficient rainfall to maintain favorable soil moisture -
Eastern
parts of the Prairies will be hottest today and many areas will heat up again briefly next week just ahead of another bout cooling and possible rainfall during mid-week
-
Ontario
and Quebec weather is mostly good, but pockets of dryness are expected over the next ten days -
Europe
weather is going to be mixed over the next ten days, but many western areas will continue too dry and may see a couple of waves of heat intermixed at times to accelerate crop moisture stress -
France,
parts of Germany and the southern Balkan Countries have the greatest need for rain -
Western
CIS crop moisture stress remains greatest from southern and eastern Ukraine to western Kazakhstan and parts of Russia’s Southern Region -
Dryness
is also a concern for the central and eastern New Lands -
Not
much relief to dryness is expected in either of these areas -
China
weather will including improving conditions in the flood ravaged Yangtze River Basin over the next two weeks -
Some
heavy rain is expected in northern China and a part of the Korean Peninsula next week resulting in some flooding -
Liaoning,
Hebei, Shandong and both North and South Korea will be most vulnerable to the flooding rainfall -
Two
tropical systems will bring heavy rainfall to southern China in the coming week -
The
first is expected in western Guangdong, Hainan, southern Guangxi and northeastern Vietnam this weekend and the second will be a tropical wave that will bring heavy rain to Fujian and Guangdong next week -
Xinjiang,
China is not likely to change much over the next week to ten days -
Daily
high temperatures will be in the upper 70s and 80s northeast and in the upper 80s and 90s elsewhere followed by lows in the 50s and 60s with a few lower 70s in the southwest -
Rain
is expected in northeastern areas only with Monday, Wednesday and Thursday wettest with daily rainfall of 0.05 to 0.50 inch
-
Dry
conditions will prevail elsewhere -
Australia’s
weather pattern is trending wetter with rain expected in many areas during the late weekend through next week and another system in the following week -
Some
improvement in soil moisture is expected in many wheat, barley and canola production areas -
Argentina
wheat areas may get a little rain during mid-week next week and some brief showers may reach into the drought areas of Cordoba and Santa Fe, but with a limited amount of relief expected -
Southern
Brazil remains favorably moist -
More
rain will fall periodically in far southern Brazil during the next couple of weeks -
Winter
crop conditions are mostly good in Rio Grande do Sul and areas north into Parana, but Sao Paulo and a few other areas have been quite dry recently -
Summer
crop harvest progress has been good -
Conditions
for early season corn planting are looking favorable, but timely rain will need to continue in August to ensure early crops are successful -
Mexico
precipitation in the coming week will be greatest in central and southern parts of the nation benefiting many corn, sorghum and dry bean production areas -
Coffee,
citrus, sugarcane and many fruit and vegetable crops will also benefit -
Northern
Mexico and especially the northeast will trend drier after rain fell beneficially from Tropical Depression Hanna Monday -
Central
America rainfall will be erratic this week and may trend heavier and more widespread next week -
India’s
weather is expected to remain favorable for summer crop development even though some of the rain amounts will be more erratic and lighter than usual
-
Some
net drying is expected -
Central
and northwestern Rajasthan will experience the least amount of rain over the next ten days as will central and southern Pakistan -
Far
southern India and a few locations from Odisha into southern Bangladesh will also receive well below average rainfall -
Southeast
Asia rainfall continued erratic Wednesday with very little change likely through the next couple of weeks -
Parts
of western Thailand, Vietnam and a few areas in Laos and Cambodia have received below average rainfall in recent weeks -
Crop
conditions have not been ideal, although there has been sufficient rain to prevent crop failure -
Greater
rain is needed, though -
This
trend will ease somewhat in the next two weeks with greater rainfall anticipated, but the greatest rainfall is expected to remain pocketed so that some areas will still need greater rain -
Indonesia
rainfall need is greatest for parts of Sumatra and Jav -
Philippines
rainfall recently has been improving and this trend will continue for a while -
Harvest
weather in center west and center south Brazil for Safrinha crops has been and will continue to be good -
South
Africa weather over the next couple of weeks will include limited rainfall and temperatures will trend a little warmer over time.
-
West-central
Africa will receive periods of rain over the next couple of weeks maintaining a favorable environment for “some” coffee, cocoa, cotton, rice and sugarcane -
Greater
rain is needed in Ivory Coast and Ghana where rainfall so far this month has been notably lighter than usual -
Most
of the rain expected this week will continue erratic and often light -
Temperatures
may be a little cooler than usual -
New
Zealand rainfall over the next couple of weeks will be erratic and most often light with temperatures being near normal
Southern
Oscillation Index was +4.92 this morning and the index is expected to slowly fall over the next few days
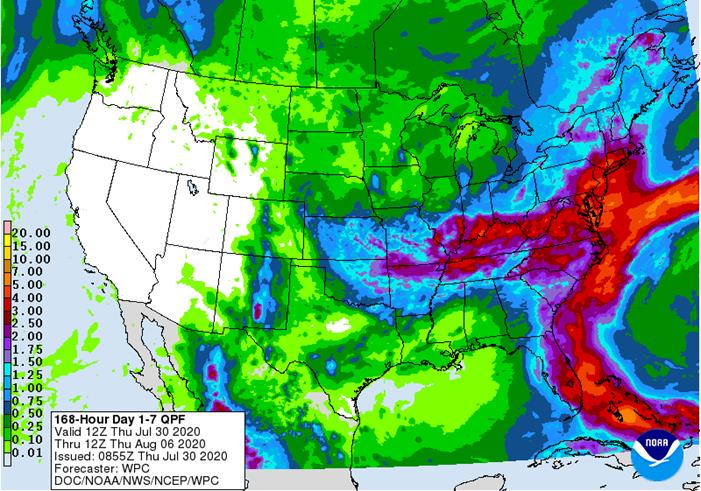
7
Day Precipitation Outlook
- USDA
weekly crop net-export sales for corn, soybeans, wheat, cotton, pork, beef, 8:30am - Port
of Rouen data on French grain exports - The
Australian Grains Industry Conference (online event) - Poland
to publish grain harvest estimates
FRIDAY,
July 31:
- ICE
Futures Europe weekly commitments of traders report, 1:30pm (6:30pm London) - CFTC
commitments of traders weekly report on positions for various U.S. futures and options, 3:30pm - FranceAgriMer
weekly update on crop conditions - Malaysia’s
palm oil export data for July 1-31 (tentative) - U.S.
agricultural prices paid, received, 3pm - HOLIDAY:
Singapore, Indonesia, Malaysia
MONDAY,
August 3:
- USDA
weekly corn, soybean, wheat export inspections, 11am - International
Cotton Advisory Committee updates global outlook - ABAG,
Brazil’s agri-business association, hosts annual conference - U.S.
crop conditions for soybeans, corn, cotton; wheat harvesting progress, 4pm - USDA
soybean crush, 3pm - U.S.
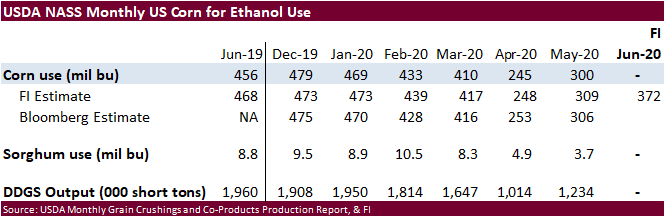
DDGS production, corn for ethanol, 3pm - Malaysia
palm oil export data for July 1-31 from AmSpec, SGS - Honduras,
Costa Rica coffee exports for July - EU
weekly grain, oilseed import and export data - Ivory
Coast cocoa arrivals - HOLIDAY:
Canada
TUESDAY,
August 4:
- U.S.
Purdue Agriculture Sentiment - New
Zealand global dairy trade auction - Australia
commodity index
WEDNESDAY,
August 5:
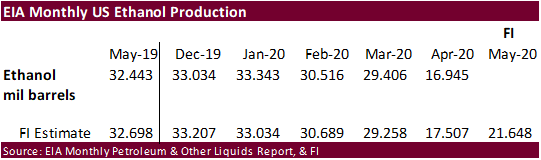
- EIA
U.S. weekly ethanol inventories, production, 10:30am - China’s
CNGOIC to release supply-demand reports on corn, soybeans - French
Agriculture ministry’s 2020 grain estimates - Malaysia’s
palm oil export data for August 1-5 - New
Zealand Commodity Price
THURSDAY,
August 6:
- FAO
World Food Price Index - USDA
weekly crop net-export sales for corn, soybeans, wheat, cotton, pork, beef, 8:30am - Port
of Rouen data on French grain exports
FRIDAY,
August 7:
- China’s
foreign trade data for July, including imports of soybeans and meat - ICE
Futures Europe weekly commitments of traders report, 1:30pm (6:30pm London) - CFTC
commitments of traders weekly report on positions for various U.S. futures and options, 3:30pm - FranceAgriMer
weekly update on crop conditions
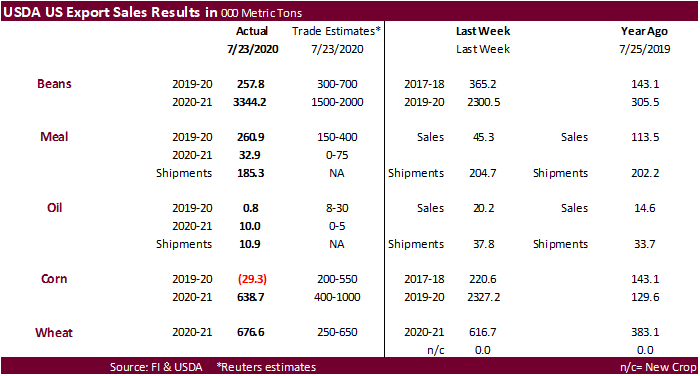
USDA
new-crop soybean export sales
exceeded expectations while old-crop were below. Soybean meal export sales were within trade estimates but shipments were slow. Soybean oil sales were poor along with lackluster shipments. Corn export sales showed net reductions for old crop and new-crop
were 639,000 tons, below expectations. Wheat sales were once again very good.
Sorghum sales were poor for old crop but excellent for new-crop of 163,000 tons. Pork sales were 39,600 tons.
US
GDP Annualized (Q/Q) Q2 A: -32.9% (est -34.5%; prev -5.0%)
US
GDP Personal Consumption Q2 A: -34.6% (est -34.5%; prev -6.8%)
US
Core PCE (Q/Q) Q2 A: -1.1% (est -0.9%; prev 1.7
US
GDP Price Index Q2 A: -1.8% (est -0.1%; prev 1.4%)
US
Initial Jobless Claims Jul 25: 1434K (est 1445K; prevR 1422K; prev 1416K)
US
Continuing Claims Jul 18: 17018K (est 16200K; prevR 16151K; prev 16197K)
-
Corn
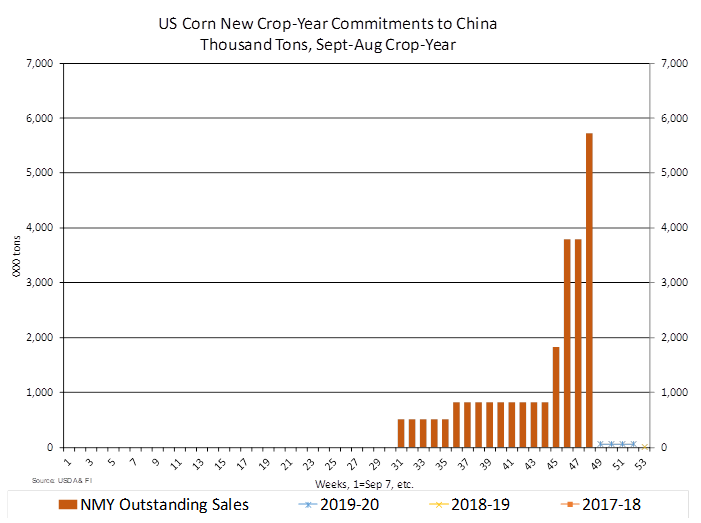
futures opened about 1.50-1.75 cents higher despite USDA announcing China bought 1.937 million tons of new-crop, largest single day sales for that country (3rd largest in history behind USSR) and unknown destinations picking up 130,000 tons of new-crop.
Corn ended unchanged to 0.50 cent higher. US weather conditions limited gains.
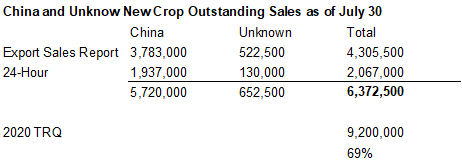
China
only, includes 24-hour
-
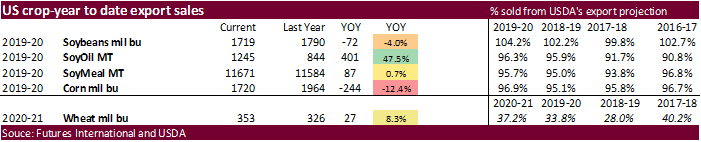
USDA
may raise their 2020-21 US export forecast by 150 million bushels to 2.300 billion bushels, above 1.775 billion for 2019-20 and largest since 2017-18 when the US exported 2.438 billion.
-
China
sold little more than 4 million tons of corn from reserves at an average price of 2,037 yuan per ton.
-
USDA
corn export sales were disappointing. Old crop posted a net reduction. -
Some
traders are as high as 187 bushels per acre for the US corn yield. Note the ten-year trend is 183.6 bushels per acre.
-
The
funds bought an estimated net 1,000 corn contracts. -
The
southern US Midwest will see rain over the next week while the northern Corn Belt will be dry. Temperatures will remain mild.
-
Bloomberg
noted during the July 1-28 period, France saw 28% of its normal rainfall, a concern for the countries corn crop.
-
The
USDA FAS estimated 2021 China chicken meat production rising to 15.300 million tons from 14.850 for 2020, a 3 percent increase. They projected the poultry industry grew 18 percent in 2019 and will rise 8 percent in 2020.
https://apps.fas.usda.gov/newgainapi/api/Report/DownloadReportByFileName?fileName=Poultry%20and%20Products%20Annual_Beijing_China%20-%20Peoples%20Republic%20of_08-01-2020
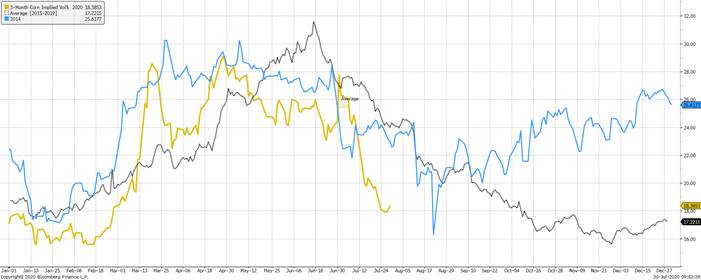
Corn
vols
for this time of year are very low, and at least lowest going back to 2013 (2012 was the drought year) heading onto the August USDA Crop Production report. Below the blue line represents 2014, the year corn vols dropped out of bed after the August report,
and grey line is the 5-year average. Yellow is this year. Will vol decrease further on August 12? Looking at 2014 we think so if the US corn yield comes in above 182 bu/ac.
Corn
Export Developments
-
Under
the 24-hour announcement system, private exporters sold 1.937 million tons of corn to China and 130,000 tons of corn to unknown, both new-crop.
- September
corn is seen in a $3.10 and $3.35 range over the short term. December lows could reach $3.10. We can’t justify below $3.00 unless a shock in the September grain stocks report occurs, or China’s production gets upward revised by a large amount.