PDF Attached
Corn
saw technical buying today after selling stalled on Wednesday. Soybeans were higher on Chinese demand and sharply higher soybean oil. Wheat was on the defensive on improving global weather and profit taking after Chicago traded at a 3-month high yesterday.
A
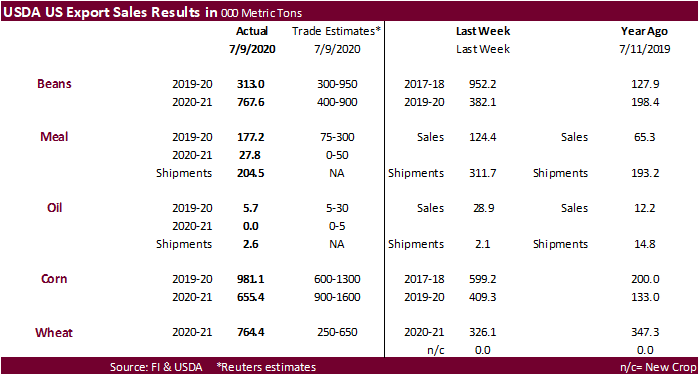
combined 873,000 tons of old and new-crop soybean 24-hour sales were sold to China and unknown.
CP:
US
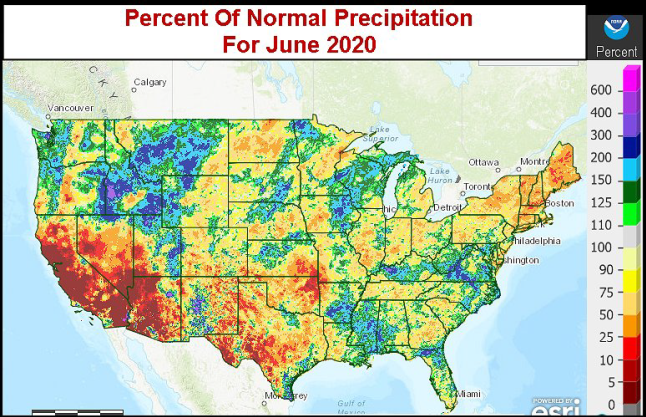
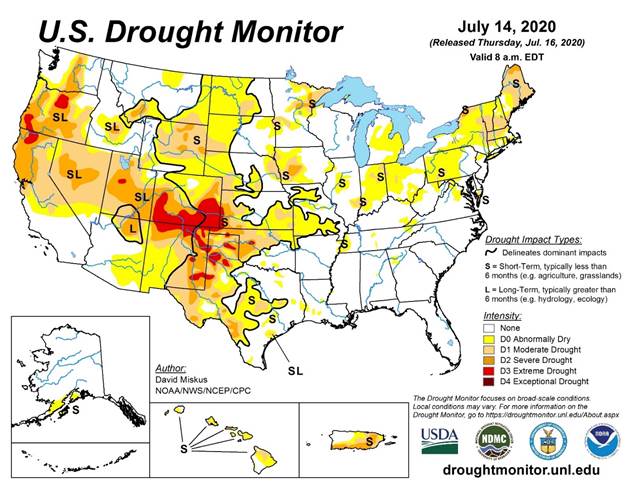
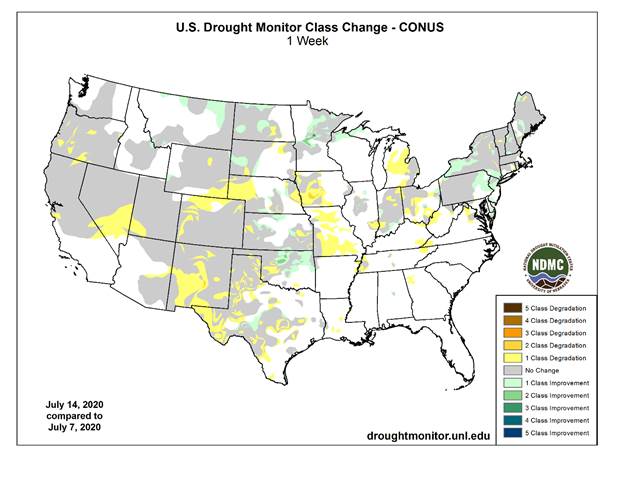
spring wheat conditions are expected to improve 1-2 points on Monday while soybeans and corn could end up unchanged to down 1 point, for each. As of July 14, 15 percent of the US corn area was experiencing moderate drought conditions, up from 10 percent previous
week. TX and CO were experiencing 61 and 74 percent, respectively. 9 percent of the US soybean states were experiencing drought conditions, up from 5 percent previous week. IA was at 24 percent for corn and 25 percent for soybeans. 6 percent of the spring
wheat states were experiencing drought, down from 11 percent previous week and 27 percent week before that.
US
CPC: Above normal precipitation favored for the northern Great Plains and upper Miss Valley. Aug-Sep above normal temperatures.
World
Weather Inc.
UNITED
STATES
- The
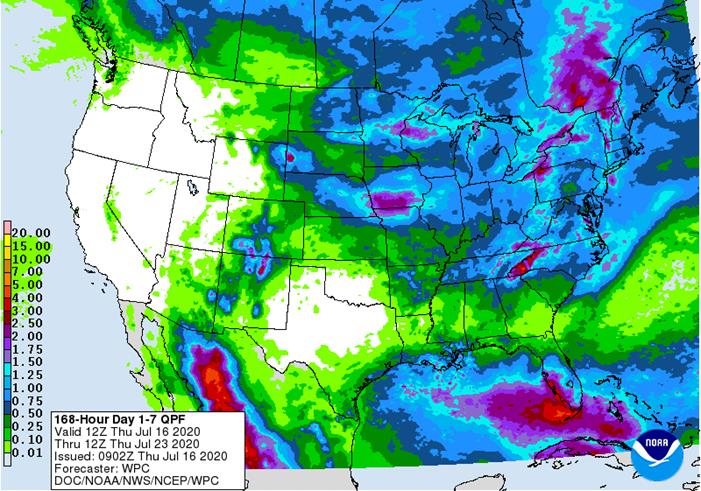
first week of the 06z GFS model run was wetter in “portions” of the region from Nebraska through Iowa and Missouri to Ohio, Kentucky, Virginia and North Carolina - Some
of these increases were overdone - GFS
increased rain eastern Kansas and Missouri, the Delta and southeastern states July 23-25 - Some
of the increase was overdone - GFS
increased rain in the northwest half of Canada’s Prairies July 23-25 while rain was reduced in the southeastern parts of the Prairies, northeastern North Dakota and from northern Minnesota to Upper Michigan - Some
of these changes were needed - A
small reduction in lower Midwest rainfall was suggested July 26-28 while rain was increased in the Delta and southeastern states - Some
of these changes were needed, but the lower Midwest may be a little dry - Rain
was increased from South Dakota to northwestern Wisconsin July 26-28 while reduced from the Dakotas to northern Minnesota - Some
of the change was needed; the previous GFS model run was too wet, but the placement of rain on this new model run looks a little questionable - GFS
reduced rain from Colorado to eastern South Dakota, Minnesota and Wisconsin July 29-30 - Some
of this reduction was needed
The
general theme for the coming week remains about the same as that of Wednesday with rain likely in most of the Midwest at one time or another and sufficient rain will be present to support reproducing corn and flowering soybeans. Very few areas will be completely
missed by rain, but some areas will need greater amounts to fully restore soil moisture after recent drying. Temperatures will be quite warm across the Midwest this weekend and possibly again late next week and into the following weekend which may accelerate
drying. Pockets of dryness are expected during the next two weeks, but a widespread generalized problem with moisture shortages is unlikely. A close watch on the distribution of rain is warranted because some of the rain advertised seems a little overdone
and pockets of dryness at the end of this month could fester into a more stressful environment in August if rainfall becomes more limited in the southwestern Corn Belt and Delta as expected.
RUSSIA
NEW LANDS
- GFS
model has backed off on some of the rainfall advertised for the New Lands during this coming week - Some
showers are expected, but some relief from dryness is expected in some areas, but the need for greater and more widespread rain will continue - 06z
GFS model run and the 00z European model run have increased rainfall in the central New Lands late next week and into the following weekend - Some
of this increase was a little overdone, but this forecast may be better than that advertised previously this week
- A
few showers were also advertised for July 29-30 in a part of the central New Lands which was an increase over the previous model run forecast - The
increase may verify, but rain amounts will have to remain light
Today’s
forecast for the New Lands has improved over that of earlier this week with rising confidence. The strong ridge of high pressure and limited rainfall that has dominated this week will begin to break down this weekend, although today and Friday may again be
hot and dry. The breakdown of the ridge will be a gradual process and even though temperatures will become less oppressive during the weekend and early next week there will continue to be a warm bias and rainfall will be limited to scattered showers in only
a portion of the region. Greater “potential” relief may come along later next week and into the following weekend, although that period of time will need to be closely monitored due to the potential that the ridge might reassert itself on the region in future
model runs.
EUROPE/BLACK
SEA REGION
- Both
the European and GFS model runs are suggesting a higher potential for rain in western Europe during the second weekend of the outlook
- The
GFS is much wetter than the European model, but “some” relief to drying may occur in a “part” of France, the U.K. and neighboring areas at that time if the models are correct - The
only change noted by the GFS in this first week of the outlook was a small increase in eastern Ukraine rainfall early next week
- Some
of this increase may be overdone; the European and Canadian models keep the region limited on rainfall through day ten
- Northwestern
Europe will continue be drier biased through the coming week, despite a few showers briefly early next week that will have little impact on overall dryness in France, the U.K., Belgium or Germany
CHINA
- GFS
model has returned heavier rainfall to the heart of the Northeast Provinces this weekend into Monday - The
advertised rainfall may be a little overdone with 2.00 to 5.00 inches of rain advertised from northeastern Hebei to northwestern Heilongjiang - Little
other change was noted over the next ten days with excessive rain still expected in the Yangtze River Basin during a part of this period with the GFS promoting some of this heavy rain as far northeast as Shandong; the European model has the greatest rain from
northern Jiangsu to Sichuan and northern parts of Hunan
China’s
bottom line remains too wet for parts of the Yangtze River Basin and areas northeast into Jiangsu and possibly far southern Shandong over the next ten days. A better mix of weather is expected to the north, although some heavy rain is possible for a brief
period of time weekend and early next week. Far southeastern China may experience net drying for a while.
AUSTRALIA
- Not
much change was noted in the outlook today through day 10 - Previously
advertised rain in Queensland and northern New South Wales has been greatly reduced with most of the rain now likely in southeastern Queensland near the coast Tuesday into Thursday of next week and this solution seems to make more sense than Wednesday’s model
runs
SOUTH
AMERICA
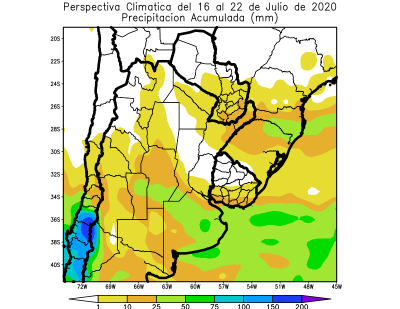
Today’s
model solutions have diminished some of the rain advertised for western Argentina, although rain is still expected late this weekend into early next week. Some of the reduction was needed and all of the rain that falls will be welcome, although more will certainly
be needed. Far southern Brazil rainfall was reduced in the 06z GFS model run and that change was needed after the previous model run was too wet.
Source:
World Weather Inc. and FI
- USDA
weekly crop net-export sales for corn, soybeans, wheat, cotton, pork, beef, 8:30am - Port
of Rouen data on French grain exports - North
America 2Q cocoa grindings - European
Cocoa Association 2Q grind data
FRIDAY,
July 17:
- ICE
Futures Europe weekly commitments of traders report, 1:30pm (6:30pm London) - CFTC
commitments of traders weekly report on positions for various U.S. futures and options, 3:30pm - FranceAgriMer
weekly update on crop conditions - Cocoa
Association of Asia releases 2Q cocoa grind data
USDA
export sales showed new-crop corn sales below expectations despite the Chinese sale. China booked 768,300 tons of old crop corn and 600,000 tons new-crop. Soybeans and meal were within expectations. Soybean oil on the lighter side. Wheat exceeded expectations.
38,500 tons were recorded for pork and 72,700 tons for sorghum.
US
Retail Sales Ex Auto (M/M) Jun: 7.5% (exp 5.0%; prev 18.2%)
–
Retail Sales ex Auto And Gas (M/M) Jun: 7.3% (exp 5.0%; R prev 12.1%)
US
Initial Jobless Claims Jul-11: 1300K (exp 1250K; R prev 1310K)
–
Continuing Claims Jul-10: 17338K (exp 17500K; R prev 17760K)
US
Philadelphia Fed Business Outlook Jul: 24.1 (exp 20.0; prev 27.5)
-
September
corn was
up 4 cents and December up 3.50 cents on technical buying. We
believe the action today was technical as the US weather forecast was wetter for parts of the Midwest this morning. Since corn closed unchanged to slightly higher on Wednesday, the slowing of fund selling prompted bulls to get back into the market. China sold
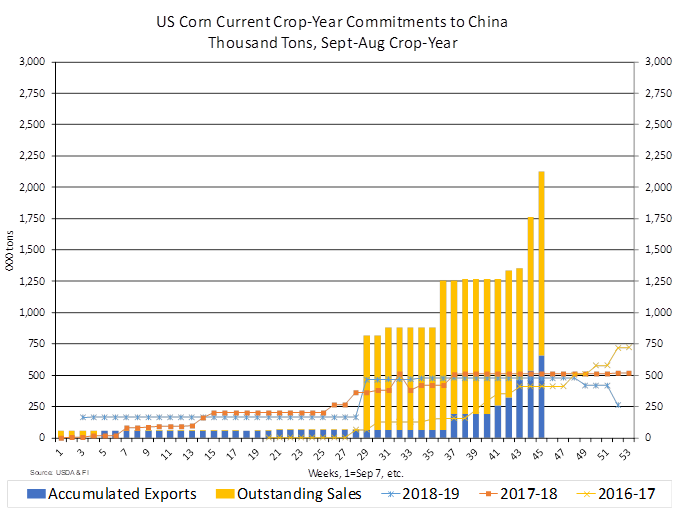
all of their corn offered at auction, a sign they need corn. -
USDA
export sales were good all-around but new-crop alone fell short of expectations.
-
Resistance
for December corn is seen near 3.44, support 3.23.
·
The USD was 30 higher by 2:08 pm CT.
·
The US generated 1.07 billion D6 ethanol blending credits in June, up from 841 million in May.
-
Reuters:
Argentina does not plan to increase grains export taxes – Agriculture Minister. This come after concerns over the restructuring of $65 billion in sovereign bonds could increase taxes. Wheat exports from Argentina are currently taxed at 12%, corn at 12%,
soybeans at 33% and soymeal at 33%. -
China
sold 4.026 million tons of corn out of reserves at an average selling price of 1,950 yuan per ton. 32 million tons were sold at auction this season, not including Sinograin sales.
-
The
32MMT+ season to date auction plus the recent purchases from the US and Ukraine tell me China could exceed their import quota cap of 7.2 million tons, but a sharp recovery in pig numbers is needed.
-
China’s
pork production fell 4.7 percent in Q2 (April-June), a seventh consecutive of a decline, to 9.6 million tons, according to Reuters. The National Bureau of Statistics showed a 19.1% drop for the first six months of the year. China slaughtered 251.03 million
hogs in the first six months of the year and the pig herd fell 2.2% year-on-year to 339.96 million head at end-June, but up from 321.2 million at end of March. The sow herd at the end of June was 36.29 million head, up 5.4% from prior year, and up 7.3% from
33.81 million head at the end of March. -
USDA
reported wholesale beef prices at a 30-month low at $2.0076/lb. Wholesale pork rose 4.1%, the most since July 8, to 68.95c/lb.
-
Saudi
Arabia seeks 720,000 tons of barley on Friday. -
South
Korea’s KOCOPIA group bought 60,000 tons of corn from Brazil at $196.31/ton c&f for Sep 5-25 arrival.
-
South
Korea’s KFA group passed on 69,000 tons of corn. Lowest price was said to be $195.37/ton c&f for Nov 15 arrival.
-
South
Korea’s FLC group bought 65,000 tons of corn, optional origin, at $184.74/ton c&f for Oct 10 arrival.
-
Results
awaited: Iran seeks 200,000 tons of corn and 200,000 tons of barley on Wednesday for Aug/Sep delivery.
-
September
corn is seen in a $3.20 and $3.65 range over the short term. December lows could reach $3.10.