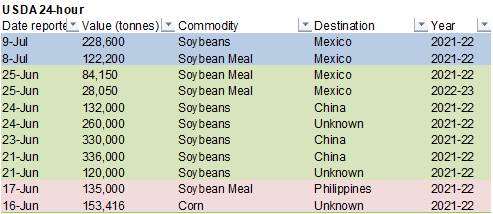
WASHINGTON,
July 9, 2021–Private exporters reported to the U.S. Department of Agriculture export sales of 228,600 metric tons of soybeans for delivery to Mexico during the 2021/2022 marketing year.
1-7
DAY PRECIPITAION FORECAST
WORLD
WEATHER INC.
MOST
IMPORTANT WEATHER OF THE DAY
- Beneficial
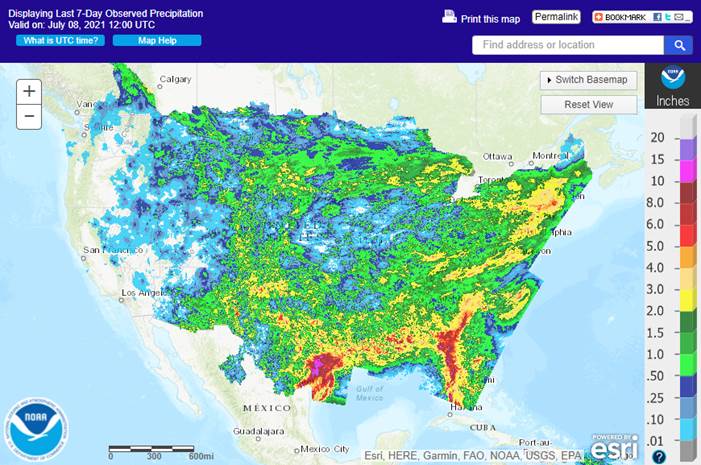
rain fell across portions of Iowa and the Dakotas overnight with some of the precipitation locally significant
o
Much of the precipitation was light with the greater amounts localized
o
Greater rain will be needed to make a more significant impact on crops, but the few areas reporting 1.00 to 2.43 inches of rain in northwestern Iowa and the amounts over 1.00 inch in northwestern North Dakota were certainly welcome.
- U.S.
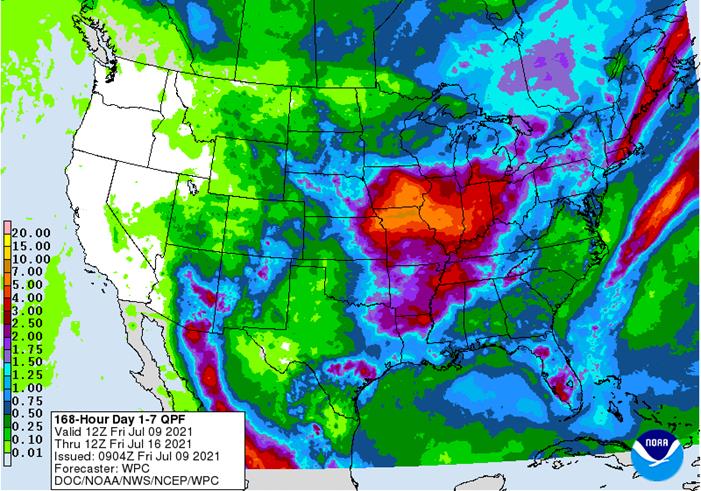
Midwest weather is still expected to be plenty wet over the next ten days with all crop areas getting rain at one time or another
o
The precipitation will be least significant in Minnesota, the Dakotas and possibly in portions of both northwestern Iowa and Nebraska
o
Heavy rain is expected in eastern Iowa, southern Wisconsin, Illinois and parts of eastern Missouri due to a slow moving cut off low pressure system that will move slowly from those states to the east during the weekend and early
next week
- Local
flooding is expected due to rain totals of 2.00 to more than 5.00 inches resulting.
- U.S.
Midwest temperatures and a part of the Plains will be cooler than usual during the coming week to nearly ten days
o
The cool air will help conserve soil moisture ensuring moisture abundance when drier weather evolves later this month
- World
Weather, Inc. still perceives and successful pollination season for many crops in the Midwest, but yield losses are expected in the northern Plains and in portions of Minnesota - Late
July temperatures will rise above normal in a part of the U.S. Plains and a few westernmost Corn Belt locations, but areas farther to the east will continue in a mostly good weather mode into early August - U.S.
Delta, Texas and southeastern states will experience a good balance of weather during the next two weeks - Recent
flooding rainfall in the Texas Coastal Bend cotton, corn and sorghum areas may have damaged a few crops
o
Rain totals varying from 2.60 to more than 8.00 inches was common with the Rockport area reporting 15.01 inches since Tuesday morning
- Far
western U.S. will be dry for the next two weeks
o
This includes the Pacific Northwest, California and the western Great Basin
o
Temperatures will also be warmer than usual
- July
20-26 will be a period of warmer weather in the U.S. Plains, Canada’s Prairies and the western most Corn Belt where highs will rise into the 80s and 90s with a extremes over 100 in a part of the central Plains
o
The eastern Midwest will also trend warmer, but no excessive heat is expected with highs in the 80s and lower 90s
- West
Texas cotton, corn and sorghum areas will experience a good mix of weather for a while with more sunshine and warm temperatures than rain
- Canada’s
Prairies will receive restricted rainfall during the coming week except in central, western and northern Alberta where rain amounts will be sufficient to induce some better canola, wheat and other crop development
o
Week two of the Canadian Prairies weather should bring on improved rainfall for many areas away from the far south
- Southeastern
Canada’s Ontario and Quebec crop areas have received some welcome rain recently improving soil moisture and supporting long term crop- development
o
A good mix of weather is expected over the next two weeks
- Monsoonal
moisture from Mexico will bring frequent showers and thunderstorms to the southern half of the Rocky Mountain region and some crop areas in Arizona and New Mexico during the coming ten days - Tropical
Storm Elsa will exit from New England today and pass through Nova Scotia and Newfoundland, Canada during the weekend while losing tropical characteristics
o
Rainfall of 2.00 to 4.75 inches has resulted from resulted from Florida to southern New England so far with very little property or crop damage
- Rain
has begun to fall significantly in northern parts of Kazakhstan and some neighboring areas of Russia’s New Lands
o
Temporary improvements to spring wheat, sunseed and other crops will result as this pattern prevails over the coming week
o
Drying will resume in the July 16-22 period, although temperatures will not be excessively warm
- Interior
western Russia, including the Volga Basin, will receive very little rain over the coming week
o
Dry conditions will also impact eastern portions of Russia’s Southern Region and in far western Kazakhstan
o
Temperatures will be warmer than usual this week which will accelerate the region’s drying trend while raising the potential for some crop stress
- Argentina
will receive some rain periodically over the coming ten days which should benefit winter wheat and barley establishment
o
The precipitation will be greatest next week
- Brazil
will be dry through the weekend and will receive rain in the far south during mid- to late-week next week ahead of cooler temperatures - Brazil
grain, sugarcane, coffee and citrus areas are not vulnerable to any threatening cold temperatures for at least the next ten days.
- Europe
will experience periodic rain from eastern France and the U.K. to Scandinavia, Poland, Austria and northern Italy during the coming ten days
o
Net drying is expected in portions of the interior Balkans region into early next week, but some needed rain will fall in the drier areas in the following week
- China
remains plenty wet if not a little too wet in some areas
o
More than 14.00 inches of rain fell in Anhui Thursday where the greatest rain resulted
o
Recent flooding has impacted many areas from the interior south to the east-central provinces and drying is needed
- Some
crop damage has resulted
o
Locally heavy rain has also occurred in the northeast
- Much
of China will receive frequent rainfall over the next two weeks raising the need for drying in many areas.
o
Additional flooding is expected
o
Rain in the coming week will be lighter than usual in Hunan, southeastern Guizhou, Jiangxi, Guangxi, Guangdong and Fujian raising the need for rain soon, but these areas have been too wet in past weeks and will benefit from the
drying
- Week
two precipitation is advertised to be much greater once again in these provinces providing timely relief from dryness
o
The greatest rainfall in this coming week will be in Hebei, Shandong and Liaoning where flooding is possible because of 2.00 to more than 6.00 inches of rain
- Xinjiang,
China weather Thursday was dry and seasonably warm
o
Highest temperatures were in the 80s and lower to a few middle 90s Fahrenheit
- Low
temperatures were in the 60s and lower 70s - Xinjiang
weather will continue good for into the weekend, but some thunderstorms are expected late this weekend and especially next week in northeastern parts of the region
o
Temperatures will be a little cooler than usual again, but not nearly as anomalous as they were earlier this year
- Northern
India will be dry through the end of this workweek and then rain will develop during the weekend and continue to expand across the north next week
o
The rain will be extremely important to the north where it has been quite dry recently.
o
Temperatures will be warm in the north and seasonable in the south.
o
Excessive rain may occur along the west coast where some flooding is expected
- North
Africa has been and will continue to be mostly dry supporting late season winter crop harvesting
- Australia
weather will continue well mixed over the next two weeks supporting improved winter crop establishment
o
Rain is needed in northwestern Victoria and South Australia
o
Rain in Queensland Thursday was welcome
- Thailand,
Cambodia and Vietnam started to receive needed rain Wednesday and Thursday and they will experience greater rain over the coming week
o
A general improvement in crop conditions, soil moisture and eventual the water supply is expected
- Thailand,
corn, rice, sugarcane and other crops were becoming stressed because of dryness recently. The same may have been occurring in some Cambodia and Vietnam locations - Indonesia
and Malaysia rainfall is expected to be sufficient to maintain or improve soil moisture for all crops - Philippines
rainfall will slowly increase during the next two weeks which should be welcome initially - West
Africa rainfall from Ivory Coast and Ghana to Cameroon and Nigeria will be lighter than usual during the coming ten days, but timely rainfall will maintain favorable crop conditions
o
Ivory Coast and Ghana will experience the least rainfall and have the greatest increase in rainfall needs over the next two weeks
- Erratic
rainfall has been and will continue to fall from Uganda and Kenya into parts of Ethiopia
o
A boost in precipitation is needed and expected
- Ethiopia
rainfall is expected to gradually improve while a boost in precipitation will continue needed in other areas - South
Africa will experience additional showers in the far west periodically over the coming week
o
The moisture will be good for winter crops, but more moisture will be needed in Free State and other eastern wheat production areas
o
Summer crop harvesting has advanced well this year and the planting of winter grains has also gone well, but there is need for moisture in eastern winter crop areas
- Nicaragua
and Honduras have been and will continue receiving some welcome rain recently, but moisture deficits are continuing in some areas
o
Additional improvement is needed and may come slowly
- Southern
Oscillation Index is mostly neutral at +6.88 and the index is expected to continue rising for a few more days -
New
Zealand rainfall during the coming week to ten days will be erratic and lighter than usual while temperatures are near to slightly below average
Source:
World Weather, Inc.
Bloomberg
Ag Calendar
Monday,
July 12:
- USDA’s
monthly World Agricultural Supply and Demand Estimates (WASDE) report, noon - China
farm ministry’s monthly supply-demand report (CASDE) - USDA
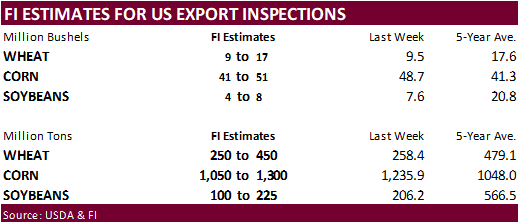
export inspections – corn, soybeans, wheat, 11am - U.S.
crop conditions – corn, cotton, soybeans, wheat, 4pm - French
agriculture ministry’s crop plantings and production estimates - FAO
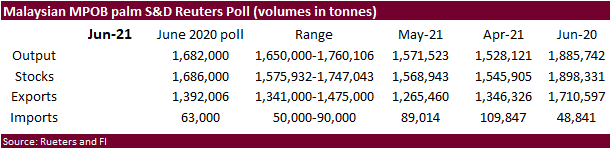
State of Food Security and Nutrition in the World 2021 report - Malaysian
Palm Oil Board’s end-June stockpiles, output and production data - Malaysia
July 1-10 palm oil export data from SGS - Ivory
Coast cocoa arrivals
Tuesday,
July 13:
- China
customs to publish 1H trade data, including imports of soy, edible oils, meat and rubber - FranceAgriMer
monthly grains report - European
Cocoa Association to release quarterly cocoa processing figures - EU
weekly grain, oilseed import and export data - Brazil’s
June Coffee Exports - New
Zealand Food Prices
Wednesday,
July 14:
- EIA
weekly U.S. ethanol inventories, production - Brazil
Unica cane crush, sugar production (tentative) - Malaysia
2Q cocoa grinding data (tentative) - HOLIDAY:
France
Thursday,
July 15:
- USDA
weekly crop net-export sales for corn, soybeans, wheat, cotton, pork, beef, 8:30am - China
2Q pork output and inventory levels - Malaysia
July 1-15 palm oil export data - Malaysia
crude palm oil export tax for August (tentative) - Port
of Rouen data on French grain exports - Barry
Callebaut 9-month key sales figures
Friday,
July 16:
- ICE
Futures Europe weekly commitments of traders report (6:30pm London) - CFTC
commitments of traders weekly report on positions for various U.S. futures and options, 3:30pm - FranceAgriMer
weekly update on crop conditions - Cocoa
Association of Asia releases 2Q cocoa grinding data
Source:
Bloomberg and FI
Reuters
estimates for USDA

CFTC
Commitment of Traders
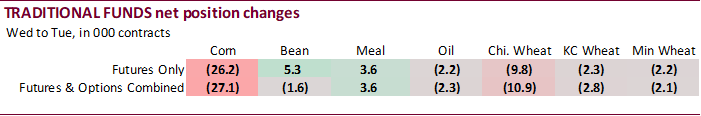
We
see no price implications from the results of the CFTC Commitment of Traders report. Funds were a little less long for corn and soybeans and more long for Chicago wheat, but given the high open interest, discrepancies are small, in out opinion. Funds have
room to rebuild long positions.


SUPPLEMENTAL
Non-Comm Indexes Comm
Net Chg Net Chg Net Chg
Corn
159,115 -24,711 440,558 -1,736 -547,126 24,079
Soybeans
27,395 -3,614 171,047 2,771 -183,479 154
Soyoil
19,310 903 118,277 -6,735 -144,943 6,565
CBOT
wheat -46,724 -8,276 149,615 -7,258 -87,740 18,464
KCBT
wheat 3,979 -3,972 64,298 2,341 -65,659 861
=================================================================================
FUTURES
+ OPTS Managed Swaps Producer
Net Chg Net Chg Net Chg
Corn
219,371 -26,063 251,219 1,038 -513,343 23,711
Soybeans
82,180 5,923 81,797 -948 -159,245 1,837
Soymeal
20,964 5,151 89,608 64 -152,881 -4,470
Soyoil
48,174 0 110,254 -3,429 -163,964 6,501
CBOT
wheat -13,617 -14,392 68,227 -4,481 -59,614 18,288
KCBT
wheat 20,880 -1,844 44,169 1,265 -59,641 750
MGEX
wheat 8,826 -1,143 2,841 -101 -24,979 3,158
———- ———- ———- ———- ———- ———-
Total
wheat 16,089 -17,379 115,237 -3,317 -144,234 22,196
Live
cattle 62,881 -2,843 87,158 1,637 -164,884 -883
Feeder
cattle 7,829 664 5,931 -453 -1,692 54
Lean
hogs 67,207 -462 62,995 -1,471 -130,935 5,390
Other NonReport Open
Net Chg Net Chg Interest Chg
Corn
95,301 -1,055 -52,547 2,368 2,095,646 32,551
Soybeans
10,230 -7,503 -14,962 690 945,291 18,630
Soymeal
17,300 -1,502 25,009 758 426,916 -4,265
Soyoil
-1,819 -2,340 7,356 -732 575,457 -1,890
CBOT
wheat 20,154 3,516 -15,150 -2,930 410,630 -6,547
KCBT
wheat -2,790 -941 -2,619 770 200,791 6,421
MGEX
wheat 1,441 -967 11,870 -948 80,503 -1,450
———- ———- ———- ———- ———- ———-
Total
wheat 18,805 1,608 -5,899 -3,108 691,924 -1,576
Live
cattle 26,925 983 -12,080 1,105 345,288 1,571
Feeder
cattle 1,641 -112 -13,707 -153 53,478 3,032
Lean
hogs 13,216 -1,584 -12,484 -1,872 335,768 -1,068
Source:
CFTC, Reuters and FI
US
Wholesale Inventories (M/M) May: 1.3% (est 1.1%; prev 1.1%)
–
Wholesale Trade Sales (M/M) May: 0.8% (prev R 1.1%)
-
US
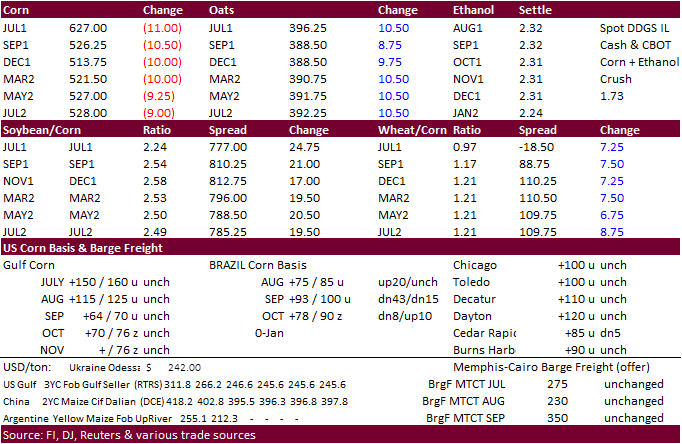
corn
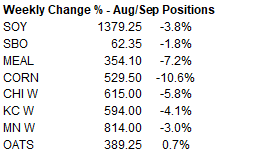
futures were on the defensive from the onset related to favorable US rainfall. September closed the week down about 10.5%. On Friday the September contract was off 7.25 cents and December shed 6.75 cents, but settled off contract lows. Both Sep and Dec
closed for the second consecutive day below its 100-day MA, a bearish signal. CZ hit sell stops around 11:06 – 11:08 at 5.14 – 5.11 with about 3,300 contracts trading.
-
We
didn’t see the short covering that we anticipated earlier this morning in futures, but there was a good amount of option positioning ahead of the USDA report early next week.
-
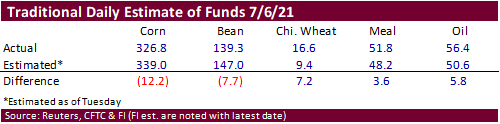
Funds
were an estimated net sellers of 8,000 corn futures. -
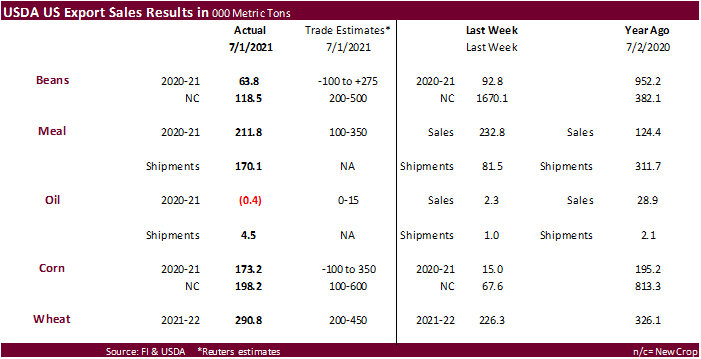
USDA
corn export sales were only 173,200 tons old crop and 198,200 tons new crop. Some were looking for better new-crop sales. Pork sales were 43,800 tons. Sorghum and barley sales combined were minimal.
-
China
corn futures hit an 8-month low. Domestic demand continues to erode as China sold only a small amount of corn out of auction.
-
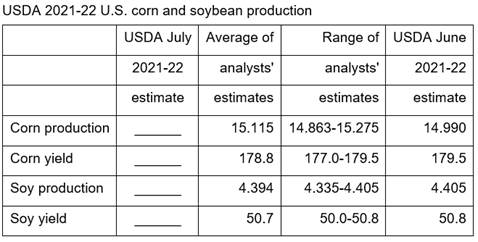
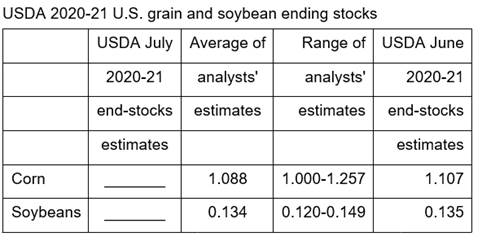
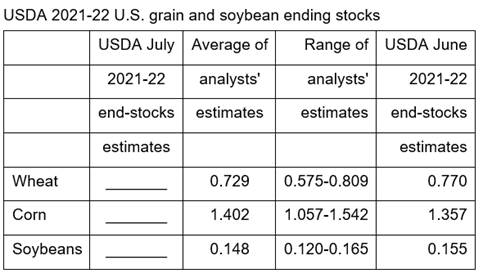
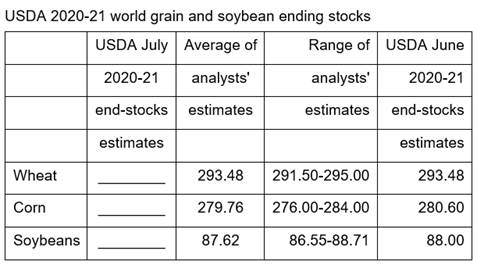
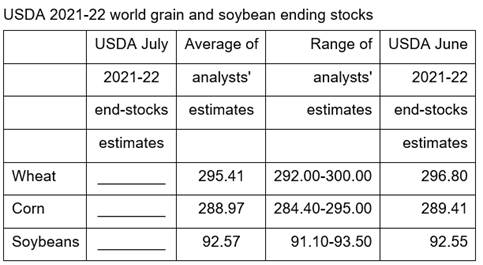
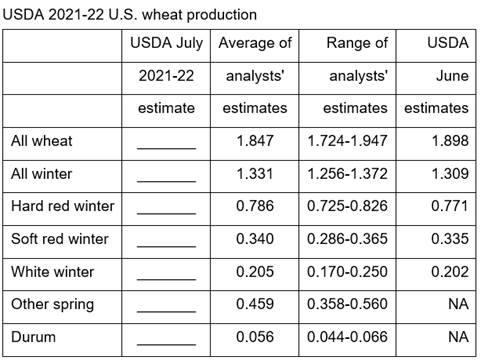
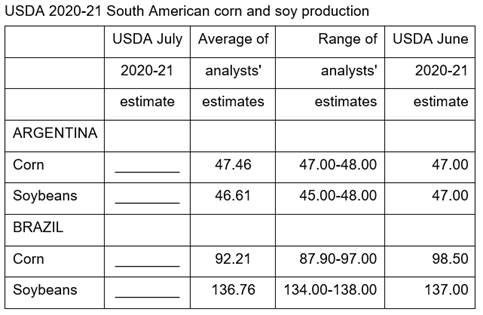
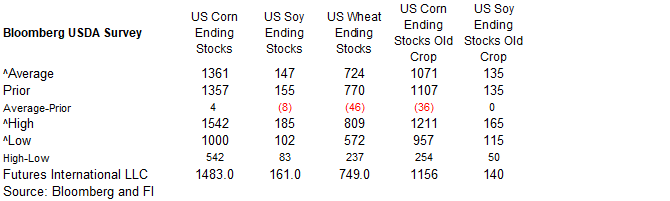
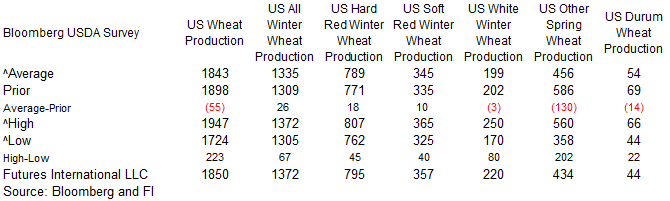
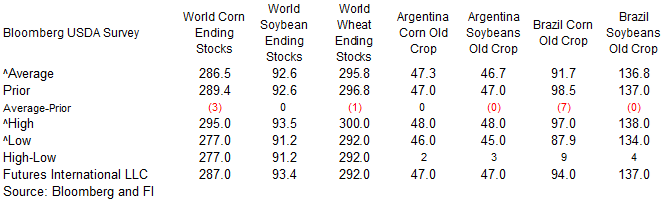
USDA
S&D report is Monday and US CPI (inflation) is due out Tuesday morning. We attached our FI snapshot for the USDA report after the text. There will be a lot of fucus on the US corn yield and production. Traders are not looking for much change in US soybean
supply. -
China
plans to buy about 13,000 tons of pork for state reserves on July 14. -
Swine
fever hit small farms in China’s Sichuan province, but Reuters noted many pigs are dying from it. The province produced 48.5 million hogs last year. We think the percentage infected is very low as commercial farms reporting outbreaks would have been more
vocal in reporting the number or percentage of deaths.
Export
developments.
- China
sold only 7% of the 130,000 tons of imported corn offered out of auction from the United States and Ukraine (Sinograin). 123,954 US & 6,340 Ukraine.
- Turkey
seeks 440,000 tons of feed barley on July 12 for shipment between July 29 and August 16.
Updated
07/01/21
September
corn is seen is a$4.50-$6.25 range.
December
corn is seen in a $4.25-$6.00 range.
-
CBOT
soybeans traded in a choppy two-sided trade, same with the products. Soybeans and soybean oil rallied into the close. This paired some losses in soybean meal. Products since Tuesday morning were weaker than soybeans, and as a result CBOT crush was under
pressure – all week. Aug soybeans since last Friday were down 3.8%, Aug meal off 7.2%, and Aug SBO 1.8% lower.
-
USDA
announced 228,600 tons of soybeans sold to Mexico for 2021-22 delivery, a supportive feature and renewing thoughts/opinions of Mexico eventually phasing out US GMO corn imports.
-
Soybean
option volume was decent and may reflect some positioning ahead of the USDA report on Monday. Volatility was little changed for November soybeans week over week on the call skew even though we dropped about 69.75 cents.
-
Upside
in the soybean back months were limited than that of September from good rains that fell across the heart of the US late in the workweek. US forecast looks good for the central and eastern areas of the Corn Belt over the next week to ten days. Precipitation
will be least significant in Minnesota,
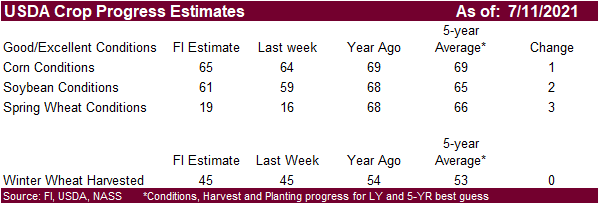
Dakotas and portions of northwestern Iowa and Nebraska. Eastern Iowa, southern Wisconsin, Illinois and parts of eastern Missouri will see heavy rain. Rains last weekend into this week is expected to boost US crop conditions when updated by USDA Monday and
we look for a slightly improvement in spring wheat, corn and soybeans. -
Funds
were an estimated net buyers of 7,000 soybean futures contracts, sellers of 3,000 net soymeal contracts, and buyers of 5,000 net bean oil contracts.
-
CBOT
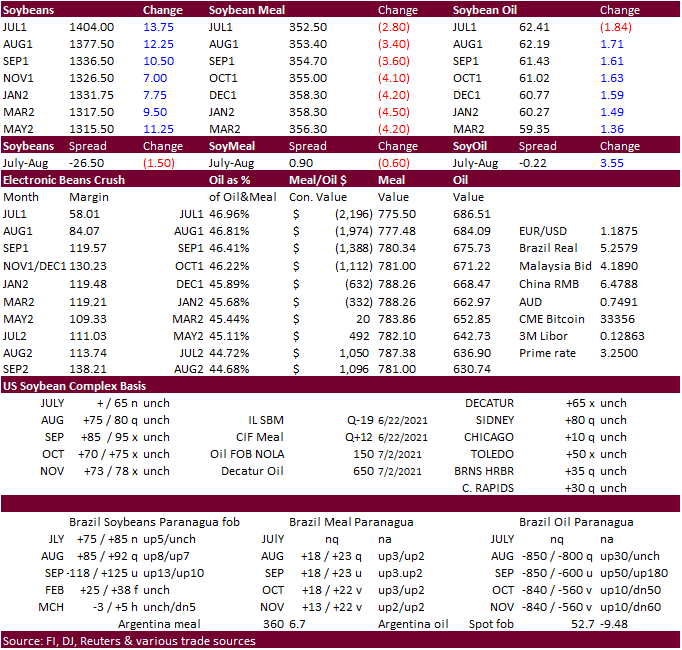
Aug soybean oil futures traded in a wide 280 point range today, ending sharply higher (+187), mainly on product spreading. Palm
oil
futures (3rd month) snaped a three day losing streak from a weaker ringgit.
-
ICE
canola futures traded limit higher. November canola was up $30 or 3.7% to $844 per ton, a new contract high. ICE canola limits expand to $45/ton.
-
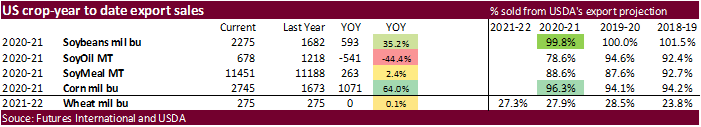
US
soybean export sales came in on the light side of expectations. Old crop soybean commitments are running at nearly 100 percent of USDA’s export projection. Shipments need to improve to reach USDA’s projection, but we could see exports surpass 2.280 billion
bushels. Soybean meal export sales were within expectations and shipments improved to 170,100 tons. Soybean oil sales showed a net reduction of 400 tons while shipments were again slow at 4,500 tons.
-
Argentina
was on holiday. -
Malaysian
palm oil snapped a 3-day downward trend by settling 123 points higher in large part to a weaker ringgit, and cash was up $20/ton to $995/ton. There were rumors Malaysian palm exports for the June 1-10 period will end up near what was reported during the first
ten days of June, which would be historically above average during the June 1-10 period in past years.
-
Ukraine’s
sunflower oil exports were 4.746 million tons from September 2020 through June 2021, 88.2% of the season’s export quota of 5.38 million tons.
-
Offshore
values this morning were leading SBO 146 points higher (191 higher for the week) and meal $0.40 higher (5.20 higher for the week).
Due
out Monday:
-
WASHINGTON,
July 9, 2021–Private exporters reported to the U.S. Department of Agriculture export sales of 228,600 metric tons of soybeans for delivery to Mexico during the 2021/2022 marketing year.
Updated
6/30/21
August
soybeans are seen in a $12.75-$15.00 range; November $11.75-$15.00
August
soybean meal – $330-$410; December $320-$425
August
soybean oil – 60-66; December 46-67 cent range
-
US
wheat was
mixed to start and ended the same direction per class for all the US markets. Chicago followed corn by closing 1.00-3.75 cents lower. Improving US soft wheat harvesting progress also
weighed
on Chicago prices. KC was led higher by firm Minneapolis wheat as Canada returns to hot and dry conditions. The far western U.S. will also stay mostly dry.
-
Funds
were an estimated net sellers of 2,000 wheat futures contracts. -
US
Wheat Associates estimated the US SRW harvest is nearly 80% complete and HRW nearly 29 percent complete. Harvest began on soft winter wheat.
-
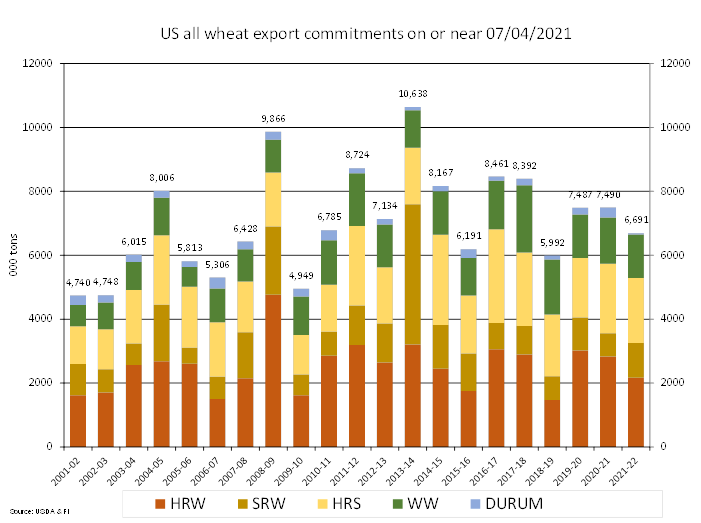
All-wheat
exports sales were 290,800 tons, lower end of expectations and seasonal slow for this time of year.
-
French
soft wheat conditions were steady from the previous week at 79% good/excellent, well up from 55 year ago. Only one percent of the crop had been harvested versus 10% year ago.
-
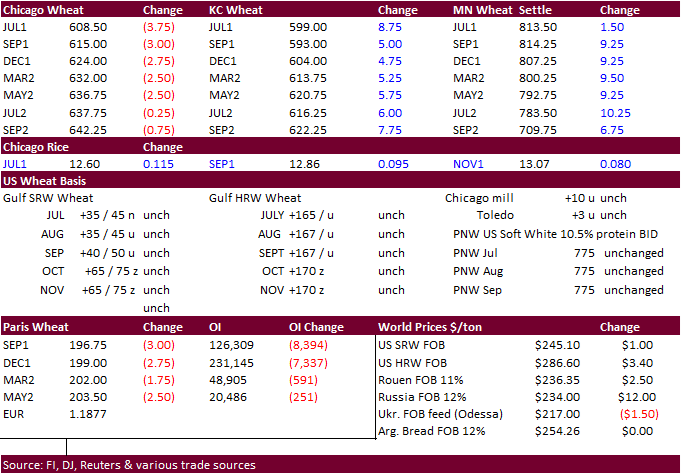
September
Paris wheat settled down 2.25
euros, or 1.1%, at 199.50 euros ($236.75) a ton, below its 200 psychological level. -
The
Euro continued to climb today from a 3-month low hit earlier this week against the USD.
-
Russia’s
AgMin proposed setting a floor for its grain reserve at 3 million tons for 2022-23, and white sugar reserve at 250,000 tons. -
Russia
harvested 5.933 million tons of grain by July 9, well below last years pace when comparing hectares threshed (1.7 versus 5.2 million year ago).
-
TASS
-The Russian wheat export duty will amount to $39.3 per ton from July 14 to 20, the Ministry of Agriculture reports on Friday. The barley and corn export duties will equal $37 a ton and $50.6 a ton respectively.
-
Japan’s
weather bureau expects a 70% chance of a non El Nino and La Nina event now through the northern hemisphere autumn.
A
Rueters poll calls for EU soft wheat production to increase 11.2 percent from 2020-21.
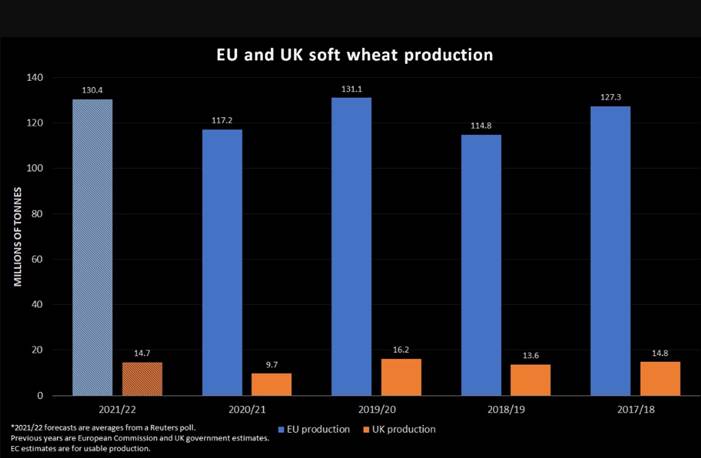
Source:
Reuters and FI
-
Iran’s
GTC bought 130,000 tons of wheat earlier this week for Aug/Sep shipment.
-
Algeria
bought 30,000 tons of wheat at $288/ton c&f for July/Aug shipment, depending on origin. Pakistan seeks 500,000 tons of wheat on July 27.
-
Results
awaited: The
Philippines seek up to 200,000 tons of feed wheat and milling wheat on Thursday, July 8. It includes 150,000 tons of feed wheat and 50,000 tons of milling wheat, all optional origin, for September, October and November shipment.
-
Pakistan’s
TCP seeks 500,000 tons of wheat on July 27. 200,000 tons are for August shipment, and 300,000 tons are for September shipment. -
Saudi
Arabia’s SAGO seeks 360,000 tons of wheat on July 12, split between hard wheat 12.5 percent protein and soft wheat 11% protein, for October shipment.
-
Japan
seeks 80,000 tons of feed wheat and 100,000 tons of barley on July 14. -
Bangladesh’s
seeks 50,000 tons of milling wheat on July 15. -
Bangladesh’s
seeks 50,000 tons of milling wheat on July 18.
-
Ethiopia
seeks 400,000 tons of wheat on July 19.
Rice/Other
-
South
Korea seeks 91,216 tons of rice from China, the United States and Vietnam for arrival in South Korea between Oct. 31, 2021, and April 30, 2022.
-
Bangladesh
seeks 50,000 tons of rice on July 18, not on the July. They delayed it.
Updated
6/30/21
September
Chicago wheat is seen in a $5.90-$7.00 range
September
KC wheat is seen in a $5.60-$6.70
September
MN wheat is seen in a $7.50-$9.00
U.S. EXPORT SALES FOR WEEK ENDING 07/01/2021
|
|
CURRENT MARKETING YEAR |
NEXT MARKETING YEAR |
||||||
|
COMMODITY |
NET SALES |
OUTSTANDING SALES |
WEEKLY EXPORTS |
ACCUMULATED EXPORTS |
NET SALES |
OUTSTANDING SALES |
||
|
CURRENT YEAR |
YEAR |
CURRENT YEAR |
YEAR |
|||||
|
|
THOUSAND METRIC TONS |
|||||||
|
WHEAT |
|
|
|
|
|
|
|
|
|
HRW |
100.8 |
1,514.1 |
1,825.6 |
136.0 |
655.4 |
1,007.8 |
0.0 |
0.0 |
|
SRW |
11.9 |
932.4 |
610.8 |
119.3 |
151.1 |
117.9 |
0.0 |
0.0 |
|
HRS |
119.3 |
1,609.8 |
1,583.8 |
72.0 |
425.1 |
587.5 |
0.0 |
0.0 |
|
WHITE |
53.6 |
1,079.4 |
1,105.5 |
52.4 |
283.6 |
341.1 |
0.0 |
0.0 |
|
DURUM |
5.3 |
8.4 |
179.0 |
5.3 |
31.6 |
131.2 |
0.0 |
0.0 |
|
TOTAL |
290.8 |
5,144.1 |
5,304.7 |
385.1 |
1,546.8 |
2,185.5 |
0.0 |
0.0 |
|
BARLEY |
0.3 |
23.7 |
40.2 |
0.3 |
1.4 |
1.5 |
0.0 |
0.0 |
|
CORN |
173.2 |
11,034.3 |
7,541.8 |
1,286.3 |
58,685.9 |
34,966.9 |
198.2 |
15,946.5 |
|
SORGHUM |
0.0 |
893.1 |
846.2 |
0.0 |
6,337.0 |
3,364.3 |
0.0 |
1,594.9 |
|
SOYBEANS |
63.8 |
3,410.3 |
8,229.8 |
221.2 |
58,494.0 |
37,544.2 |
118.5 |
9,397.9 |
|
SOY MEAL |
211.8 |
2,329.9 |
1,905.6 |
170.0 |
9,120.6 |
9,282.1 |
55.8 |
911.8 |
|
SOY OIL |
-0.4 |
21.2 |
239.7 |
4.5 |
656.3 |
978.5 |
0.0 |
0.6 |
|
RICE |
|
|
|
|
|
|
|
|
|
L G RGH |
10.5 |
224.5 |
99.2 |
7.0 |
1,532.3 |
1,318.4 |
0.0 |
0.0 |
|
M S RGH |
0.0 |
8.4 |
23.6 |
0.0 |
25.5 |
72.9 |
0.0 |
7.0 |
|
L G BRN |
0.3 |
11.9 |
11.2 |
0.6 |
39.5 |
57.2 |
0.0 |
0.7 |
|
M&S BR |
0.1 |
22.9 |
31.6 |
0.1 |
133.8 |
86.4 |
0.0 |
0.0 |
|
L G MLD |
5.4 |
46.5 |
55.6 |
4.1 |
611.8 |
834.9 |
0.0 |
0.0 |
|
M S MLD |
3.7 |
117.5 |
115.7 |
22.3 |
570.6 |
625.2 |
-0.3 |
12.3 |
|
TOTAL |
19.9 |
431.8 |
336.9 |
34.1 |
2,913.6 |
2,995.0 |
-0.3 |
20.0 |
|
COTTON |
|
THOUSAND RUNNING BALES |
||||||
|
UPLAND |
52.1 |
2,182.8 |
4,156.3 |
294.8 |
13,933.5 |
12,880.4 |
177.0 |
2,604.1 |
|
PIMA |
5.4 |
107.7 |
121.5 |
19.2 |
720.0 |
455.7 |
0.0 |
4.1 |
This
summary is based on reports from exporters for the period June 25-July 1, 2021.
Wheat: Net
sales of 290,800 metric tons (MT) were reported for delivery in marketing year 2021/2022. Increases primarily for the Philippines (120,000 MT, including 60,000 MT switched from Indonesia), Mexico (85,500 MT, including decreases of 900 MT), South Korea (82,500
MT), China (69,500 MT, including 65,000 MT switched from unknown destinations), and Taiwan (54,900 MT, including decreases of 900 MT), were offset by reductions primarily for Indonesia (60,000 MT) and unknown destinations (49,900 MT). Exports of 385,100 MT
were primarily to Mexico (85,700 MT, including 100 MT – late), China (67,200 MT), South Korea (55,000 MT), Taiwan (50,900 MT), and Nigeria (46,400 MT).
Late
Reporting:
For 2020/2021, net sales totaling 5,300 MT of durum wheat were reported late for Italy. Exports of 5,300 MT of durum wheat were reported late to Italy and exports of 100 MT of soft red winter wheat were reported late to Mexico.
Corn:
Net sales of 173,200 MT for 2020/2021 were up noticeably from the previous week and up 58 percent from the prior 4-week average. Increases primarily for Mexico (136,600 MT, including decreases of 4,600 MT), Japan (83,000 MT, including 82,600 MT switched from
unknown destinations and decreases of 7,200 MT), Colombia (36,800 MT, including 42,000 MT switched from unknown destinations and decreases of 300 MT), the Dominican Republic (20,200 MT), and Canada (10,600 MT, including decreases of 300 MT), were offset by
reductions primarily for unknown destinations (124,600 MT). For 2021/2022, net sales of 198,200 MT were primarily for Mexico (65,300 MT), South Korea (65,000 MT), Japan (23,200 MT), Taiwan (13,200 MT), and Honduras (8,500 MT). Exports of 1,286,300 MT were
up 13 percent from the previous week, but down 16 percent from the prior 4-week average. The destinations were primarily to China (405,100 MT), Mexico (329,900 MT), Japan (294,700 MT), Saudi Arabia (72,400 MT), and Colombia (58,800 MT).
Optional
Origin Sales:
For 2020/2021, options were exercised to export 65,000 MT to South Korea from other than the United States. The current outstanding balance of 30,500 MT is for unknown destinations. For 2021/2022, the current outstanding balance of 60,000 MT is for unknown
destinations.
Late
Reporting:
For 2020/2021, exports totaling 18,100 MT of corn were reported late to the Dominican Republic.
Barley:
Total net sales for 2020/2021 of 300 MT were for China. Exports of 300 MT were unchanged from the previous week, but up 14 percent from the prior 4-week average. The destination was to Canada.
Sorghum: No
net sales or exports were reported for the week.
Rice:
Net sales of 19,900 MT for 2020/2021 were up 27 percent from the previous week, but down 51 percent from the prior 4-week average. Increases primarily for Nicaragua (10,000 MT), Jordan (3,200 MT), Saudi Arabia (1,600 MT), Canada (1,400 MT), and Guatemala
(1,000 MT), were offset by reductions for Honduras (500 MT). Total net sales reductions for 2021/2022 of 300 MT were for Taiwan. Exports of 34,100 MT were down 50 percent from the previous week and 47 percent from the prior 4-week average. The destinations
were primarily to Japan (15,700 MT), Honduras (5,500 MT), Mexico (2,600 MT), South Korea (2,400 MT), and Canada (2,200 MT).
Exports
for Own Account:
For 2020/2021, the current exports for own account outstanding balance is 100 MT, all Canada.
Soybeans:
Net sales of 63,800 MT for 2020/2021 were down 31 percent from the previous week and 19 percent from the prior 4-week average. Increases primarily for Mexico (38,000 MT, including 47,500 MT switched from unknown destinations and decreases of 13,100 MT), Japan
(37,700 MT, including 18,800 MT switched from unknown destinations and decreases of 9,300 MT), China (18,100 MT, including decreases of 1,300 MT), Taiwan (16,900 MT), and Colombia (12,400 MT, including 11,500 MT switched from unknown destinations and decreases
of 300 MT), were offset by reductions primarily for unknown destinations (77,500 MT). For 2021/2022, net sales of 118,500 MT were primarily for Japan (77,800 MT), unknown destinations (20,100 MT), Colombia (15,000 MT), Malaysia (3,000 MT), and Taiwan (2,000
MT). Exports of 221,200 MT were up 49 percent from the previous week and 8 percent from the prior 4-week average. The destinations were primarily to Mexico (91,700 MT), Japan (44,900 MT), Colombia (19,000 MT), Indonesia (15,600 MT), and Costa Rica (13,100
MT).
Exports
for Own Account:
For 2020/2021, the current exports for own account outstanding balance is 5,800 MT, all Canada.
Soybean
Cake and Meal:
Net sales of 211,800 MT for 2020/2021 were down 9 percent from the previous week and from the prior 4-week average. Increases primarily for Japan (62,700 MT), Colombia (45,100 MT), Poland (30,000 MT), Mexico (25,600 MT, including decreases of 9,400 MT), and
Ecuador (9,500 MT), were offset by reductions primarily for the Dominican Republic (1,000 MT). For 2021/2022, net sales of 55,800 MT were reported for Ecuador (30,000 MT), the Philippines (25,000 MT), and Canada (800 MT). Exports of 170,000 MT were up noticeably
from the previous week, but unchanged from the prior 4-week average. The destinations were primarily to the Philippines (48,100 MT), Mexico (38,200 MT), Canada (23,000 MT), Honduras (21,900 MT), and the Dominican Republic (13,000 MT).
Soybean
Oil:
Net sales reductions of 400 MT for 2020/2021 were down noticeably from the previous week and from the prior 4-week average. Increases for Canada (2,300 MT) and Mexico (300 MT), were more than offset by reductions for Colombia (3,000 MT). Exports of 4,500
MT were up noticeably from the previous week, but down 48 percent from the prior 4-week average. The destinations were to Venezuela (3,000 MT), Mexico (1,000 MT), and Canada (400 MT).
Cotton:
Net sales of 52,100 RB for 2020/2021 were up 22 percent from the previous week, but down 38 percent from the prior 4-week average. Increases primarily for Pakistan (24,000 RB, including 600 RB switched from the United Arab Emirates and decreases of 300 RB),
China (7,400 RB, including decreases of 200 RB), Vietnam (4,700 RB, including 900 RB switched from China and decreases of 1,100 RB), Turkey (4,500 RB, including decreases of 1,500 RB), and South Korea (4,400 RB, including decreases of 100 RB), were offset
by reductions for the United Arab Emirates (600 RB) and Ecuador (300 RB). For 2021/2022, net sales of 177,000 RB were primarily for Pakistan (58,500 RB), Turkey (32,800 RB), El Salvador (20,900 RB), Indonesia (19,100 RB), and Thailand (11,900 RB). Exports
of 294,800 RB were up 8 percent from the previous week and 13 percent from the prior 4-week average. Exports were primarily to Vietnam (71,300 RB), Pakistan (58,600 RB), China (42,400 RB), Turkey (42,300 RB), and Mexico (31,800 RB). Net sales of Pima totaling
5,400 RB were up noticeably from the previous week and up 24 percent from the prior 4-week average. Increases were primarily for Thailand (2,100 RB), Peru (2,000 RB), and Pakistan (900 RB). Exports of 19,200 RB were up 84 percent from the previous week and
42 percent from the prior 4-week average. The destinations were primarily to India (7,000 RB), Pakistan (4,300 RB), China (3,700 RB), Vietnam (2,200 RB), and Peru (1,200 RB).
Exports
for Own Account:
For 2020/2021, the outstanding balance of 4,700 RB is for China.
Hides
and Skins:
Net sales of 397,400 pieces for 2021 were down 59 percent from the previous week and 23 percent from the prior 4-week average. Increases were primarily for China (234,000 whole cattle hides, including decreases of 9,400 pieces), South Korea (55,200 whole
cattle hides, including decreases of 3,600 pieces), Ethiopia (39,200 whole cattle hides), Mexico (34,700 whole cattle hides, including decreases of 3,000 pieces), and Brazil (11,700 whole cattle hides). Net sales of 1,000 kip skins, resulting in increases
for China (1,300 kip skins), were offset by reductions for Belgium (300 kip skins). Exports of 385,400 pieces were up 10 percent from the previous week and from the prior 4-week average. Whole cattle hides exports were primarily to China (258,900 pieces),
South Korea (46,900 pieces), Thailand (29,300 pieces), Mexico (25,000 pieces), and Brazil (8,800 pieces). In addition, exports of 2,600 kip skins were to Belgium.
Net
sales of 121,000 wet blues for 2021 were up 6 percent from the previous week, but down 4 percent from the prior 4-week average. Increases primarily for Italy (58,000 unsplit), China (24,400 unsplit), Vietnam (22,700 unsplit), Taiwan (11,900 unsplit), and
Brazil (4,000 unsplit), were offset by reductions for Thailand (100 unsplit). Exports of 118,400 wet blues were down 24 percent from the previous week and 19 percent from the prior 4-week average. The destinations were to China (32,000 unsplit), Vietnam
(28,500 unsplit), Italy (19,800 unsplit and 3,200 grain splits), Thailand (19,900 unsplit), and Mexico (8,200 grain splits and 6,800 unsplit). Net sales of 90,500 splits reported for China (47,200 pounds, including decreases of 1,400 pounds) and Taiwan (43,300
pounds). Exports of 320,000 pounds were to Vietnam (200,000 pounds) and China (120,000 pounds).
Beef:
Net
sales of 23,700 MT reported for 2021 were up 96 percent from the previous week and 64 percent from the prior 4-week average. Increases were primarily for South Korea (10,400 MT, including decreases of 400 MT), Japan (5,800 MT, including decreases of 400 MT),
China (2,700 MT, including decreases of 100 MT), Mexico (1,500 MT), and Canada (700 MT, including decreases of 100 MT). Total net sales for 2022 of 100 MT were for Japan. Exports of 17,800 MT were down 6 percent from the previous week and from the prior
4-week average. The destinations were primarily to Japan (5,000 MT), South Korea (4,700 MT), China (3,200 MT), Taiwan (1,100 MT), and Mexico (1,000 MT).
Pork:
Net
sales of 43,800 MT reported for 2021 were up 53 percent from the previous week and 65 percent from the prior 4-week average. Increases primarily for China (16,300 MT, including decreases of 300 MT), Mexico (13,800 MT, including decreases of 600 MT), Japan
(8,400 MT, including decrease of 200 MT), Colombia (1,800 MT, including decreases of 100 MT), and Canada (1,700 MT, including decreases of 400 MT), were offset by reductions for Nicaragua (100 MT), New Zealand (100 MT), and Australia (100 MT). Exports of
30,500 MT were down 6 percent from the previous week and 7 percent from the prior 4-week average. The destinations were primarily to Mexico (13,000 MT), China (6,500 MT), Japan (3,100 MT), South Korea (2,400 MT), and Canada (1,500 MT).
Terry Reilly
Senior Commodity Analyst – Grain and Oilseeds
Futures International
One Lincoln Center
18 W 140 Butterfield Rd.
Oakbrook Terrace, Il. 60181
W: 312.604.1366
ICE IM:
treilly1
Skype: fi.treilly

Trading of futures, options, swaps and other derivatives is risky and is not suitable for all persons. All of these investment products are leveraged, and you can lose more than your initial deposit. Each investment product is offered
only to and from jurisdictions where solicitation and sale are lawful, and in accordance with applicable laws and regulations in such jurisdiction. The information provided here should not be relied upon as a substitute for independent research before making
your investment decisions. Futures International, LLC is merely providing this information for your general information and the information does not take into account any particular individual’s investment objectives, financial situation, or needs. All investors
should obtain advice based on their unique situation before making any investment decision. The contents of this communication and any attachments are for informational purposes only and under no circumstances should they be construed as an offer to buy or
sell, or a solicitation to buy or sell any future, option, swap or other derivative. The sources for the information and any opinions in this communication are believed to be reliable, but Futures International, LLC does not warrant or guarantee the accuracy
of such information or opinions. Futures International, LLC and its principals and employees may take positions different from any positions described in this communication. Past results are not necessarily indicative of future results.