PDF Attached
MARKET
WEATHER MENTALITY FOR CORN AND SOYBEANS:
- U.S.
crop weather remains mostly good and should stay that way through the next ten days. Southeastern Canada’s crop conditions will remain mostly good. Canola in Canada’s Prairies varies from being too wet in the west to too dry in parts of the east. Rain will
fall periodically in the Prairies over the next couple of weeks, but the rain will be erratic enough to leave some of the drier areas in need of more moisture.
- India’s
planting weather for coarse grain and oilseeds will be good over the next couple of weeks. Relief to dryness in east-central China last week has improved summer crop prospects in some areas. However, net drying in parts of the North China Plain and northern
Yellow River Basin this week will raise unirrigated crop stress. Flooding in rapeseed areas recently may have reduced crop quality and certainly delayed harvesting.
- Australia’s
weather will be favorable for canola areas over the next ten days. South Africa’s western canola benefited from some rain during the weekend, but more is needed.
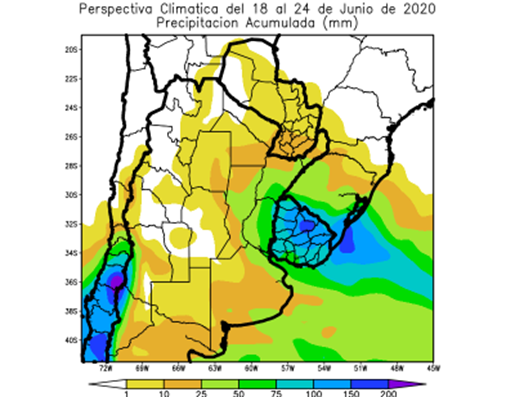
- Argentina’s
harvest has advanced well recently and will continue to move forward around periods of rain. Brazil’s Safrinha corn is maturing, although some late season filling occurred while dryness prevailed resulting in greater worry over late season yield and quality
declines. Brazil’s weather has not been seriously impacting late season crops, but some small impact is expected. - Europe
weather has been favorable for most crops. Some drier and warmer weather in the next week to ten days will be welcome in the wetter areas, but might drying a few locations in the northwest enough to raise some short term concern.
- Net
drying from the Volga River Basin into Kazakhstan could harm some summer coarse grain and oilseed crops if the trends last deeply into the summer.
- Overall,
weather will likely have a bearish bias to market mentality because of anticipated better U.S. weather and the National Weather Service outlook still calling for wetter biased conditions for the next 90 days across the lower Midwest, Delta and southeastern
states.
MARKET
WEATHER MENTALITY FOR WHEAT:
- Periodic
rain in Canada’s Prairies and eventually in the U.S. northern Plains will bring a little improvement to small grain crops, but more rain will be needed. Eastern and far south-central Saskatchewan and parts of Manitoba are still quite dry along with western
North Dakota and eastern Montana. Additional opportunity for rain will evolve later this week for some of the drier areas. In the meantime, parts of Alberta are still too wet and will stay that way for a while this week.
- Quebec
and eastern Ontario crop conditions will be mostly good over the next ten days. - Good
harvest weather is expected in U.S. hard red winter wheat areas and a favorable environment for late season filling will occur in Nebraska, northern Kansas as well as across the Midwest this week. Wetter conditions next week could interfere with some farming
activity. - Europe
weather will be mostly good for winter crops, although there may be some need for drier weather in early maturing crop areas to protect small grains from wet weather disease. Drying from the Volga River Basin into Kazakhstan may be a threat to unirrigated
winter crops, but most of the region’s crops are still rated favorably today. Spring wheat areas in the eastern Russia New Lands are also experiencing mostly favorable conditions, but some rain is needed near the Kazakhstan border.
- China’s
southern wheat quality may be slipping because of recent heavy rainfall. Drier weather will be slow to return and that may prolong harvest delays and concern over grain quality.
- Australia’s
recent rain was good for improving establishment for wheat and barley across the nation, although more rain is still needed in many areas.
- South
Africa recent rain in the far west was welcome, but rain is needed in other winter crop production areas. Rain coming up in Argentina during mid-week this week will be a tremendous help for wheat germination and emergence.
- Overall,
weather today will likely provide a mixed influence on market mentality.
Source:
World Weather Inc. and FI
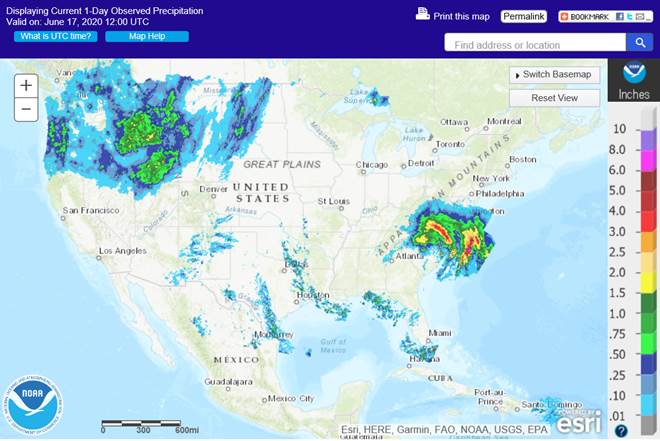
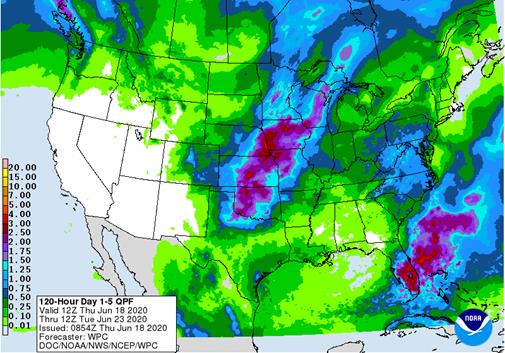
WPC
5-day Quantitative Precipitation Forecast
- JULY-AUGUST-SEPTEMBER
OUTLOOK PREDICTS LIKELY ABOVE NORMAL TEMPERATURES ACROSS ALASKA AND MOST OF THE CONTIGUOUS U.S. - JULY-AUGUST-SEPTEMBER
OUTLOOK PREDICTS ABOVE NORMAL PRECIPITATION TO BE LIKELY FOR SOUTHERN REGIONS OF ALASKA, INCLUDING ALEUTIAN ISLANDS AND ALASKA PANHANDLE - ABOVE
NORMAL PRECIPITATION IS ALSO LIKELY FOR MUCH OF EASTERN CONTIGUOUS U.S. - BELOW
NORMAL PRECIPITATION LIKELY FOR MUCH OF PACIFIC NORTHWEST, NORTHERN AND CENTRAL ROCKIES, PARTS OF NORTHERN GREAT BASIN, NORTHEAST REGIONS OF FOUR CORNERS REGION


FRIDAY,
June 19:
- ICE
Futures Europe weekly commitments of traders report, 1:30pm (6:30pm London) - CFTC
commitments of traders weekly report on positions for various U.S. futures and options, 3:30pm - FranceAgriMer
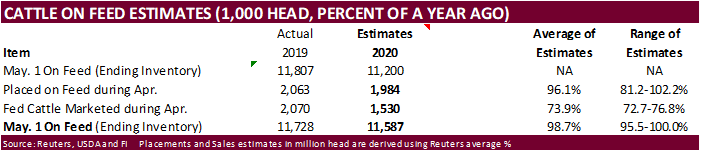
weekly update on crop conditions - U.S.
Cattle on Feed, 3pm
SATURDAY,
June 20:
- Malaysia’s
palm oil export data for June 1-20
Source:
Bloomberg and FI
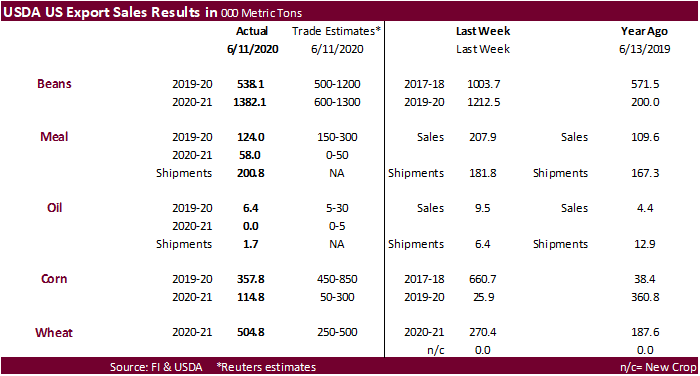
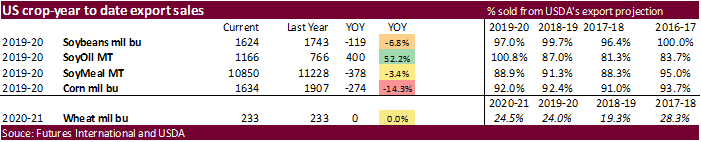
USDA
export sales
-
Soybean
export sales were within expectations, meal below, and soybean oil lower end of expectations.
-
China
took 320k old crop and 1.033MMT of new crop soybeans. -
Corn
export sales were poor along with sorghum. -
All-wheat
export sales topped expectations. -
Pork
sales were 38,600 tons, good in our opinion.
·
US Initial Jobless Claims Jun-13: 1508K (exp 1290K; R prev 1566K)
–
Continuing Claims Jun-6: 20544M (exp 19850K; R prev 20606K)
·
US Philadelphia Fed Business Index Jun: 27.5 (exp -23.0; prev -43.1)
·
Canadian Wholesale Trade (M/M) Apr: -21.6% (exp -12.6%; prev -2.2%)
·
Canadian New Housing Price Index May: 0.1% (prev 0.0%)
·
Canadian ADP Revises April Job Loss To 2.4Mln From 226.7K
–
Employment Rose 208.4K In May
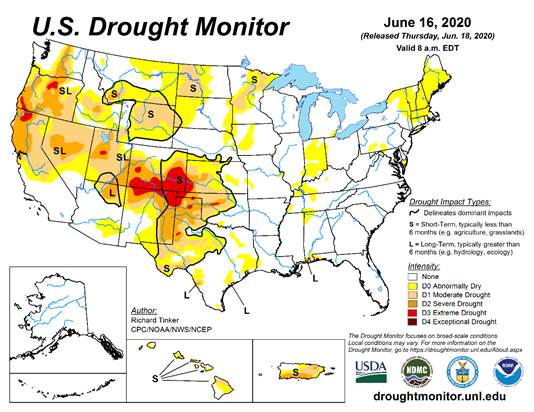
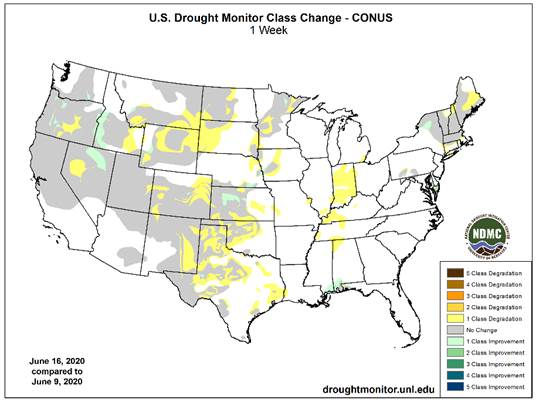
Corn.
·
Corn ended slightly higher on drought expansion shown on today’s US Drought Monitor. While the week ahead sees no issues, the market was showing concerns over the worsening conditions. This puts
more eyes on Monday’s USDA Crop Conditions Report.
·
Heat across the western Corn Belt is supporting corn futures. We estimate managed money was net short 292,000 contracts headed into today.
·
Funds were net buyers of 1,000 corn contracts on the session.
·
China corn futures remain near a 5-year high despite corn reserve sales.
·
China sold nearly 4 million tons of mostly 2015 crop-year corn from reserves on Thursday, bringing sales over a 4-week period to nearly 16MMT. Sinograin will about 663,000 tons from the 2016 harvest
on Friday.
-
The
U.S. generated 840 million ethanol (D6) blending credits during the month of May, up from 645 million during April.
·
USDA Cattle on Feed is due out at the end of the week. USDA May Cattle on Feed survey is calling for a 26.1% drop in marketings as meat plants slowed due to COVID-19.
·
The weekly USDA Broiler Report showed eggs set in the United States up 2 percent and chicks placed down 1 percent. Cumulative placements from the week ending January 4, 2020 through June 13, 2020
for the United States were 4.45 billion. Cumulative placements were down 1 percent from the same period a year earlier.
Corn
Export Developments
-
South
Korea’s FLC seeks 69,000 tons of corn for October shipment.
-
CBOT
soybeans finished higher soy exports and on weather the past week that has shown drought expansion across the Corn Belt. -
Heat
projected for the WCB and talk of China buying US agriculture products, including soybeans also underpinned the market.
-
The
soybean curve appears flattened out, despite China buying for November-January arrival. Large US production prospects are part of the reason. For the front month it could be related to lack of producer selling.
-
Funds
were net buyers of 2,000 soybeans and 2,000 soybean meal, and sellers of 1,000 soybean oil on the session. -
The
U.S. generated 369 million D4 blending credits during the month of May, up from 357 million during April.