PDF Attached


USDA’s
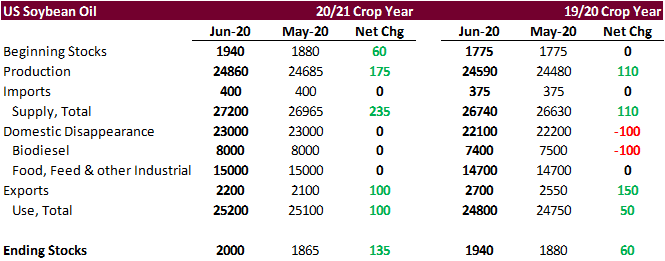
largest surprise today was likely in US soybean oil stocks.  USDA reported 720,000 tons of soybeans were sold to China.  USDA due out later.   China S&D’s unchanged for 2020-21.  USD is higher and WTI crude sharply lower.  US Dow futures are down nearly 900
points.  The US Fed estimates a three-year recovery in GDP. 


USDA
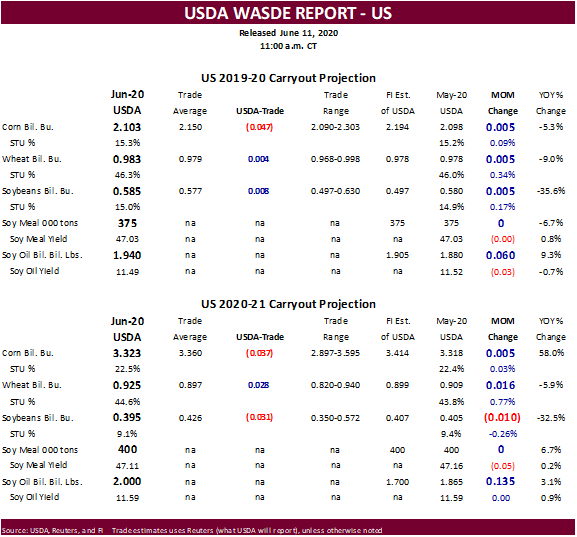
released it June report update 


Initial
reaction:

Bearish
soybean oil and wheat.  Bull spreading corn justified with change in 2019-20 and 2020-21 US ending stocks.

USDA
NASS and OCE executive summaries

https://www.nass.usda.gov/Newsroom/Executive_Briefings/index.php

https://www.usda.gov/oce/commodity/wasde/Secretary_Briefing/index.htm


  • USDA
    increased 2020 US wheat production by 27 million bushels by increasing HRW by 25 million and winter white by a small amount.
  • US
    all wheat ending stocks were taken up 16 million bushels to 925 million, 6 percent below 2019-20.

<![if !supportLists]>·
<![endif]>US 2019-20 corn ending stocks came in 47 million bushels below trade expectations at 2.103 billion, 5 million above the previous month, promoting bull spreading. This is because new-crop US corn stocks of 3.323 billion ended up
37 million bushels below an average trade guess.  US corn for ethanol for 2019-20 was

<![if !supportLists]>·
<![endif]>US new-crop (2020-21) soybean oil stocks were upward revised 135 million pounds, the biggest surprise in this report, in our opinion.  USDA took the 2019-20 soybean crush up 15 million bushels and to compliment new-crop, they
raised 2020-21 US crush by 15.  This added a combined 285 million pounds of soybean oil to supply.  At 2.0 billion pounds ending stocks for 2020-19 and 2019-20 stocks forecast at 1.940 million, soybean oil prices fell further late this morning.  USDA increased
2019-20 US soybean oil exports by 150 million pounds and raised new-crop exports by 100 million.  Biodiesel was again cut by USDA for 2019-20, this time by 100 million pounds to 7.500 billion, too low in our opinion.

<![if !supportLists]>·
<![endif]>US soybean stocks for 2019-20 were near expectations and new-crop were reported 31 million below the trade guess. USDA lowered 2019-20 US soybean exports by 25 million to reflect higher Brazilian exports.

<![if !supportLists]>·
<![endif]>There was no change in soybean meal stocks by USDA increased domestic use for 2019-20 by 400,000 short tons and raised new-crop by 300,000 short tons.

<![if !supportLists]>·
<![endif]>2019-20 world ending stocks for corn and soybeans tightened slightly, and world wheat was up slightly.  USDA took 2019-20 Brazil soybean exports up 1 million tons to 85 million tons.

<![if !supportLists]>·
<![endif]>New-crop world wheat stocks increased 6.0MMT to 310 million, 6.8 percent higher than end of 2019-20.  India’s wheat production was upward revised a large 4.2 million tons to 107.2 million tons, and if the government provides an
incentive for exporters, India could easily contribute to the world trade.


Weather


MARKET
WEATHER MENTALITY FOR CORN AND SOYBEANS:
 Once remnants of Tropical Depression Cristobal leave the Corn Belt, net drying is expected for a while. Soil moisture will be favorable for good crop development in most areas, although slowly declining soil
moisture in the eastern Midwest, the far southwestern Corn Belt and parts of the Tennessee River Basin will be closely monitored. Timely rain will be very important for all of these areas late this month and in July.


Canada’s Prairies are too wet in the west and a little too dry in parts of the south-central and east.  Some canola and other late season planting has stopped in the wetter areas of Alberta and those fields may be abandoned because of too much moisture and
the lateness of the season. Rain in the eastern Prairies late this weekend into early next week may offer some relief.


South America weather remains mostly good for maturing crops and their harvest. Dryness in some eastern and northern Safrinha crops may have harmed late season yields. Argentina’s harvesting will continue aggressively, although rain in the east will induce
some disruption.


Rain is needed in South Africa and Australia to improve canola planting conditions. Some rain is expected in Australia beginning in the west today and reaching the east Friday into Saturday.


Philippines rainfall is being boost by a tropical disturbance with additional dryness relief expected in Luzon Island over the next few days.

Most
of Malaysia and Indonesia rainfall is still rated favorably and likely to prevail for a while.


Europe weather will remain mostly good for coarse grain and oilseed development, although some additional warming is needed in Eastern Europe and a boost in rain is still needed in France, parts of the U.K. and Germany. Some of that needed rain is coming.


Drying in Russia’s Southern Region, Kazakhstan and central and eastern Ukraine will raise some interest for soybeans, corn and sunseed development, but the region is not too dry today except in parts of Kazakhstan and eastern parts of Russia’s Southern Region.


Overall, weather today will likely have a mixed influence on market mentality.


MARKET
WEATHER MENTALITY FOR WHEAT:
 Too
much rain recently in Alberta, Canada has raised concern over small grain conditions and additional rain slated for the next several days will induce some additional concern and crop damage. Eastern parts of the Prairies may get some needed rain late this
weekend into early next week, but many areas will be looking for greater rain.


U.S. hard red winter wheat is finishing out relatively well, but dryness and frost damage in the southwestern Plains has left production low in some areas. Rain in Nebraska, parts of Kansas and a few Colorado locations earlier this week benefited late season
crop development.


Rain in Europe has improved small grain conditions in recent weeks, although there is need for more rain in France, the U.K. and parts of Germany. Eastern Europe would benefit from some warmer temperatures.  Spring cereals are still rated favorably in many
areas outside of northwestern Europe with little change expected through the coming week. There will be some interest in eastern Russia’s spring wheat as time moves along this summer, but for now the environment is still mostly good. Net drying in central
and eastern Ukraine will raise some concern over small grain crop conditions later this month, but conditions today are still good.


Australia’s rain event expected from west to east over the next few days should improve some crops, but there will be an ongoing need for greater moisture.  A follow up rain event in the west during mid-week next week will improve some crops.

South
Africa and parts of Argentina still need greater rainfall to support wheat planting and establishment. Eastern Argentina wheat areas should get some beneficial rain next week.


Overall, weather today will likely provide a mixed influence on market mentality.

Source:
World Weather Inc. and FI


CPC
sees a 60 percent chance of a neutral weather through the summer (NH)


<![if !vml]>30-day outlook - Temperature Probability<![endif]><![if !vml]>30-day outlook - Precipitation Probability<![endif]>


Bloomberg
Ag Calendar


THURSDAY,
June 11:

  • USDA’s
    monthly World Agricultural Supply and Demand (Wasde) report, noon
  • USDA
    weekly crop net-export sales for corn, soybeans, wheat, cotton, 8:30am
  • China
    CASDE monthly crop supply and demand report
  • Vietnam’s
    coffee, rice and rubber export data for May
  • Malaysian
    Palm Oil Council webinar: Palm oil in post- pandemic
  • HOLIDAY:
    Brazil

FRIDAY,
June 12:

  • ICE
    Futures Europe weekly commitments of traders report on coffee, cocoa, sugar positions
  • CFTC
    commitments of traders weekly report on positions for various U.S. futures and options, 3:30pm
  • FranceAgriMer
    weekly update on crop conditions
  • New
    Zealand food prices
  • Shanghai
    exchange’s weekly commodities inventory
  • HOLIDAY:
    Russia

Source:
Bloomberg and FI


Macros


<![if !supportLists]>·
<![endif]>US Dow futures are sharply lower, USD higher and WTI more than $2.50 lower

<![if !supportLists]>·
<![endif]>livesquawk US Initial Jobless Claims Jun 6: 1542K (est 1550K; prevR K; prevR 1897K; prev 1877K)

US
Continuing Claims May 30: 20929K (est 20000K; prevR K; prevR 21268K; prev 21487K)

<![if !supportLists]>·
<![endif]>US PPI Final Demand (M/M) May: 0.4% (est 0.1%; prev -1.3%)

US
PPI Ex Food &amp; Energy (M/M) May: -0.1% (est -0.1%; prev -0.3%)

US
PPI Ex Food, Energy, Trade (M/M) May: 0.1% (est -0.1%; prev -0.9%)

<![if !supportLists]>·
<![endif]>US PPI Final Demand (Y/Y) May: -0.8% (est -1.2%; prev -1.2%)

US
PPI Ex Food &amp; Energy (Y/Y) May: 0.3% (est 0.4%; prev 0.6%)

US
PPI Ex Food, Energy, Trade (Y/Y) May: -0.4% (est -0.6%; prev -0.3%)


Corn.

<![if !supportLists]>·
<![endif]>Corn ended higher on short covering.  This started before the USDA report and traders continues to unwind short positions afterwards.  Despite plunging US stock markets, $3.85 decline in WTI crude oil (2:29 pm CT), and favorable
rain over the past three days across the US Corn Belt, corn managed to climb, which is rare to see.   Some of the rally was related to the US outlook calling for dry weather for at least the next seven days. Some areas of the WCB that missed out on the rains
from the tropical depression earlier this week may see crop stress.  USDA’s S&D update was uneventful for corn, so traders shifted their focus on weather.  We still look for a record corn crop even if conditions come off 3-5 points over the next two weeks.
Goldman Roll ended today. 

<![if !supportLists]>·
<![endif]>USDA export sales corn of 660,700 tons old crop were within expectations. New -crop sales were a poor 25,900 tons.  China bought a cargo of sorghum.  Pork sales were 17,200 tons with Mexico and Canada as largest buyers.

<![if !supportLists]>·
<![endif]>China made no changes to their 2020-21 corn projections in their monthly CASDE report, but they lowered its forecast for 2019-20 corn industrial consumption by 500,000 tons to 82 million tons, down 500,000 tons from last month
on rising corn costs. 


<![if !supportLists]>·
<![endif]>China corn futures are trading around their highest values in a month.

<![if !supportLists]>·
<![endif]>China nearly sold all of its 4 million tons of corn offered from state reserves. Total sales are just under 12 million tons.

  • China
    said they are close to making an effective vaccine for African swine fever. 


Corn
Export Developments


  • None
    reported


July
corn is seen in a $3.20 and $3.40 range.  December lows could reach $2.90 if US weather cooperates.


Soybean
complex
.

    • CBOT
      soybeans saw a two-sided trade, ending moderately higher in the nearby months and slightly lower in the back months.  Soybean meal ended $0.90-1.00 higher and soybean oil was down 47-50 points after USDA increased their new-crop soybean oil carryout by 135
      million pounds to 2.0 billion.   Soybeans were supported by soybeans sales to China.
    • USDA
      export sales for soybeans of 1.004 million tons old crop and 1.213 million new-crop were excellent. China bought 337,000 tons of soybeans.  Soybean meal sales of 207,900 tons were within expectations and shipments were decent at 181,800 tons.  Soybeans oil
      sales were only 9,500 tons and shipments plunged to 6,400 tons from 75,900 tons previous week.
    • Under
      the 24-hour announcement system, US exporters sold 720,000 tons of soybeans to China, of which 63,000 tons are for 2019-20 and 657,000 tons for new crop.
    • But
      on Friday China backed off buying US soybeans.  Bearish outside commodity markets capped gains.  Meal and oil are lower. Support in July SBO is seen at 27.50, where the contract settled today.
    • Rumors
      for China purchases of US soybeans are up to ten cargoes for the week. 
    • China
      made no changes to its soybean balance sheets for 2019-20 and 2020-21.  They did lower 2019-20 edible oils production for 2019-20 by 40,000 tons to 26.43 million tons, nearly unchanged from 2018-19.


  • China
    soybeans were up 0.7 percent Thursday, or 33 yuan/ton, after rising 2.2 percent Wednesday and 2.4 percent on Tuesday.


<![if !supportLists]>·
<![endif]>China: Soybean futures highest since April


  • APK-Inform
    2019-20 Ukraine sunflower oil production was increased 100,000 tons to 6.7 million tons, based on a 15.2-million-ton estimate, up from 15 million for 2018-19.

<![if !supportLists]>·
<![endif]>Indian Vegetable Oil Producers Association (IVPA) estimated 2020 Indonesia palm oil production up 3% 46,475,000 tons from the previous year and Malaysian palm oil output down 3% to 19,211,000 tons.
The Malaysian Palm Oil Council looks for an improvement in palm oil exports due to price discounts and smaller than average EU rapeseed crop.


Oilseeds
Export Developments


  • Under
    the 24-hour announcement system, US exporters sold 720,000 tons of soybeans to China, of which 63,000 tons are for 2019-20 and 657,000 tons for new crop.
  • China’s
    Sinograin will sell 60,486 tons of domestic 2017 soybeans from reserves on Friday, out of Heilongjiang.
  • Syria
    will retender for 50,000 tons of soymeal and 50,000 tons of corn on June 24 for delivery within four months of contract.


  • July
    soybeans are seen in a $8.44-$8.85 range. 
  • July
    soybean meal is seen in a $280 to $310 range. 
  • July
    soybean oil range is seen in a 26.75 to 28.25 range
    .


Wheat


  • US
    wheat futures ended sharply lower on a nearly 80 point higher USD, upward revision to global ending wheat stocks by 6 million tons and lower outside markets.  Upward revisions to Russia’s wheat crop and export prospects were also weighing on prices.
  • USDA
    all wheat export sales were 270,400 tons, high end of expectations.  2019-20 ended up at 988.3 million bushels, below 949.5 million year earlier and 871.7 million year before that. 2020-21 sales total 214.1 million bushels versus 225.9 million year ago.
  • China’s
    Ministry of Agriculture and Rural Affairs reported wheat harvest progress at around 11.3 million hectares as of June 5, or 50 percent of the planned area. Progress is about three days ahead last year.
  • Argentina’s
    Rosario grains exchange warned dryness across the central agricultural region may threaten prediction that farmers will sow a record 7 million hectares of wheat in 2020-21 cycle.  7 million hectares could yield 22 million tons.
  • IKAR
    revised their Russia wheat export estimate for 2020-21 to 35 million tons, up 1 million from previous.
  • Paris
    December wheat was down 2.25 euros at 184.75.
  • France’s
    Rouen Grain Exports Rose 6.9% in Week to June 10 – Bloomberg
  • Strategie
    Grains lowered their EU soft wheat crop 2 million tons from last month to 130.9 million tons, 11% below last year’s output.  Table is attached after the text.


Export
Developments.


  • Tunisia
    bought only 25,000 tons of soft wheat and 50,000 tons of feed barley.  They were in for 134,000 tons of soft wheat and 100,000 tons of feed barley for shipment between July 15 and September 25 shipment.  The soft wheat was bought at $215.90 a ton c&f. The
    barley was bought at $194.89 and $196.25 a ton c&f.
  • Saudi
    Arabia seeks 960,000 tons of barley for arrival between August and September.
  • Yesterday
    Egypt bought 120,000 tons of Russian wheat for July 12-22 shipment at $316.90 to $217.59 per ton plus freight.
  • Japan
    seeks 80,000 tons of feed wheat and 100,000 tons of feed barley on June 17 for arrival by November 26.
  • Jordan
    seeks 120,000 tons of wheat on June 17 for November-December shipment. 


Rice/Other

  • CBOT
    July rice continued to weaken against the September contract.
  • Vietnam’s
    May Rice Exports Highest Since 2009 After Limits End – Bloomberg

    • Jan-May
      exports were 3.09MMT, up 12.2% from last year.  May alone was up 87% yoy.
  • South Korea’s Agro-Fisheries
    and Food Corp seeks 80,605 tons of non-glutinous rice for October 2020 and March 2021 shipment.

    TONNES(M/T)
GRAIN TYPE    ORIGIN    ARRIVAL/PORT


90     Milled Long   Thailand  Oct 31,2020/Busan


1,410     Milled Long   Thailand  Oct 31,2020/Busan


20,000     Brown Short   China     Jan 31,2021/Gunsan


20,000     Brown Short   China     Jan 31,2021/Ulsan


20,000     Brown Short   China     March 31,2021/Donghae


19,105     Brown Short   China     March 31,2021/Mokpo


  • Chicago July is seen in a $4.80-$5.05 range
  • KC July $4.35-$4.65
  • MN July $5.00-$5.25


  U.S. EXPORT SALES FOR WEEK ENDING 6/4/2020


CURRENT MARKETING YEAR

NEXT MARKETING YEAR

COMMODITY

NET SALES

OUTSTANDING SALES

WEEKLY EXPORTS

ACCUMULATED EXPORTS

NET SALES

OUTSTANDING SALES

CURRENT YEAR

YEAR
AGO

CURRENT YEAR

YEAR
AGO

WHEAT

THOUSAND METRIC TONS

   HRW    

106.8

1,976.3

2,429.7

121.8

121.8

191.3

0.0

0.0

   SRW    

0.1

529.5

853.8

2.1

2.1

30.0

0.0

0.0

   HRS     

114.1

1,751.9

1,347.4

18.0

18.0

78.2

0.0

0.0

   WHITE   

47.9

1,136.5

948.0

9.0

9.0

57.5

0.0

0.0

   DURUM  

1.4

261.9

189.1

21.4

21.4

23.1

0.0

0.0

     TOTAL

270.4

5,656.1

5,768.0

172.4

172.4

380.1

0.0

0.0

BARLEY

0.0

40.2

50.0

0.5

0.5

0.5

0.0

0.0

CORN

660.7

10,880.7

7,147.6

1,241.2

30,252.2

41,259.1

25.9

3,438.4

SORGHUM

69.7

1,160.3

415.6

230.3

2,856.1

1,144.4

83.0

278.0

SOYBEANS

1,003.7

7,442.4

11,266.1

292.6

36,218.6

35,652.7

1,212.5

4,152.3

SOY MEAL

207.9

2,446.1

2,687.8

181.8

8,280.0

8,430.6

-19.0

285.9

SOY OIL

9.5

260.8

151.0

6.4

898.8

610.7

0.0

11.0

RICE


   L G RGH

-57.5

187.2

203.6

6.5

1,216.7

1,143.3

57.0

57.0

   M S RGH

5.7

36.9

15.9

1.4

65.3

81.2

0.0

0.0

   L G BRN

0.1

12.6

3.4

0.1

55.2

37.7

0.0

0.0

   M&S BR

0.0

41.4

2.7

1.2

77.4

144.2

0.0

0.0

  L G MLD

21.3

46.3

181.0

21.3

819.4

752.2

0.0

0.0

   M S MLD

12.9

163.1

144.7

18.8

564.1

494.3

0.0

0.0

     TOTAL

-17.5

487.5

551.3

49.4

2,798.0

2,652.9

57.0

57.0

COTTON


THOUSAND RUNNING BALES


   UPLAND

399.6

5,115.6

4,519.4

294.3

11,609.7

10,649.0

193.4

3,027.7

   PIMA

3.4

132.2

163.2

14.7

428.5

553.3

0.1

33.9


Export Sales Highlights 

This
summary is based on reports from exporters for the period May 29-June 4, 2020.


  • Wheat:  Net
    sales for the 2020/2021 marketing year, which began June 1, totaled 270,400 MT metric tons, resulting increases for Guatemala (96,000 MT), the Philippines (71,500 MT), Indonesia (66,200 MT, including 12,200 MT switched from unknown destinations and decreases
    of 1,000 MT), China (63,000 MT, including 60,000 MT switched from unknown destinations), and Colombia (29,800 MT, including 27,200 RB switched from unknown destinations.  Reductions were for unknown destinations (160,400 MT) and South Africa (40,000 MT).
    A total of 2,088,000 MT in sales were carried over from the 2019/2020 marketing year, which ended May 31.  Exports for the period ending May 31, of 334,900 MT brought accumulated exports to 24,812,200 MT, up 2 percent from the prior year’s total of 24,231,600
    MT.  The primary destinations were primarily the Philippines (76,100 MT), Nigeria (48,700 MT), South Africa (44,000 MT), Guatemala (40,300 MT), and Indonesia (33,100 MT).  Exports for June 1- 4, totaled 172,400 MT, with China (63,000 MT), Colombia (29,500
    MT), Italy (21,400 MT), Vietnam (20,600 MT), and Mexico (13,500 MT) being the primary destinations.
  • Corn:
    Net sales of 660,700 MT for 2019/2020 were up 4 percent from the previous week, but down 12 percent from the prior 4-week average.  Increases primarily for Japan (266,900 MT, including 95,300 MT switched from unknown destinations and decreases of 5,100 MT),
    Colombia (128,700 MT, including 25,000 MT switched from unknown destinations and decreases of 900 MT), South Korea (114,800 MT, including decreases of 7,000 MT), Mexico (90,200 MT, including decreases of 132,300 MT), and Saudi Arabia (59,500 MT, including
    63,000 MT switched from unknown destinations and decreases of 3,500 MT), were offset by reductions primarily for unknown destinations (163,000 MT).  For 2020/2021, net sales of 25,900 MT reported for Peru (40,100 MT), Jamaica (5,000 MT), and Honduras (2,600
    MT), were offset by reductions primarily for Mexico (14,600 MT) and Colombia (7,000 MT).  Exports of 1,241,200 MT were down 8 percent from the previous week, but unchanged from the prior 4-week average.  The destinations were primarily to Mexico (293,700 MT),
    South Korea (237,300 MT), Japan (208,000 MT), Peru (129,800 MT), and Israel (61,900 MT).
    Optional Origin Sales:  For 2019/2020, new optional origin sales of 65,000 MT were reported for Vietnam.  Options were exercised to export 54,000 MT to South Korea from the United States.  Decreases totaling 195,000 MT were reported for Vietnam.  The
    current outstanding balance of 459,000 MT is for South Korea (329,000 MT), Vietnam (65,000 MT), and Taiwan (65,000 MT).  For 2020/2021, new optional origin sales of 195,000 MT were reported for Vietnam. The current outstanding balance of 195,000 MT is for
    Vietnam.  Export Adjustments: Accumulated exports of corn to Guatemala were adjusted down 3,469 MT for week ending May 28th. These exports were reported in error.
  • Barley:
    No net sales were reported for the 2020/2021 marketing year, which began June 1.  A total of 9,200 MT in sales were carried over from the 2019/2020 marketing year, which ended May 31.  Accumulated exports were 41,100 MT, down 3 percent from the prior year’s
    total of 42,500 MT.  Exports for the period ending May 31 totaled 500 MT, with Japan being the destination. There were no exports for the period ending June 1.
  • Sorghum:
    Net sales of 69,700 MT for 2019/2020 were down 25 percent from the previous week and 19 percent from the prior 4-week average.  Increases reported for China (66,700 MT) and Eritrea (33,000 MT, switched from unknown destinations), were offset by reductions
    for unknown destinations (30,000 MT).  For 2020/2021, total net sales of 83,000 MT were for unknown destinations.  Exports of 230,300 MT were up noticeably from the previous week and up 83 percent from the prior 4-week average.  The destinations were to China
    (197,300 MT) and Eritrea (33,000 MT, late – see below).    Late Reporting:  For 2019/2020, exports totaling 33,000 MT were reported late.  The destination was Eritrea.
  • Rice:
    Net sales reductions of 17,500 MT for 2019/2020–a marketing-year low–were down noticeably from the previous week and from the prior 4-week average.  Increases primarily for Haiti (11,600 MT, including decreases of 100 MT), Mexico (9,600 MT), Jordan (6,000
    MT), Saudi Arabia (5,500 MT), and Canada (3,100 MT, including decreases of 100 MT), were more than offset by reductions primarily for Nicaragua (57,000 MT).  For 2020/2021, total net sales of 57,000 MT were for Nicaragua.  Exports of 49,400 MT were down 35
    percent from the previous week and 19 percent from the prior 4-week average.  The destinations were primarily to Japan (15,300 MT), Haiti (15,200 MT), El Salvador (6,000 MT), Saudi Arabia (3,300 MT), and Canada (3,100 MT).
    Exports for Own Account:
    For 2019/2020, the current exports for own account outstanding balance is 100 MT, all Canada.
    Export Adjustments: Accumulated exports of long grain rough rice to Mexico were adjusted down 30,000 MT and exports of long grain milled rice to Mexico were adjusted down 25,250 MT for week ending May 14th. These exports were reported in error.
  • Soybeans:
    Net sales of 1,003,700 MT for 2019/2020 were up noticeably from the previous week and up 36 percent from the prior 4-week average.  Increases were primarily for China (337,000 MT), unknown destinations (213,200 MT), Mexico (85,000 MT), Japan (72,400 MT, including
    56,800 MT switched from unknown destinations and decreases of 1,500 MT), and Taiwan (70,300 MT, including decreases of 100 MT).  For 2020/2021, net sales of 1,212,500 MT were primarily for unknown destinations (644,000 MT), China (517,000 MT), and Taiwan (46,000
    MT).  Exports of 292,600 MT–a marketing-year low–were down 39 percent from the previous week and 33 percent from the prior 4-week average.  The destinations were primarily to Japan (61,200 MT), Bangladesh (58,300 MT), Mexico (48,900 MT), Egypt (48,300 MT),
    and Indonesia (26,100 MT).    Exports for Own Account:  For 2019/2020, the current exports for own account outstanding balance is 2,100 MT, all Canada.

    Late Reporting: For 2019/2020, exports totaling 4,100 MT were reported late. The destination was Cuba.
  • Soybean
    Cake and Meal
    :
    Net sales of 207,900 MT for 2019/2020 were down 63 percent from the previous week and 15 percent from the prior 4-week average.  Increases primarily for El Salvador (37,200 MT, including 11,000 MT switched from Guatemala, 5,000 MT switched from Honduras, 1,000
    MT switched from Nicaragua, and decreases of 100 MT), the Philippines (32,200 MT, including decreases of 900 MT), Mexico (29,600 MT), Peru (25,200 MT), and Canada (23,700 MT, including decreases of 1,400 MT), were offset by reductions for Guatemala (10,000
    MT), Honduras (4,400 MT), Qatar (1,600 MT), Nicaragua (1,000 MT), and Taiwan (500 MT).  For 2020/2021, net sales reductions of 19,000 MT resulting in increases for Canada (300 MT), were more than offset by reductions for Colombia (19,300 MT).
    Exports
    of 181,800 MT were down 37 percent from the previous week and 19 percent from the prior 4-week average.  The destinations were primarily to Morocco (32,300 MT), Mexico (28,800 MT), Colombia (26,600 MT), Canada (26,000 MT), and El Salvador (19,900 MT).
    Export Adjustments: Accumulated exports of soybean cake and meal to New Zealand were adjusted down 5,000 MT for week ending May 28th.  The correct destination is Australia and is included in this week’s report.
  • Soybean
    Oil: 
    Net
    sales of 9,500 MT for 2019/2020 primarily for Colombia (2,700 MT, including decreases of 300 MT), South Korea (2,600 MT), the Dominican Republic (2,100 MT), El Salvador (2,000 MT), and Mexico (500 MT), were offset by reductions for Canada (500 MT).  Exports
    of 6,400 MT were down 92 percent from the previous week and 86 percent from the prior 4-week average.  The destinations were to Colombia (2,500 MT), Mexico (1,300 MT), El Salvador (1,100 MT), Nicaragua (800 MT), and Canada (400 MT).
  • Cotton:
    Net sales of 399,600 RB for 2019/2020 were down noticeably from the previous week, but up noticeably from the prior 4-week average.  Increases for China (209,500 RB, including 2,200 RB switched from Vietnam and decreases of 28,700 RB), Vietnam (176,200 RB,
    including 2,000 RB switched from South Korea), Pakistan (13,200 RB), Turkey (11,100 RB), and Thailand (100 RB, including decreases of 900 RB), were offset by reductions primarily for Malaysia (5,300 RB), Bangladesh (2,800 RB), and South Korea (2,000 RB).
    For 2020/2021, net sales of 193,400 RB were primarily for China (161,700 RB), Vietnam (22,000 RB), Malaysia (5,300 RB), and Bangladesh (3,500 RB).  Exports of 294,300 RB were up 24 percent from the previous week and 18 percent from the prior 4-week average.
    Exports were primarily to China (86,400 RB), Vietnam (67,400 RB), Turkey (56,500 RB), Pakistan (32,400 RB), and Bangladesh (15,800 RB).  Net sales of Pima totaling 3,400 RB were up noticeably from the previous week and up 27 percent from the prior 4-week average.
    Increases were for China (900 RB), India (500 RB), Pakistan (400 RB), Bangladesh (400 RB), and Turkey (400 RB).  For 2020/2021, total net sales of 100 RB were reported for China.  Exports of 14,700 RB were up noticeably from the previous week and from the
    prior 4-week average.  The destinations were primarily to China (8,300 RB), Pakistan (2,400 RB), India (1,300 RB), Bangladesh (900 RB), and Egypt (700 RB).
    Exports for Own Account:  For 2019/2020, exports for own account totaling 8,200 RB to Vietnam (6,000 RB) and China (2,200 RB) were applied to new or outstanding sales.  The current exports for own account outstanding balance of 23,500 RB is for China
    (8,500 RB), Indonesia (8,200 RB), Vietnam (5,800 RB), and Bangladesh (1,000 RB)
    .

<![if !supportLists]>·
<![endif]>Hides and Skins:

Net sales of 757,800 pieces for 2020 were up 93 percent from the previous week and up noticeably from the prior 4-week average.  Increases primarily for China (709,400 whole cattle hides, including decreases of 10,900 pieces), South Korea (22,600 whole cattle
hides, including decreases of 400 pieces), Mexico (10,200 whole cattle hides, including decreases of 400 pieces), Thailand (7,900 whole cattle hides, including decreases of 24,900 pieces), and Taiwan (4,700 whole cattle hides), were offset by reductions for
Indonesia (100 whole cattle hides).

Additionally, net sales reductions were reported for Canada (100 kip skins).
Exports of 430,100 pieces reported for 2020 were up 4 percent from the previous week and 3 percent from the prior 4-week average.  Whole cattle hides exports were primarily to China (370,100 pieces), South Korea (25,900 pieces), Mexico (9,700 pieces), Vietnam
(6,400 pieces), and Thailand (5,700 pieces).  In addition, there were exports to Italy (1,300 kip skins) and Canada (1,300 kip skins).

<![if !supportLists]>·
<![endif]>Net sales of 135,200 wet blues

for 2020 were up noticeably from the previous week and from the prior 4-week average.  Increases were primarily for China (93,700 unsplit and 1,100 grain splits), Mexico (16,000 grain splits, 800 unsplit, and decreases of 100 unsplit), Italy (14,000 unsplit,
including decreases of 800 unsplit), the Dominican Republic (7,200 unsplit), and South Korea (2,000 grain splits).  Exports of 92,300 wet blues for 2020 were up 42 percent from the previous week and 27 percent from the prior 4-week average.  The destinations
were to Italy (80,200 unsplit), Thailand (4,000 unsplit and 1,600 grain splits), Brazil (2,200 grain splits), Vietnam (2,100 unsplit), and the Dominican Republic (800 unsplit).  Net sales reductions of 2,500 splits for China (including decreases of 4,000 splits).
Exports of 218,400 pounds were to Vietnam (120,000 pounds) and China (98,400 pounds).

<![if !supportLists]>·
<![endif]>Beef:

Net sales of 20,400 MT
reported for 2020 were up 66 percent from the previous week and up noticeably from the prior 4-week average.  Increases were primarily for South Korea (7,200 MT, including decreases of 300 MT), Japan (5,500 MT, including decreases of 600 MT), Mexico (2,300
MT), Canada (2,200 MT, including decreases of 100 MT), and Taiwan (1,900 MT, including decreases of 100 MT).  Exports of 10,900 MT were up 14 percent from the previous week, but down 1 percent from the prior 4-week average.  The destinations were primarily
to Japan (4,000 MT), South Korea (3,200 MT), Hong Kong (1,100 MT), Taiwan (1,000 MT), and Canada (300 MT).

<![if !supportLists]>·
<![endif]>Pork:
Net sales of 17,200 MT reported for 2020 were down 1 percent from
the previous week, but up 60 percent from the prior 4-week average.  Increases were primarily for Mexico (5,100 MT, including decreases of 100 MT), Canada (4,700 MT, including decreases of 300 MT), China (2,600 MT, including decreases of 2,600 MT), Japan (1,800
MT, including decreases of 700 MT and late 100 MT – see below), and Honduras (1,400 MT).  Exports of 31,700 MT were up 1 percent from the previous week, but down 8 percent from the prior 4-week average.  The destinations were primarily to China (12,700 MT),
Mexico (8,200 MT), Japan (4,300 MT, late 100 MT – see below), South Korea (1,800 MT), and Canada (1,600 MT).
Late Reporting: For 2020, net sales totaling 100 MT were reported late. These sales were reported for Japan.  For 2020, exports totaling 100 MT were reported late. The destination was Japan.


                                                                                                SUMMARY OF EXPORT TRANSACTIONS
REPORTED UNDER THE DAILY SALES REPORTING SYSTEM
                                            FOR PERIOD ENDING JUNE 4, 2020
 

COMMODITY
DESTINATION                                            QUANITY (MT) 
MARKETING YEAR

SOYBEANS                                                 CHINA                                                         132,000 MT 1/                                2019/2020

SOYBEANS                                                 UNKNOWN                                                 382,000 MT 1/                                2019/2020

SOYBEANS                                                 UNKNOWN                                                 512,000 MT 1/                                2020/2021


1/ Export sales.


Terry Reilly

Senior Commodity Analyst – Grain and Oilseeds

Futures International │190 S LaSalle St., Suite 410│Chicago, IL  60603

W: 312.604.1366

treilly@futures-int.com

AIM: fi_treilly

ICE IM: 
treilly1

Skype: fi.treilly


Description: Description: Description: Description: FImail


Trading of futures, options, swaps and other derivatives is risky and is not suitable for all persons.  All of these investment products are leveraged, and you can lose more than your initial deposit.  Each investment product is offered
only to and from jurisdictions where solicitation and sale are lawful, and in accordance with applicable laws and regulations in such jurisdiction.  The information provided here should not be relied upon as a substitute for independent research before making
your investment decisions.  Futures International, LLC is merely providing this information for your general information and the information does not take into account any particular individual’s investment objectives, financial situation, or needs.  All investors
should obtain advice based on their unique situation before making any investment decision.  The contents of this communication and any attachments are for informational purposes only and under no circumstances should they be construed as an offer to buy or
sell, or a solicitation to buy or sell any future, option, swap or other derivative.  The sources for the information and any opinions in this communication are believed to be reliable, but Futures International, LLC does not warrant or guarantee the accuracy
of such information or opinions.  Futures International, LLC and its principals and employees may take positions different from any positions described in this communication.  Past results are not necessarily indicative of future results.