PDF Attached
US
balances for the soybean complex attached. We did not make any major changes to FI’s balances other than update crush stats and trade data for April. Reflects USDA update for June. Note we will be revising our SBO price projection next week after revising
production for corn, soybeans, and wheat.
It
was a busy day with reports. Grain and oilseeds were choppy and mostly higher pre-USDA report. Prices immediately rocketed higher for corn but soybeans traded sharply lower, taking wheat down with them, post report. Remainder of the session prices traded
choppy, with many contracts fluctuating up and down.
USDA
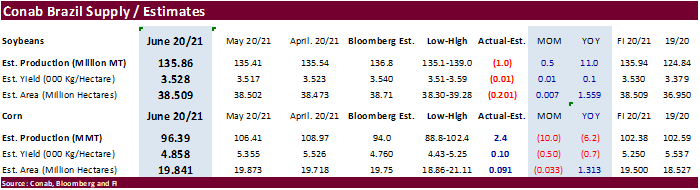
export sales were largely within expectations. Conab reported a higher-than-expected corn production estimate for Brazil at 96.4 million tons but that is down 10 million from their previous estimate, a large reduction. Brazil soybeans at 136 million tons
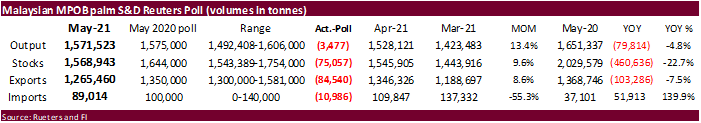
were up 0.5 million tons from the previous month and 1 million below expectations. Malaysian palm oil end of May stocks were less than expected at 1.569 million tons (1.64MMT est.) despite a lower-than-expected palm export figure. China in its CASDE report
lowered domestic feed and food use.
![]()
USDA
released their June supply and demand outlook
Reaction:
Bullish
corn, neutral wheat and bearish to neutral soybeans. Look for the trade to quickly shift focus on crop conditions, weather, and June
Acreage report due out at the end of the month.
Next
major report is June Acreage, followed by the July S&D. USDA typically does not adjust supply for corn and soybeans in July, but if corn conditions continue to decline at a rapid pace, there is a chance USDA could cut the July yield from May/June.
At this point we don’t think it will be revised. USDA’s first survey of spring wheat is July.
US
old-crop corn carryout was cut 150 million bushels to 1.357 billion, a tight 7.4 percent STU, due to a more than expected increase in corn for ethanol use of 75 million and upward revision to the exports by 75 million (Brazil). We were surprised USDA lowered
the Brazil corn crop by only 3.5 million tons to 98.5 million, 1.2 million above an average trade guess. Argentina corn was unchanged. Back to the US corn balance, USDA made no changes to new-crop categories other than reflecting the lower carry in. We
thought the US soybean and wheat ending stock revisions were neutral. New crop all-wheat exports were lowered only 4 million bushels. Beginning stocks were lowered 20 million bushels to reflect higher old crop exports (crop year ended), which was offset
by an upward revision to all-wheat production by 26 million to 1.898 billion bushels. USDA raised feed use for 2021-22 by 10 million to 180 million, 80 million higher than 2020-21. Wheat production by class below.
USDA
raised Brazil’s soybean production by 1 million tons. Argentina was left unchanged. USDA left 2020-21 US exports unchanged but unexpectedly cut the crush by 15 million bushels to 2.175 billion. We think it will end up higher than that unless some plants
are unable to source the soybeans during the summer or crush margins erode. For new-crop, USDA raised the crush by 15 million, which was needed given the strong demand for new-crop soybean oil for renewable diesel. Speaking of which, USDA made no changes
to old and new crop biofuel demand, but increased food use for 2020-21 by 225 million pounds to 14.325 billion. We agree. Old crop SBO exports were lowered 400 million pounds. Note export sales shipments have been low recently. Imports were lowered 50 million.
Production was lowered 135 million reflecting the lower crush. The result lowered the carryout by 10 million pounds. New crop soybean oil categories were unchanged other than to reflect a lower carry in. Soybean meal production for old crop was taken down
200,000 short ton. Imports were increased 50,000 short tons (Canada?) to 700,000 tons and domestic use taken down 150,000 tons. With a healthy May and June crush rate, we are surprised exports were not lifted higher given the amount of meal in the pipeline.
New crop was unchanged. The increase in US soybean stocks by 15 million initially caught the trade off guard, but prices paired losses in new-crop from higher corn.
As
we mentioned above, crop conditions and weather are back on the table. Look for volatility in these markets to last into FH July, unless NA weather significantly improves.
USDA
OCE Secretary Briefing
https://www.usda.gov/sites/default/files/documents/june-2021-wasde-lockup-briefing.pdf
Highlights
·
Brazil’s second crop corn (2020/21) was reduced further on the persistent drought conditions that pushed yields below average despite recent rains. Lower yields were moderated by an increase in area.
·
Brazil’s 2020/21 cotton production was reduced, reflecting lower area due to a delayed start to planting and relatively unfavorable cotton prices at planting.
·
Favorable May weather in Europe supports prospects for higher wheat and rapeseed production.
·
Russia wheat production was raised 1.0 MMT, to a new record.
·
WORLD
HIGHLIGHTS
- Much
of the Midwest Corn and Soybean Belt will experience a net decline in soil moisture over the next ten days to possibly two weeks
o
Scattered showers and thunderstorms are expected periodically, but resulting rainfall may have a tough time countering evaporation
o
The European forecast model is quite dry for the Midwest with hot weather in the northern Plains early next week and in the western and central Corn Belt during mid-week
- Some
of the heat and dryness is a little extreme, but the trend is correct
o
The GFS model run has a little too much rain in the outlook and not enough heat; so, as usual there is need for a compromise in the models
o
Net drying is the bottom line with increasing crop stress in the north and western Corn Belt with a few pockets of exception
- Rainfall
coming tonight and Friday has been reduced in the northern Plains over that advertised earlier this week, but rain will still occur in the Dakotas and western Minnesota tonight and Friday adding to the moisture that has already fallen to continue the “temporary”
improving trend for crops in the region
o
Drying is expected this weekend through a large part of next week, despite a few sporadic showers and temperatures will be very warm to hot again during the Sunday through Tuesday or Wednesday period
- The
heat will quickly draw down soil moisture after this week’s increase in moisture - Hot
temperatures will occur in the Dakotas today ahead of the overnight thunderstorms
o
Fast drying is expected with temperatures in the 90s and near 100 Fahrenheit
o
Similar heat is expected early next week
- It
is very difficult to get far ahead on soil moisture when rain events are surrounded by bouts of hot weather - Russia’s
southeastern New Lands and northern Kazakhstan spring wheat and sunseed production areas will receive very little rain over the next two weeks and net drying is expected
o
No excessive heat is presently expected which will help keep crop stress low as the region dries down
- India’s
monsoon depression seems to lose more intensity as each day goes by, but moderate to heavy rain is expected from Odisha to Madhya Pradesh this weekend into next week
o
The risk of serious flooding has been greatly reduced, but local flooding is still expected and the rain will disrupt planting of summer crops with a few of the wettest areas having need for a little replanting
- Interior
western and southern India will continue drier than usual for this time of year and this trend may continue into late June raising some eventual concern over delayed rainfall and delayed planting - U.S.
high pressure ridge aloft is still expected to shift westward into the Rocky Mountains and high Plains region this weekend and especially next week creating a northwesterly wind flow pattern aloft over the Midwest
o
In this pattern there may be some shower and thunderstorms and less heat in the Midwest
o
Crop conditions will only improve if generalized rain falls and today’s outlook still suggests net drying over the next couple of weeks
o
Moisture in the northwestern Corn Belt will be restricted especially if a tropical cyclone comes into the Gulf of Mexico a week from now as suggested by some forecast models today
- As
noted a week ago, the potential for tropical cyclone development in a part of the western Atlantic Ocean Basin will be highest next week.
o
Recent forecast models have suggested the period from June 17-21 may be a time period to watch for a tropical system in the Gulf of Mexico.
- East-central
China, including the Yellow River Basin and North China, will receive rain this weekend through all of next week to ease the region from recent dryness
o
Crop stress relief is expected
o
Some welcome rain fell Wednesday and early today from northern Shaanxi to parts of Hebei with a few areas in northern Hebei getting 1.00 to more than 2.50 inches of rain
o
Rain also fell overnight in Liaoning where another 0.60 to nearly 3.00 inches resulted
- Northeast
China crop weather will be mostly good over the next two weeks with a mix of rain and sunshine while temperatures are little warmer than usual - Southern
China will remain plenty wet for the next two weeks - Xinjiang,
China will trend a little cooler than usual in the northeast during the coming week with periods of rain possible
o
Extreme lows in northeastern Xinjiang will slip to the 40s Fahrenheit Saturday morning
- Rainfall
Wednesday varied up to 0.50 inch and high temperatures were confined to the 70s Fahrenheit
o
Southwestern areas will see a little cooler bias in temperatures and limited rain potential; these temperatures will be much closer to normal than in the northeast part of the province
- Lower
U.S. Midwest, Delta and southeastern states will continue to see a good mix of weather for a while, although the Delta and Tennessee River Basin will need to dry down after recent heavy rain and flooding
o
Delta and Tennessee River Basin rainfall the past two days was greater than expected with 3.00 to 9.00 inches resulting in more widespread flooding
- West
Texas will be hot over the next two days with highs of 100 to 108 Fahrenheit
o
Scattered showers will pop up during the weekend and next week as the region cools back down for a little while
- Far
western U.S. crop areas will continue quite dry during the next ten days with temperatures turning warmer than usual next week and continuing into the following weekend - Canada’s
Prairies have been experiencing relief from dryness this week and additional rain into Saturday will perpetuate the trend.
o
Relief has been imperative after recent drying and soil moisture rated short to very short Tuesday before the rain began
o
Crop stress is being eased and will continue to be eased through Saturday
o
Rain will occur from Saskatchewan through Manitoba today into Saturday morning with tonight and Friday wettest
- Rainfall
of 0.50 to 1.50 inches will be common with local totals of up to 2.75 inches
o
This weekend through June 22 will be a little drier and warmer biased once again
- Mexico
rainfall will continue confined to southern parts of the nation during the next two weeks leaving drought in dominance of western, central and northern Mexico
o
Recent rain in eastern Mexico eased long term dryness
- Nicaragua
and Honduras have been drier biased for the past month and need rain
o
Some improvement is expected over the next week to ten days as rain develops in some of the driest areas
- Safrinha
corn areas of Brazil will experience no serious weather changes over the next ten days
o
Dryness will remain in Mato Grosso, Goias, southwestern Minas Gerais and northern Sao Paulo
o
Showers and thunderstorms farther to the south in Brazil periodically will be good for wheat and late Safrinha crops
o
Safrinha corn and cotton production will be down this year, despite periodic rainfall in the south
- Argentina’s
summer crop harvest has advanced well in recent weeks
o
Winter wheat areas are drying down and there are some areas in Cordoba that need significant moisture
- The
dry bias will prevail over the next week to ten days - Australia
will see some periodic showers and some sunshine during the next two weeks
o
Greater volumes of rain are needed especially in South Australia, Queensland and, northwestern Victoria and western New South Wales
- Portions
of Western Europe will be trending drier over the coming week
o
Temperatures will be warm, but not excessively hot
o
Drying will raise the need for rain in time
- Southeast
Asia rainfall increased in the mainland areas Tuesday while staying light in Philippines, Indonesia and Malaysia
o
The rain was welcome
- Much
of Southeast Asia is expecting bouts of rain through the next ten days, although amounts will be lighter than usual at times.
- A
monsoon depression has evolved in the South China Sea and may bring significant rain to Hainan, China early this weekend and then to northern Vietnam and northern Laos late this weekend into Monday
- South
Africa rain will be minimal for a while supporting summer crop harvesting and winter crop planting
o
A boost in rain is always needed in winter crop areas
- West
Africa rainfall will increase over the next ten days
o
Greater rain is needed in many areas, including Ghana and some west-central Ivory Coast coffee, cocoa, rice and sugarcane production areas
- A
boost in cotton rainfall would also be welcome
o
Rainfall will continue lighter than usual, but at least some showers will occur periodically
- East-central
Africa has been drying down and needs greater rain soon to maintain the best coffee, cocoa, rice, sugarcane and other crop production potentials
o
Rainfall will increase in Ethiopia this week while little change occurs elsewhere
- Southern
Oscillation Index is mostly neutral at -0.78 and the index is expected to begin leveling off during the balance of this week after a steady decline - North
Africa weather will trend a little wetter in northern Algeria and Tunisia this weekend and early next week
o
No winter crop quality issues are expected
- New
Zealand weather during the coming week to ten days will be drier and warmer than usual
o
the exception will be along the west coast of South Island where rain is expected this weekend into next week
Source:
World Weather, Inc.
Thursday,
June 10:
- USDA’s
monthly World Agricultural Supply and Demand (WASDE) report, 12pm - USDA
weekly crop net-export sales for corn, soybeans, wheat, cotton, pork, beef, 8:30am - China’s
agriculture ministry (CASDE) releases monthly report on supply and demand for corn and soybeans - Malaysian
Palm Oil Board inventory, output and export data for May - Brazil’s
Conab releases output, yield and acreage data for corn and soybeans - Port
of Rouen data on French grain exports - Malaysia
June 1-10 palm oil export data
Friday,
June 11:
- ICE
Futures Europe weekly commitments of traders report (6:30pm London) - CFTC
commitments of traders weekly report on positions for various U.S. futures and options, 3:30pm - FranceAgriMer
weekly update on crop conditions
Source:
Bloomberg and FI
USDA
export sales
Soybean
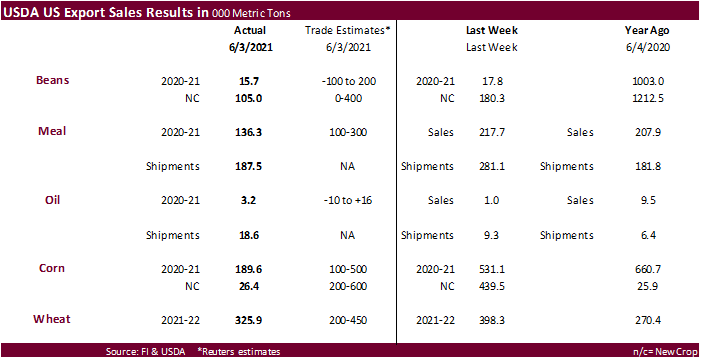
corn export sales were slow but in a range of expectations. Soybean meal and oil sales were near expectations but meal shipments were down from the previous week. SBO shipment were also up to 18,600 tons from 9,300 tons previous week. Corn export sales were
near the low end of expectations while wheat was withing expectations. We see the sales report slightly supportive for SBO while other markets continue to firm from positioning ahead of the USDA report due out later.
US
CPI (M/M) May: 0.6% (est 0.5%; prev 0.8%)
US
CPI Ex Food, Energy (M/M) May: 0.7% (est 0.5%; prev 0.9%)
US
CPI (Y/Y) May: 5.0% (est 4.7%; prev 4.2%)
US
CPI Ex Food, Energy (Y/Y) May: 3.8% (est 3.5%; prev 3.0%)
US
Initial Jobless Claims Jun 5: 376K (est 370K; prev 385K)
US
Continuing Claims May 29: 3499K (est 3665K; prevR 3757K; prev 3771K)
US
Real Avg Weekly Earnings (Y/Y May: -2.2% (prevR -1.7%; prev -1.4%)
US
Real Avg Hourly Earnings (Y/Y) May: -2.8% (prev -3.7%)
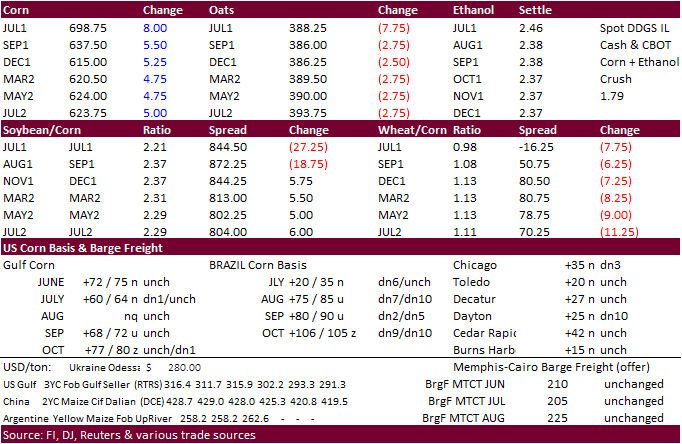
Corn
- US
corn futures rallied before and after the USDA report. It saw support early from Brazil’s Conab corn production update. Then rallied again at 11 am CT after USDA released a tighter than expected old and new-crop US stocks estimate. USDA surprised us by
taking old-crop corn for ethanol use higher by a more than expected 75 million bushels. Brazil’s corn production was lowered by a less than expected amount, but that prompted USDA to take US exports higher by 75 million bu.
- July
corn ended up 6.25 cents and December up 6.75. December corn reached its highest level since May 10 during the trade.
-
Funds
bought an estimated net 10,000 corn contracts. - In
a Reuters story, it was reported that Mexico is holding up import permits for GMO corn over the government applying a GMO ban used for animal feed, even though the ban does not go into effect for three years.
- Conab
reported a higher-than-expected corn production estimate for Brazil at 96.4 million tons but that is down 10 million from their previous estimate, a large reduction. Focus is now on USDA with the trade looking for 97.3 million tons, down from 102 million
in May. - Argentina’s
Grains Exchange raised their corn crop forecast to 48 million tons from 46 million previous. USDA is at 47 million tons.
- USDA
corn export sales came in near the lower end of a range of expectations at 189,600 tons old crop and 26,400 tons new-crop. Sales to China included 66,200 tons.
- USD
was 5 points lower as of 1:00 pm CT. - China’s
CASDE S&D update (attached) offered little direction with exception of a downward revision to the use of corn in feed consumption by 3 million tons for the current crop year. The AgMin noted the increase in wheat and rice consumption as feed replaced some
of the corn. - Japan’s
weather bureau said La Nina appears to a have ended and estimated normal conditions during autumn at 60 percent.
- Today
was the fourth day of the Goldman Roll.
Export
developments.
Updated
6/10/21
July
corn seen in a $6.50 and $7.50 range (up 50 front end, up 25 back end)
December
corn is seen in a $4.75-$7.00 range.
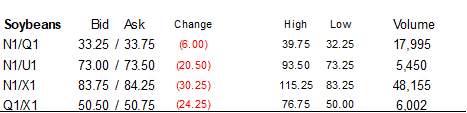
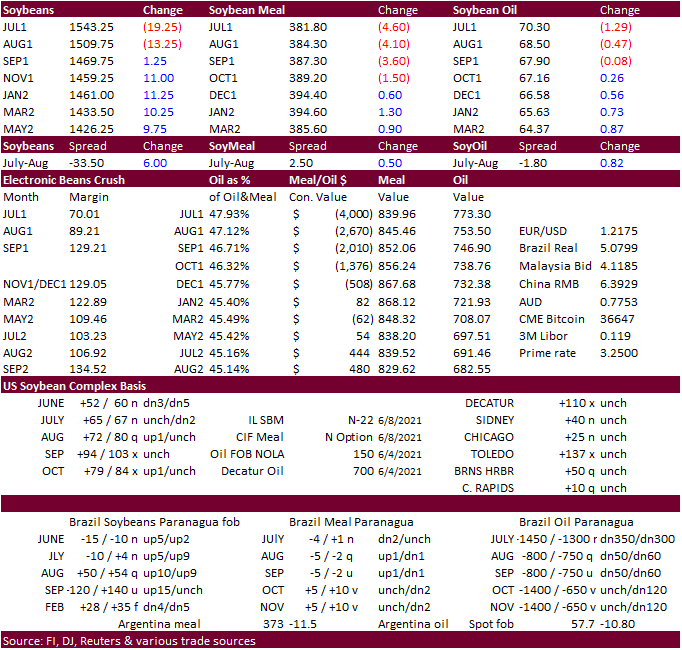
Soybeans
-
The
soybean complex traded in a wide two-sided trading range. We saw a large amount of selling when USDA released their S&D update from a higher than expected US ending stocks figure from a cut in old crop crush, and one-million-ton upward revision to Brazil’s
soybean crop (see recap near the top of this comment). -
July
soybeans settled a large 18.50 cents lower, September down 13.0 cents, August down 0.25, and November up 11.25 cents!
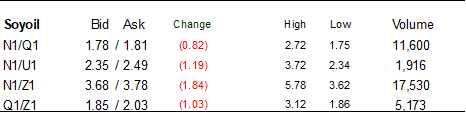
-
Bear
spreading pulled July meal $4.80 lower. July soybean oil fell 113 points, Aug down 29 points and December up 59 points. With USDA cutting the old crop crush by 15 million bushels resulting in less soybean oil produced for the remainder of the crop year,
we think the bear spreading was overdone.
-
Funds
sold an estimated net 7,000 soybeans, sold 4,000 soybean meal and sold 2,000 soybean oil.
-
USDA
export sales were within expectations but soybean oil shipments improved from the previous week. We heard soybean meal was sold to Vietnam off the PNW at a cheap price. Next week we think soybean meal export sales may be reported within a 150,000 and 300,000
ton range. -
Conab
reported Brazil soybean production at 136 million tons, up 0.5 million tons from the previous month and 1 million below expectations. Traders viewed the soybean production figure as neutral.
-
Argentina
cash soybean oil for the July position dropped to $1272/ton as of late yesterday from slightly over $1300/ton earlier this week. Argentina’s crush is running at high levels. Producer selling has picked up in recent weeks. Some traders are concerned the
government may soon increase export taxes on agriculture commodities. -
Palm
ended lower and cash was unchanged. Malaysian palm oil end of May stocks were less than expected at 1.569 million tons (1.64MMT est.) despite a lower-than-expected palm export figure. Domestic consumption nearly doubled to 372,039 tons, according to Reuters,
a surprise. Palm production seasonal increases around this time of year and this could limit upside in prices unless other global vegetable oils rally.
-
Cargo
surveyor SGS reported month to date June 10 Malaysian palm exports at 411,044 tons, 44,241 tons below the same period a month ago or down 9.7%, and 169,052 tons below the same period a year ago or down 29.1%. AmSpec reported June 1-10 Malaysian palm oil exports
down 14.3% from the same period previous month at 402,520 tons. ITS was 10% lower at 402,330 tons.
-
GAPKI
noted plantations in Riau are seeing a surge in COVID-19 cases and officials are tightening protocols. It’s unclear if production could be affected.
- We
heard Vietnam bought a cargo of soybean meal overnight off the PNW at a steep discount to the interior.
- USDA
seeks 1,180 tons of packaged vegetable oil for export donation on June 15 for July 16-Aug 15 shipment.
Updated
6/10/21
July
soybeans are seen in a $15.00-$16.25 (up 25); November $12.75-$15.00
Soybean
meal – July $360-$410 (unch, dn $10);
December $380-$460
Soybean
oil – July 68-74 (down 100 for both);
December 57-70 cent range
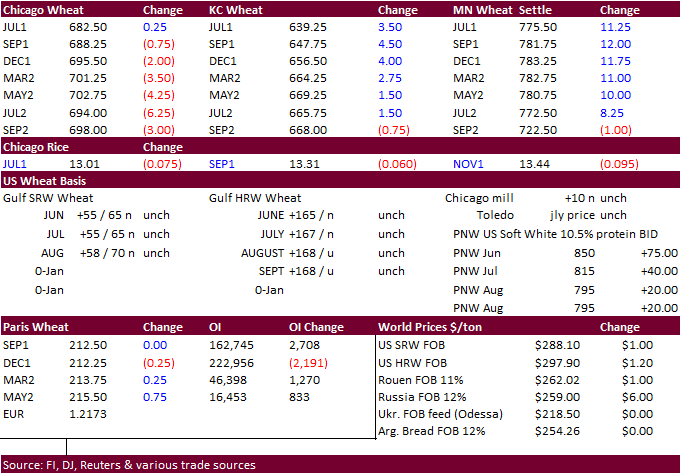
- US
wheat traded both sides of the market in a very choppy session. USDA raised their US winter wheat production by 26 million bushels to 1.309 billion, around trade expectations. Next month we will see USDA’s first survey of the US spring wheat and durum crop
estimates, expected to come in well below USDA’s combined 589-million-bushel estimate. Tunisia and Japan bought wheat.
- Chicago
wheat ended mixed (bull spreading lifted stop 1.50 cents higher and December was 0.25 cent lower), KC was 1.50-5.25 higher and Minneapolis, once down sharply, settled 10-11.50 cents higher in the front months.
- Funds
bought an estimated net 1,000 SRW wheat contracts. - USDA
export sales were within expectations (325,900 tons) but off slightly from the previous week. New-crop sales are off to an average start for commitments.
- US
weather forecast was mostly unchanged. Weather models vary but the general theme is for the Dakota’s to see crop stress through the end of the month. However, more rain is expected today across the northern Plains. Next week we look for US spring wheat
crop conditions to decline and winter wheat to slightly improve. - IKAR:
Russia wheat crop 82 million tons, up 2 million tons from previous and below 85.9 million produced in 2020.
- September
Paris wheat settled flat at 212.50
euros ($258.66) a ton.
- AgriCensus
noted the Philippines bought 50,000 tons of Australian wheat for July shipment. $321-$324/ton was believed to be the price range.
- Tunisia
bought 50,000 tons of soft wheat at $297.75/ton c&f, optional origin. - Jordan
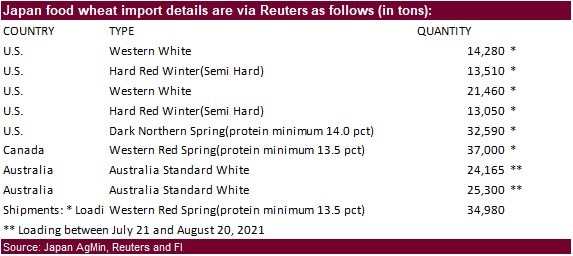
is back in for feed barley on June 23 for Nov/Dec shipment. - Japan
bought 181,355 tons of food wheat later this week from United States, Canada and Australia.
- Ethiopia
seeks 400,000 tons of milling wheat on June 14, two lots of 200,000 tons each with delivery within 70 to 90 days of contract date.
- Jordan
seeks 20,000 tons of wheat bran on June 15 for July/August shipment. - Japan
seeks 80,000 tons of feed wheat and 100,000 tons of barley on June 16 under its SBS import system, for arrival in Japan by November 25.
- Jordan
seeks 120,000 tons of wheat on June 22 for December shipment.
Rice/Other
·
Indonesia aims to produce 55.2 million tons of rice in 2022 and 20.1 million tons of corn.
Updated
6/10/21
July
Chicago wheat is seen in a $6.30-$7.15 range
July
KC wheat is seen in a $5.95-$6.70
July
MN wheat is seen in a $7.50-$8.25
(unch, down 25)
This
summary is based on reports from exporters for the period May 28-June 3, 2021.
Wheat: Net
sales of 325,900 MT for the 2021/2022 marketing year, which began June 1, were primarily for South Korea (80,300 MT), the Philippines (60,200 MT, including decreases of 32,900 MT), unknown destinations (45,000 MT), Honduras (39,500 MT), and Nigeria (37,300
MT). A total of 837,100 MT in sales were carried over from the 2020/2021 marketing year, which ended May 31. Exports for the period ending May 31, of 459,500 MT brought accumulated exports to 24,806,600 MT, virtually unchanged from the prior year’s total
of 24,812,200 MT. The destinations were primarily to the Philippines (177,600 MT), Mexico (65,200 MT), China (63,000 MT), Nigeria (36,800 MT), and Thailand (29,900 MT). Exports for June 1- 3, totaled 136,300 MT, with Japan (34,900 MT), the Dominican Republic
(26,400 MT), Thailand (24,500 MT), Mexico (22,900 MT), and the Philippines (16,600 MT) being the primary destinations.
Optional
Origin Sales: For
2021/2022, new optional origin sales of 63,900 MT were reported for Spain. The current outstanding balance of 63,900 MT is for Spain.
Corn:
Net sales of 189,600 MT for 2020/2021 were down 64 percent from the previous week and 39 percent from the prior 4-week average. Increases primarily for Japan (203,700 MT, including 199,900 MT switched from unknown destinations and decreases of 53,800 MT),
China (66,200 MT, including decreases of 300 MT), Colombia (58,200 MT, including 50,000 MT switched from unknown destinations and decreases of 150,000 MT), Mexico (20,000 MT, including decreases of 1,300 MT), and El Salvador (19,300 MT, including 13,400 MT
switched from Guatemala), were offset by reductions primarily for unknown destinations (195,700 MT). For 2021/2022, net sales of 26,400 MT were for Costa Rica (16,300 MT), unknown destinations (7,600 MT), and Taiwan (2,500 MT). Exports of 1,647,000 MT were
down 23 percent from the previous week and 15 percent from the prior 4-week average. The destinations were primarily to China (542,500 MT), Mexico (368,000 MT), Japan (357,800 MT), Colombia (146,200 MT), and South Korea (116,200 MT).
Optional
Origin Sales: For
2020/2021, options were exercised to export 50,000 MT to unknown destinations from the United States. The current outstanding balance of 30,500 MT is for unknown destinations. For 2021/2022, the current outstanding balance of 60,000 MT is for unknown destinations.
Barley: No
net sales were reported for the 2021/2022 marketing year, which began June 1. A total of 2,600 MT in sales were carried over from the 2020/2021 marketing year, which ended May 31. Accumulated exports were 26,800 MT, down 35 percent from the prior year’s
total of 41,100 MT. There were no exports for the period ending May 31 and no exports for the period ending June 1.
Sorghum:
Net sales reduction of 4,200 MT for 2020/2021 resulting in increases for China (50,800 MT, including 55,000 MT switched from unknown destinations and decreases of 4,200 MT), were more than offset by reductions for unknown
destinations (55,000 MT). Exports of 53,300 MT were down 77 percent from the previous week and 67 percent from the prior 4-week average. The destinations were China (53,100 MT) and South Korea (200 MT).
Rice: Net
sales of 29,500 MT for 2020/2021 were up 21 percent from the previous week, but down 36 percent from the prior 4-week average. Increases primarily for Haiti (15,200 MT, including decreases of 200 MT), Mexico (6,400 MT), Honduras (5,100 MT), Canada (1,400
MT), and Belgium (400 MT), were offset by reductions for Costa Rica (100 MT). Exports of 65,400 MT were up 92 percent from the previous week and 27 percent from the prior 4-week average. The destinations were primarily to Mexico (25,200 MT), Costa Rica (17,400
MT), Haiti (15,700 MT), Japan (2,200 MT), and Canada (1,900 MT).
Exports
for Own Account: For
2020/2021, the current exports for own account outstanding balance is 100 MT, all Canada.
Soybeans: Net
sales of 15,700 MT for 2020/2021 were down 12 percent from the previous week and 75 percent from the prior 4-week average. Increases primarily for Indonesia (68,100 MT, including 80,000 MT switched from unknown destinations and decreases of 14,700 MT), Mexico
(58,500 MT, including decreases of 1,300 MT), Malaysia (18,200 MT, including 12,000 MT switched from unknown destinations), Canada (10,100 MT), and Vietnam (3,700 MT, including decreases of 700 MT), were offset by reductions primarily for unknown destinations
(86,900 MT) and Hong Kong (66,000 MT). For 2021/2022, net sales of 105,000 MT were for Hong Kong (66,000 MT), Taiwan (22,000 MT), and unknown destinations (17,000 MT). Exports of 278,700 MT were up 26 percent from the previous week, but down 2 percent from
the prior 4-week average. The destinations were primarily to Indonesia (85,400 MT), Mexico (78,000 MT), Canada (22,800 MT), Colombia (21,800 MT), and Malaysia (16,900 MT).
Exports
for Own Account: For
2020/2021, the current exports for own account outstanding balance is 5,800 MT, all Canada.
Soybean
Cake and Meal: Net
sales of 136,300 MT for 2020/2021 were down 37 percent from the previous week and 20 percent from the prior 4-week average. Increases primarily for Mexico (44,900 MT, including decreases of 5,200 MT), Canada (26,700 MT), Japan (25,200 MT, including decreases
of 100 MT), Cote D’Ivoire (15,000 MT), and Costa Rica (9,600 MT, including decreases of 8,600 MT), were offset by reductions primarily for Guatemala (5,100 MT) and Colombia (1,400 MT). For 2021/2022, net sales of 3,900 MT were for Canada (2,400 MT) and Mexico
(1,500 MT). Exports of 187,500 MT were down 33 percent from the previous week and 2 percent from the prior 4-week average. The destinations were primarily to the Philippines (49,800 MT), Mexico (31,400 MT), Honduras (25,300 MT), Morocco (18,000 MT), and
Canada (16,400 MT).
Soybean
Oil: Net
sales of 3,200 MT for 2020/2021 were up noticeably from the previous week and from the prior 4-week average. Increases were for Venezuela (3,000 MT) and Mexico (100 MT). Exports of 18,600 MT were up 99 percent from the previous week and up noticeably from
the prior 4-week average. The destinations were primarily to South Korea (15,000 MT), Guatemala (2,600 MT), and Mexico (600 MT).
Cotton: Net
sales of 108,200 RB for 2020/2021 were down 40 percent from the previous week and 16 percent from the prior 4-week average. Increases primarily for Pakistan (47,100 RB), Vietnam (21,800 RB, including 1,900 RB switched from China, 400 RB switched from Japan,
and decreases of 100 RB), China (18,800 RB, including 2,200 RB switched from Vietnam and decreases of 200 RB), Turkey (7,900 RB), and Singapore (3,400 RB), were offset by reductions for Malaysia (1,800 RB) and El Salvador (1,200 RB). For 2021/2022, net sales
of 21,400 RB were for Pakistan (15,000 RB), Vietnam (3,100 RB), Malaysia (1,800 RB), Bangladesh (1,100 RB), and Japan (400 RB). Exports of 258,400 RB were down 30 percent from the previous week and 21 percent from the prior 4-week average. Exports were primarily
to China (60,400 RB), Vietnam (44,700 RB), Pakistan (31,300 RB), Turkey (29,500 RB), and Mexico (23,900 RB). Net sales of Pima totaling 3,900 RB were down 47 percent from the previous week and 51 percent from the prior 4-week average. Increases were primarily
for India (2,000 RB), Turkey (600 RB), Greece (400 RB), Pakistan (300 RB), and Indonesia (300 RB). Exports of 16,700 RB were up 23 percent from the previous week and 15 percent from the prior 4-week average. The destinations were primarily to China (8,100
RB), India (5,100 RB), Turkey (1,300 RB), Pakistan (1,200 RB), and Italy (300 RB).
Exports
for Own Account: For
2020/2021, exports for own account totaling 2,500 RB to China (1,400 RB) and Vietnam (1,100 RB) were applied to new or outstanding sales. The current exports for own account outstanding balance of 11,100 RB is for China (6,200 RB), Vietnam (4,500 RB), and
Bangladesh (400 RB).
Hides
and Skins: Net
sales of 469,200 pieces for 2021 were up noticeably from the previous week and up 27 percent from the prior 4-week average. Increases primarily for China (368,400 whole cattle hides, including decreases of 3,000 pieces), South Korea (33,500 whole cattle hides,
including decreases of 200 pieces), Mexico (20,400 whole cattle hides, including decreases of 600 pieces), Thailand (15,000 whole cattle hides, including decreases of 400 pieces), and Indonesia (7,200 whole cattle hides), were offset by reductions for Italy
(200 pieces). In addition, total net sales of 2,000 calf skins were for Italy. Exports
of 353,000 pieces were down 16 percent from the previous week and 9 percent from the prior 4-week average. Whole cattle hides exports were primarily to China (233,700 pieces), South Korea (46,100 pieces), Mexico (23,600 pieces), Thailand (16,800 pieces),
and Brazil (10,400 pieces).
Net
sales of 116,500 wet blues for 2021 were down 57 percent from the previous week and 5 percent from the prior 4-week average. Increases primarily for China (41,500 unsplit, including decreases of 200 pieces), Italy (31,700 unsplit, including decreases of 45,600
pieces), Vietnam (28,800 unsplit), Brazil (7,600 unsplit), and Mexico (7,200 MT), were offset by reductions for Thailand (300 unsplit). Exports of 108,900 wet blues were down 48 percent from the previous week and 22 percent from the prior 4-week average. The
destinations were primarily to Vietnam (33,600 unsplit), Italy (20,200 unsplit and 5,500 grain splits), China (17,500 unsplit), Thailand (16,700 unsplit), and Taiwan (4,600 unsplit and 3,500 grain splits). Net sales reductions of 900 splits resulting in increases
for China (2,500 pounds), were more than offset by reductions for Vietnam (1,700 pounds) and Taiwan (1,700 pounds). Exports of 325,400 pounds were to Vietnam (198,000 pounds) and Taiwan (127,400 pounds).
Beef: Net
sales of 16,100 MT reported for 2021 were up 28 percent from the previous week, but down 17 percent from the prior 4-week average. Increases primarily for Japan (4,800 MT, including decreases of 600 MT), South Korea (4,000 MT, including decreases of 500 MT),
Mexico (2,500 MT), China (2,300 MT, including decreases of 100 MT), and Indonesia (1,000 MT), were offset by reductions for Honduras (100 MT). Exports of 21,100 MT–a marketing-year high–were up 70 percent from the previous week and 22 percent from the prior
4-week average. The destinations were primarily to South Korea (5,400 MT), Japan (5,200 MT), China (4,600 MT), Mexico (1,500 MT), and Canada (1,300 MT).
Pork: Net
sales of 19,700 MT reported for 2021 were down 19 percent from the previous week and 24 percent from the prior 4-week average. Increases primarily for China (8,100 MT, including decreases of 700 MT), Mexico (6,400 MT, including decreases 1,500 MT), Colombia
(1,600 MT), Japan (1,300 MT, including decreases of 600 MT), and South Korea (900 MT, including decreases of 300 MT), were offset by reductions for Australia (200 MT). Exports of 27,500 MT–a marketing-year low–were down 25 percent from the previous week
and 32 percent from the prior 4-week average. The destinations were primarily to Mexico (10,100 MT), China (6,600 MT), Japan (3,500 MT), South Korea (2,600 MT), and Canada (1,100 MT).
U.S.
EXPORT SALES FOR WEEK ENDING 6/3/2021
|
|
CURRENT |
NEXT |
||||||
|
COMMODITY |
NET |
OUTSTANDING |
WEEKLY |
ACCUMULATED |
NET |
OUTSTANDING |
||
|
CURRENT |
YEAR |
CURRENT |
YEAR |
|||||
|
WHEAT |
THOUSAND |
|||||||
|
HRW |
105.0 |
1,606.9 |
1,976.3 |
59.6 |
59.6 |
121.8 |
0.0 |
0.0 |
|
|
82.9 |
995.2 |
529.5 |
0.0 |
0.0 |
2.1 |
0.0 |
0.0 |
|
|
82.0 |
1,624.1 |
1,751.9 |
21.9 |
21.9 |
18.0 |
0.0 |
0.0 |
|
|
56.0 |
1,114.8 |
1,136.5 |
54.7 |
54.7 |
9.0 |
0.0 |
0.0 |
|
|
0.0 |
35.2 |
261.9 |
0.0 |
0.0 |
21.4 |
0.0 |
0.0 |
|
|
325.9 |
5,376.2 |
5,656.1 |
136.3 |
136.3 |
172.4 |
0.0 |
0.0 |
|
BARLEY |
0.0 |
24.7 |
40.2 |
0.0 |
0.0 |
0.5 |
0.0 |
0.0 |
|
CORN |
189.6 |
16,386.1 |
10,880.7 |
1,647.0 |
52,911.7 |
30,252.2 |
26.4 |
15,093.8 |
|
SORGHUM |
-4.2 |
1,010.2 |
1,160.3 |
53.3 |
6,220.9 |
2,856.1 |
0.0 |
1,594.9 |
|
SOYBEANS |
15.7 |
3,807.9 |
7,442.4 |
278.7 |
57,744.6 |
35,997.8 |
105.0 |
7,555.6 |
|
SOY |
136.3 |
1,983.0 |
2,446.1 |
187.5 |
8,457.9 |
8,280.0 |
3.9 |
641.6 |
|
SOY |
3.2 |
35.0 |
260.8 |
18.6 |
636.0 |
898.8 |
0.0 |
0.6 |
|
RICE |
|
|
|
|
|
|
|
|
|
|
10.1 |
188.7 |
187.2 |
42.1 |
1,456.4 |
1,216.7 |
0.0 |
0.0 |
|
|
0.0 |
16.1 |
36.9 |
0.0 |
24.8 |
65.3 |
0.0 |
0.0 |
|
|
0.2 |
13.1 |
12.6 |
0.5 |
37.6 |
55.2 |
0.0 |
0.0 |
|
|
0.1 |
45.2 |
41.4 |
0.1 |
111.3 |
77.4 |
0.0 |
0.0 |
|
|
17.0 |
60.3 |
46.3 |
16.2 |
555.8 |
819.4 |
0.0 |
0.0 |
|
|
2.1 |
180.8 |
163.1 |
6.5 |
503.9 |
564.1 |
0.0 |
0.0 |
|
|
29.5 |
504.2 |
487.5 |
65.4 |
2,689.8 |
2,798.0 |
0.0 |
0.0 |
|
COTTON |
|
THOUSAND |
|
|||||
|
|
108.2 |
2,980.6 |
5,115.6 |
258.4 |
12,854.9 |
11,609.7 |
21.4 |
2,041.5 |
|
|
3.9 |
145.2 |
132.2 |
16.7 |
663.4 |
428.4 |
0.0 |
4.0 |
|
FINAL |
||||
|
COMMODITY |
NET |
CARRYOVER
SALES |
05/31/2021
EXPORTS |
ACCUMULATED
EXPORTS |
|
WHEAT |
|
|
|
|
|
|
-1.3 |
301.4 |
91.0 |
8,422.4 |
|
|
-29.6 |
50.4 |
46.6 |
1,790.3 |
|
|
27.4 |
289.3 |
162.7 |
7,500.1 |
|
|
2.0 |
169.2 |
157.3 |
6,438.2 |
|
|
0.1 |
26.8 |
1.9 |
655.7 |
|
|
-1.4 |
837.1 |
459.5 |
24,806.6 |
|
BARLEY |
0.0 |
2.6 |
0.0 |
26.8 |
|
|
|
|
|
|
Terry Reilly
Senior Commodity Analyst – Grain and Oilseeds
Futures International
One Lincoln Center
18 W 140 Butterfield Rd.
Oakbrook Terrace, Il. 60181
W: 312.604.1366
ICE IM:
treilly1
Skype: fi.treilly

Trading of futures, options, swaps and other derivatives is risky and is not suitable for all persons. All of these investment products are leveraged, and you can lose more than your initial deposit. Each investment product is offered
only to and from jurisdictions where solicitation and sale are lawful, and in accordance with applicable laws and regulations in such jurisdiction. The information provided here should not be relied upon as a substitute for independent research before making
your investment decisions. Futures International, LLC is merely providing this information for your general information and the information does not take into account any particular individual’s investment objectives, financial situation, or needs. All investors
should obtain advice based on their unique situation before making any investment decision. The contents of this communication and any attachments are for informational purposes only and under no circumstances should they be construed as an offer to buy or
sell, or a solicitation to buy or sell any future, option, swap or other derivative. The sources for the information and any opinions in this communication are believed to be reliable, but Futures International, LLC does not warrant or guarantee the accuracy
of such information or opinions. Futures International, LLC and its principals and employees may take positions different from any positions described in this communication. Past results are not necessarily indicative of future results.