PDF Attached
Report day
USDA’s
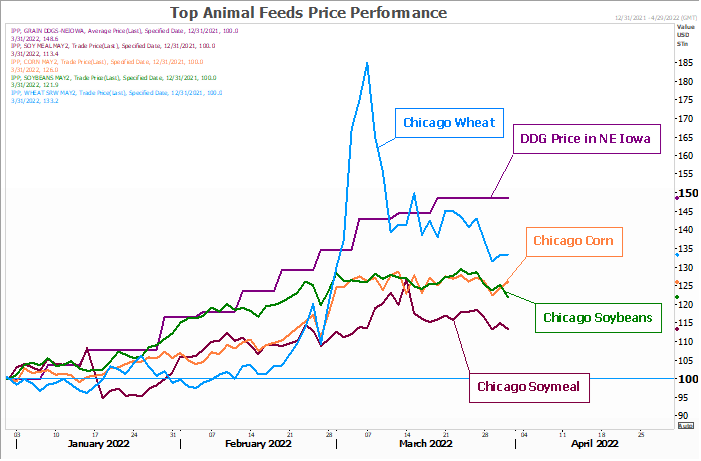
March 1 stocks and 2022 planting intentions reports sent corn higher, soybeans sharply lower, KC and Chicago wheat lower, and MN higher.
![]()
USDA
released their March Prospective Plantings and March 1 Grain Stocks reports
Reaction:
Bearish
soybeans, supportive for corn and wheat.
USDA
NASS briefing
https://www.nass.usda.gov/Newsroom/Executive_Briefings/2022/03-31-2022.pdf
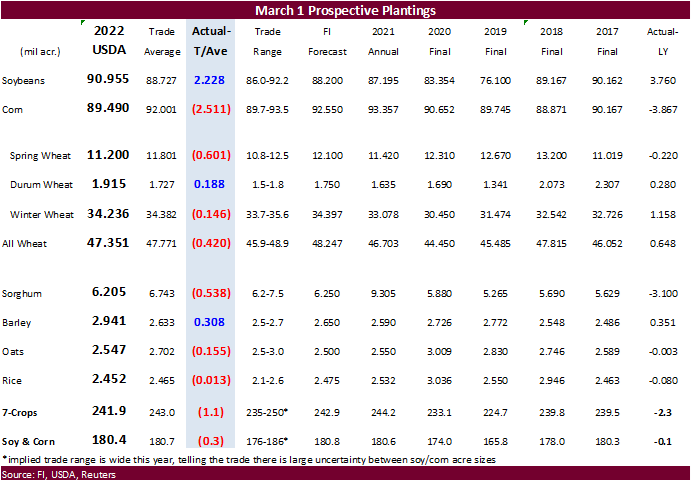
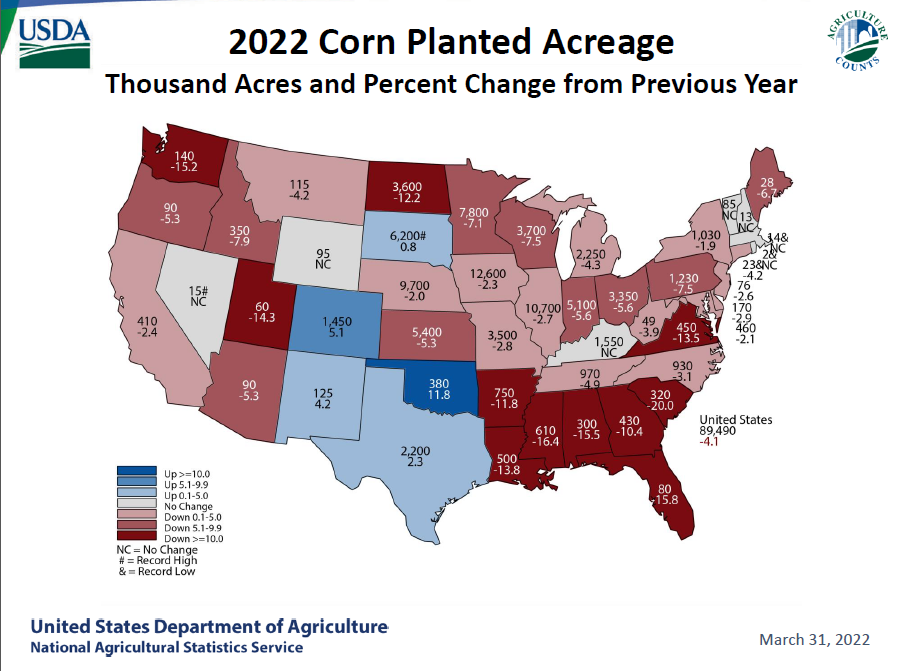
Acreage
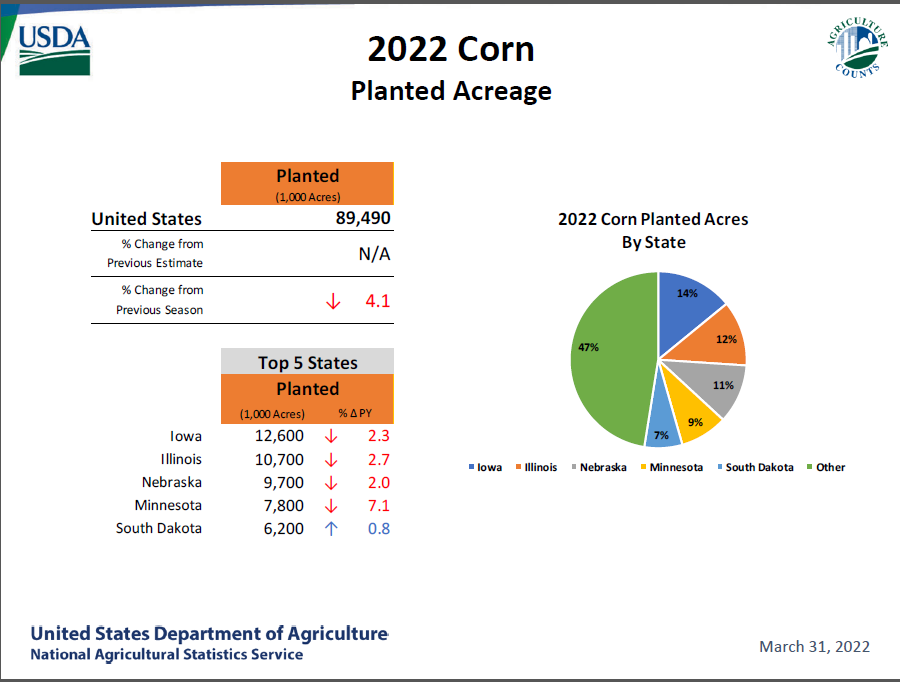
for the 7 major row crops (excluding cotton) came in less than expected by only 0.3 million acres. Corn acres were by far the largest surprise, coming in at only 89.490 million, 2.5 million below trade expectations. Soybeans of 91 million were also a surprise
as they came in 2.2 million above an average trade guess. The soybean area is higher than corn, second time in history, behind 2018 when a wet spring forced producers to switch from corn to soybeans. This year we think corn acres were lost in several areas
as producers opted to plant other commodities, including tobacco and cotton. Sorghum at 6.2 million acres were below expectations and down roughly 15 percent from 2021. The US winter wheat area came in 1.4 million acres above trade expectations at 34.236
million acres. Spring wheat was 11.200 million acres, 600,000 below trade expectations and durum at 1.915 million, 188,000 acres below expectations. Cotton was reported at 12.234 million, above 11.220 million last year, as producers across the SE and southern
Great Plains expanded the area. See below graph for changes by state for corn.
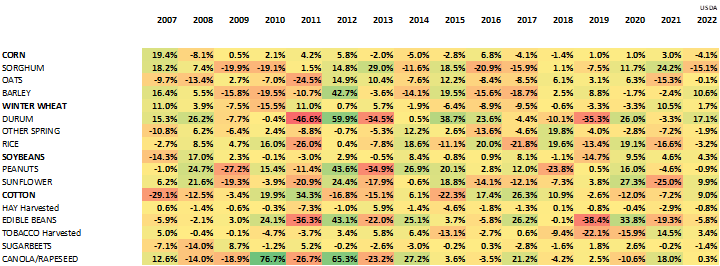
Percentage
change heat map, y/y
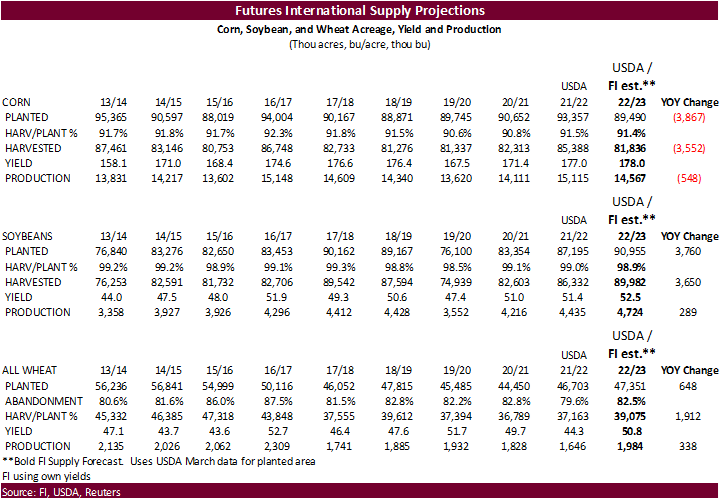
Based
on the latest data, following table is our prediction for US supply.
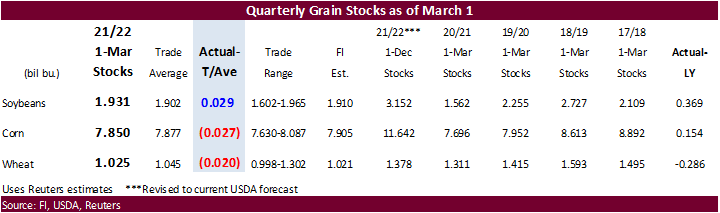
Grain
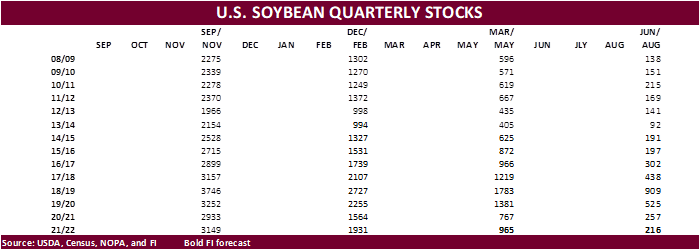
stocks were 29 million bushels above expectations for soybeans, 27 million less for corn, and 20 million less for all-wheat. USDA made slight changes to December 1 soybean and corn stocks. December 1 wheat stocks were lowered 12 million bushels. We look for
the “extra” soybean supply to get absorbed by exports by the end of the crop year.
For
corn, implied feed demand was about 50 million bushels above expectations. For wheat, stocks are expected to remain ample and US carryout stocks could increase 15 million bushels in the April S&D update. Implied wheat for feed use was about 15 million bushels
below our expectations. Note wheat stocks are lowest since 2008.
Look
for the trade to continue trading Black Sea headlines but eventually we can’t ignore US weather. The Great Plains are in need of precipitation.
WEATHER
EVENTS AND FEATURES TO WATCH
-
Frost
and a few light freezes were noted this morning across parts of Argentina’s grain and oilseed country.
-
Most
of the temperatures were not low enough for a long enough period of time to induce permanent damage to immature crops, although some leaf mass damage may have resulted. -
World
Weather, Inc. sees the cold as a foreshadow for a cold winter this year -
May
and July look to be notably cooler than usual based on our Trend Modeling -
Rain
fell in Vietnam Wednesday as Tropical Depression 01W developed and moved into the lower coast -
Precipitation
fell heavily along the lower coast and some moisture spread throughout the Central Highlands including some coffee production areas -
Most
of the rain in coffee and other crop areas was much lighter, but still welcome to the dryland production areas -
No
serious changes occurred to the U.S. outlook overnight -
The
Midwest, Delta and Tennessee River Basin will have a tough time getting significant drying time over the next ten days -
Rain
events will continue to come and go, but temperatures may not be very conducive of quick drying which may delay fieldwork for a while longer -
Temperatures
will be warm enough in the lower Delta to induce some faster drying, but the northern Delta, Tennessee River Basin and lower Midwest will stay wet for a while -
Western
parts of the U.S. hard red winter wheat production region will receive limited precipitation over the next ten days -
West
and South Texas will also continue dry for the next ten days -
California
was advertised a little wetter in the Sierra Nevada for in about ten days, but confidence in this change is low -
Canada’s
southwestern Prairies and a part of the northwestern U.S. Plains will have a good chance to get some precipitation in about ten days, but until then precipitation prospects of significance are not very good -
U.S.
Southeastern States will see a good mix of precipitation and sunshine over the next two weeks.
-
Frost
and freezes may impact the U.S. Mid-South and southeastern states at the end of next week or into the following weekend -
This
might raise the potential for some crop damage to winter wheat and any early planted and emerged corn, but it is too soon to determine how cold it will be and how far to the south -
The
situation should be closely monitored, though -
Southwestern
and west-central Argentina will be drier biased during the next ten days, although not necessarily completely dry -
The
environment is not likely to be a problem since soil moisture will be conserved by mild to cool temperatures -
Northeastern
Argentina, southern Brazil and southern Paraguay will get frequent waves of rain this weekend through much of next week resulting in too much moisture for some crop areas -
River
and stream flows have already increased; including the Parana river where barge traffic has been increasing with the recent harvest -
Flooding
is possible next week, but the rain should be spaced out enough to prevent a serious flood from occurring -
Brazil
coffee, sugarcane and minor grain and oilseed production areas form central Minas Gerais to Bahia continues to dry out, but the impact should be low -
Coffee
quality might decrease in some minor unirrigated production areas -
Sugarcane
sucrose will increase and there may be some stunting of late season cane development, but the sucrose changes should leave production unimpacted -
Most
other crop areas in Brazil will experience timely rainfall to support Safrinha crops and late full season crops develop well -
Soil
moisture is abundant outside of the northeast corner of the nation leaving crops to develop well -
Central
Europe to west-central Russia will be wetter biased for a while during the coming week -
Some
heavy snow is expected from southern Germany through northwestern Ukraine and southeastern Belarus to the Ural Mountains -
The
snow might contribute to spring flooding since the moisture content will be high in the snow and the ground is suspected of being wet beneath the snow -
Europe
and northwestern Russia temperatures will be cooler than usual over the coming week with some warming expected in western Europe during the second week of the outlook -
Northwestern
Africa and southwestern parts of Europe will continue to receive periodic precipitation that will serve winter wheat, barley and some spring crops well -
Additional
precipitation is predicted for the Russian New Lands during the weekend and especially next week -
The
moisture will be ideal for spring planting -
Most
of the precipitation is now advertised to stay north of the Kazakhstan border -
India’s
harvest weather will be very good over the next couple of weeks -
Precipitation
will be limited to sporadic showers in the far south and more generalized rain in the Eastern States
-
Southeastern
China will get additional rain today and then be dry biased for much of the following week to ten days -
The
break from rainy weather will be ideal for rapeseed development and early season corn and rice planting throughout the south -
Improvements
to many crops and field working conditions are likely -
Temperatures
will trend warmer, as well -
Northern
wheat areas of China will experience some warmer weather next week that may stimulate some greater crop development potential -
Mexico’s
dryness and drought have been expanding this winter due to poor precipitation resulting from persistent La Nina -
The
region will continue lacking precipitation for an expected period of time -
Eastern
and southern Mexico will remain seasonably dry this week and will only receive light rainfall next week -
Southeast
Asia rainfall will continue frequent and abundant -
No
area in the mainland areas, Philippines, Indonesia or Malaysia are expected to be too dry -
Too
much rain may impact northeastern Philippines late this weekend into next week -
Vietnam
was impacted by tropical depression 01W Wednesday and the disturbance may perpetuate rainfall for a few more days. resulting in frequent rainfall along the lower coast with some rain reaching into coffee areas as well -
The
moisture may be good for rain-fed coffee which normally flowers in April -
East-central
Africa rainfall will continue greatest in Tanzania, although parts of Uganda and Kenya will get rain periodically as well.
-
Ethiopia
rainfall should be most sporadic and light -
West-central
Africa rainfall will continue periodically and sufficient to support coffee and cocoa development -
Rainfall
so far this month has been a little sporadic, but no area has been seriously dry biased -
Pockets
in Ivory Coast and western Ghana have received less than usual rain, but crop development has advanced well
-
North
Africa rainfall will be greatest today and Thursday with some follow up showers early to mid-week next week in Morocco and northern Algeria -
Crop
conditions will improve as a result of the rain -
Western
Australia will continue to receive brief periods of rain through the weekend, although much of it be light and sporadic -
The
additional moisture will further boaster topsoil moisture for use in the autumn wheat, barley and canola planting season that begins in late April -
Eastern
Australia precipitation is expected to be limited the remainder of this week bringing on a better environment for cotton in the open boll stage of development -
The
drier weather will also be good for early season planting which begins soon -
Irrigated
late season sorghum and other crops will continue to develop favorably -
Some
of the dryland crop that is still immature still needs greater moisture -
Rain
is expected briefly during the weekend and early part of next week, but it should not seriously harm fiber quality, although any rain is not welcome at this time of year -
South
Africa rainfall over the next couple of weeks will periodic and sufficient enough to support late season crop development while the impact on mature crops should be low outside of some brief harvest delays -
Colombia,
Ecuador, western Venezuela and parts of Peru will remain plenty wet during the next ten days -
Frequent
rain is expected -
The
moisture will be great for coffee and cocoa flowering and well as support of all crops -
Today’s
Southern Oscillation Index is +11.93 -
The
index will move lower over the next seven days -
Central
America precipitation will be greatest along the Caribbean Coast during the next seven to ten days and in both Panama and Costa Rica -
Guatemala
will also get some showers periodically
Source:
World Weather Inc.
- ICE
Futures Europe weekly commitments of traders report - CFTC
commitments of traders weekly report on positions for various U.S. futures and options, 3:30pm - Australia
Commodity Index - USDA
soybean crush, DDGS output, corn for ethanol, 3pm - FranceAgriMer
weekly update on crop conditions
Source:
Bloomberg and FI
USDA
Export Sales
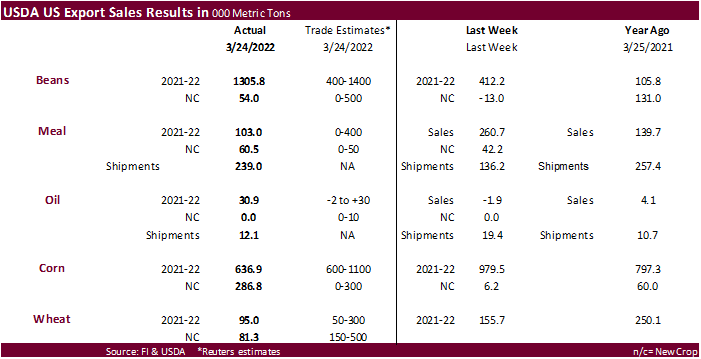
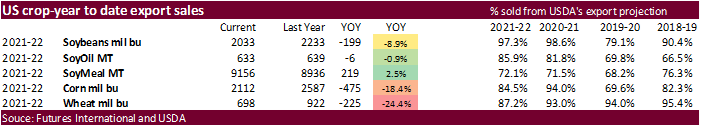
Poor
export sales posted for corn, wheat, and soybean meal, at least on a combined crop year basis. Old crop soybeans and old crop soybean oil were ok. 1.3 million tons were posted for old crop soybeans that included China (593,200 MT, including 121,000 MT switched
from unknown destinations and decreases of 3,600 MT). There were no China corn or wheat sales. Sorghum saw net reductions of 16,200 tons. Pork sales were good at 27,600 tons.
US
Personal Income Feb: 0.5% (est 0.5%; prev 0.0%)
US
Personal Spending Feb: 0.2% (est 0.5%; prev 2.1%)
US
Real Personal Spending Feb: -0.4% (est -0.2%; prev 1.5%)
US
PCE Core Deflator (Y/Y) Feb: 5.4% (est 5.5%; prev 5.2%)
US
PCE Deflator (Y/Y) Feb: 6.4% (est 6.4%; prev 6.1%)
US
Initial Jobless Claims Mar 26: 202K (est 196K; prev 187K)
US
Continuing Claims Mar 19: 1307K (est 1340K; prev 1350K)
Canadian
GDP (M/M) Jan: 0.2% (est 0.2%; prev 0.0%; prevR 0.1%)
Canadian
GDP (Y/Y) Jan: 3.5% (est 3.6%; prev 3.9%; prevR 3.7%)
EIA:
US Crude Oil Production Fell 216K Bpd In Jan To 11.371M Bpd
–
Dec Oil Production Revised Up By 20K Bpd To 11.587M Bpd
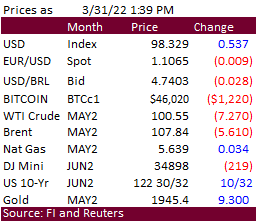
WTI
rolled over again early afternoon
·
US corn futures ended higher after USDA reported a shocking 2022 US corn planted area of 89.5 million acres, below what was estimated for soybeans, and 2.5 million below an average trade guess. Naturally the corn futures back
months appreciated over May and July. May settled 10.75 cents higher and December 27.75 cents higher. Outside markets and sharply lower soybeans limited gains. Funds bought an estimated net 15,000 corn contracts.
·
High fertilizer prices and short supply of the product likely curbed planned corn plantings. But survey collection was during FH March. Since then, corn has rallied, and its possible we could find additional acres when updated
in June as most producers have yet to start plantings. The CZ/SX ratio currently favors corn.
·
WTI crude oil traded sharply lower and was off around $7.80 around 1:40 pm. The US will release an additional 1 million barrels of crude oil from its reserves per day for the next six months.
·
The Buenos Aires grains exchange warned early frosts could further damage corn and soybeans. The exchange estimates soybean production at 42 million tons and corn at 49 million tons.
·
Ukraine is about 10 percent complete on summer crop plantings of about 400,000 hectares, slightly above last year’s pace.
·
Russia plans to increase its export quotas for nitrogen and complex fertilizers. Russia is a major producer of potash, phosphate, and nitrogen, with about 50 million tons produced a year, 13% of the global total.
·
DATAGRO sees Brazil’s 2021-22 corn crop at 118.3 million tons versus 117.8 million previously.
·
The US is still considering removing summer restrictions on E15 ethanol blending in order to lower fuel costs.
·
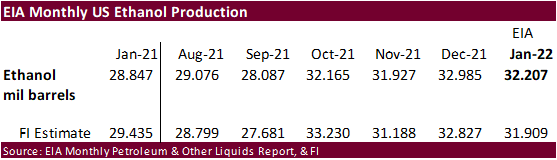
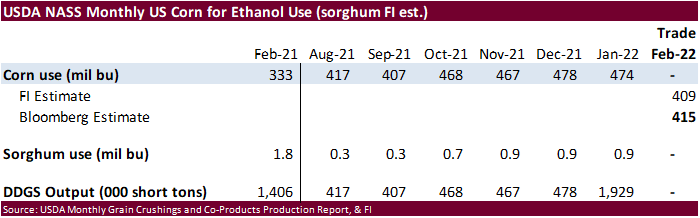
EIA reported January ethanol production slightly above our working estimate.
Corn
Upside and Downside Price Scenarios
Bubela,
H., K. Swanson and G. Schnitkey. “Corn Upside and Downside Price Scenarios.”
farmdoc
daily
(12):41, Department of Agricultural and Consumer Economics, University of Illinois at Urbana-Champaign, March 30, 2022.
Export
developments.
- South
Korea’s FLC and KFA bought a combined 135,000 tons of South American corn Thursday at $381.78 (FLC), $2.5755 over the July contract (FLC), $381.80/ton (KFA), and $2.61 over the July (KFA).
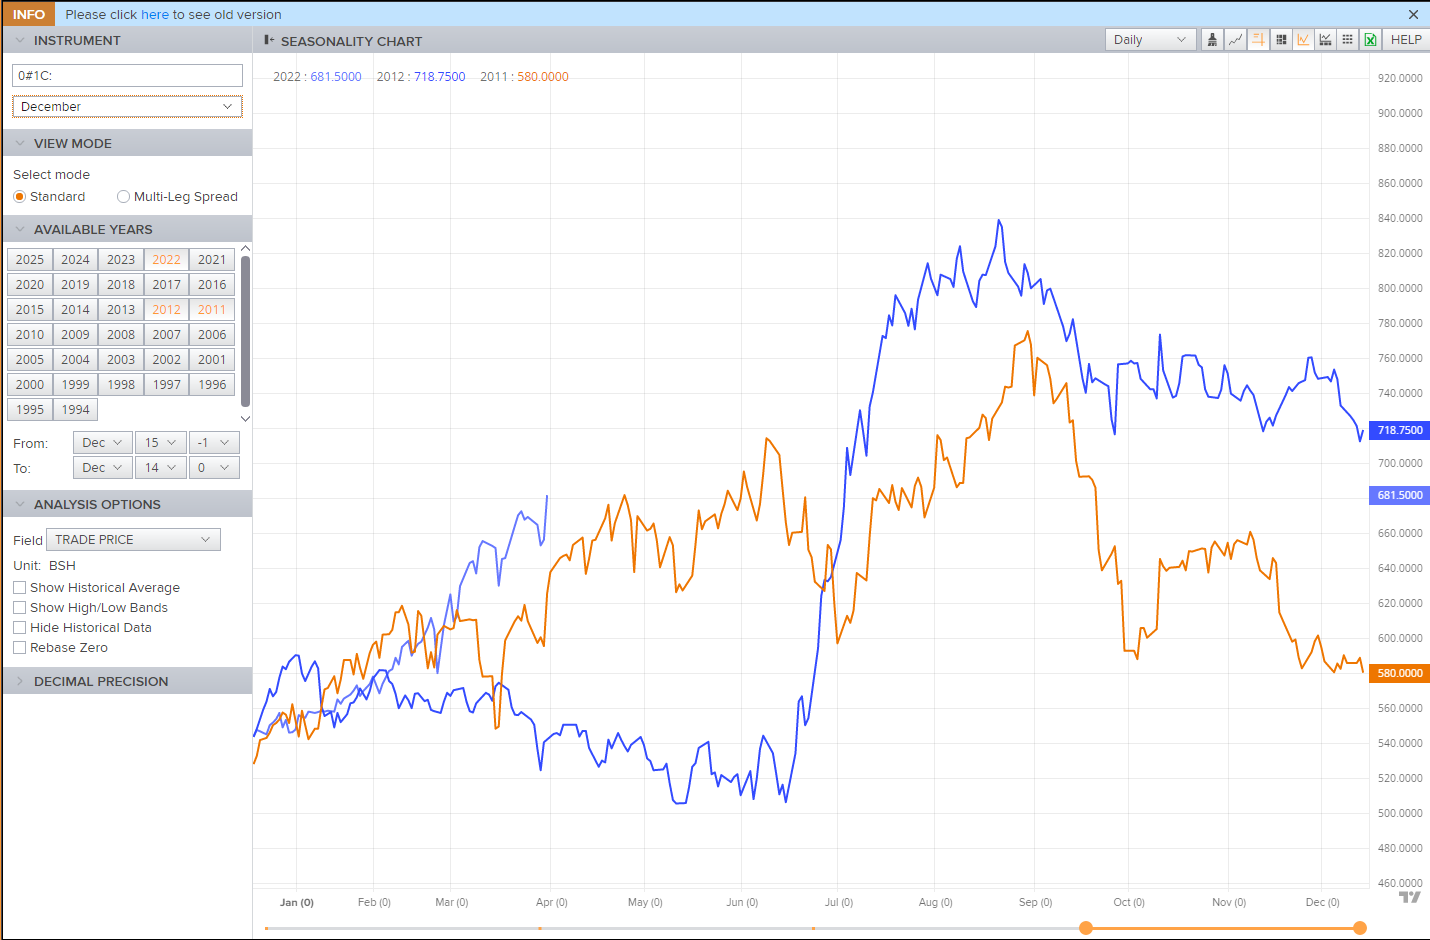
Last
time we saw December corn around these prices was back in 2011 and 2012
Source:
Reuters and FI
Updated
3/31/22
May
corn is seen in a $6.75 and $8.10 range
December
corn is seen in a wide $5.50-$8.00 range
·
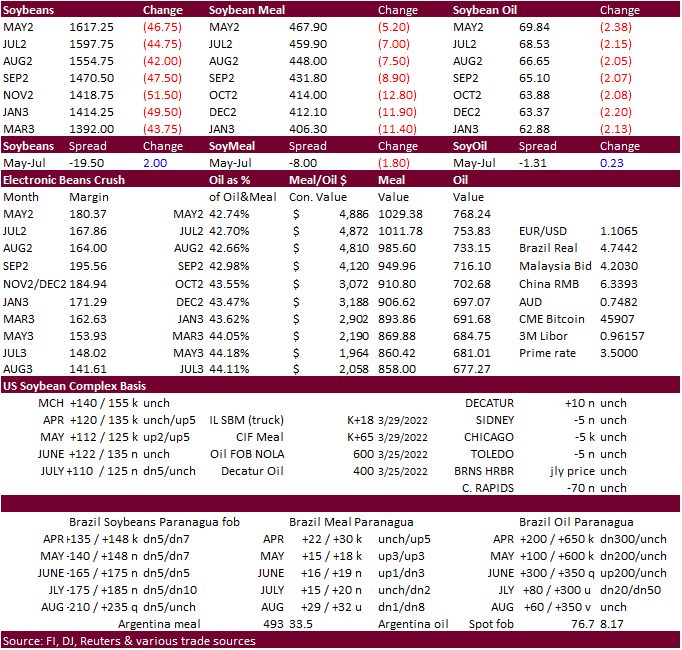
The CBOT soybean complex sank post USDA report after USDA reported soybean plantings intentions at a record 91 million acres, 2.2 million above an average trade guess. The sharp decline in WTI crude oil already had a bearish influence
on soybean oil. Soybean meal was pulled down by soybeans but a higher trade in corn limited losses. Poor export sales for soybeans added to the negative sentiment. Today we saw a lot of positioning ahead of the report, and again in late trading with the quarter
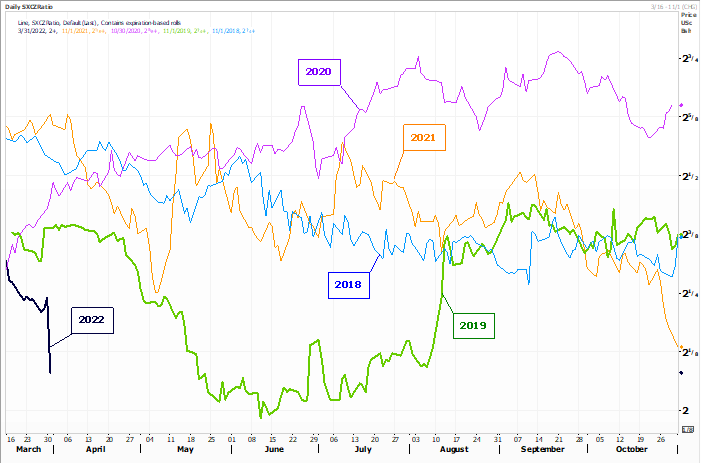
ending. Tomorrow don’t discount new month/new money. The November soybean contract closed 49.75 cents lower and the SX/CZ ratio hit a contract low. May soybeans fell 45.75 cents, May meal was down $5.60 and May soybean oil shed 228 points.
·
Funds sold an estimated net 23,000 soybeans, sold 5,000 meal and sold 8,000 soybean oil.
·
Russia placed quotas on sunflower oil and meal from April 1 through August 31. Sunoil was set at 1.5 million tons and meal at 700,000.
·
(Bloomberg) — Ukraine may collect 53.3m tons of grains and oilseeds in the 2022 season, 51% lower than the record set last year, local consultant APK-Inform.
·
Earlier this week India bought 45,000 tons of Russian sunflower oil at a record high price for shipments in April.
·
ITS reported Malaysian palm oil exports for the month of March at 1.353 million tons, a 7.4 percent increase from February shipments. AmSpec reported 1.292 million tons, a 6.7 percent increase from February.
·
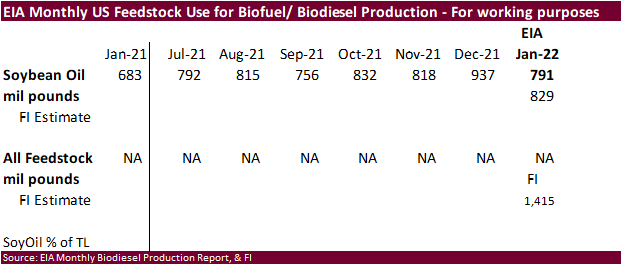
US January soybean oil use for biofuel production was 791 million pounds, below our working estimate but up from 683 million for January 2021. We lowered our crop year SBO for biofuel use by 100 million pounds to 10.9 billion,
200 million above USDA.
·
Turkey bought 18,000 tons of sunflower oil (lowest $1,896.90/ton).
·
China plans to sell about 500,000 tons of soybeans on April 1.
- USDA
seeks 2,710 tons of packaged oil on April 7 for May shipment (May 23-June 13 for plants at posts).
- Qatar
seeks to buy 960k cartons of corn oil in a tender closing April 4.
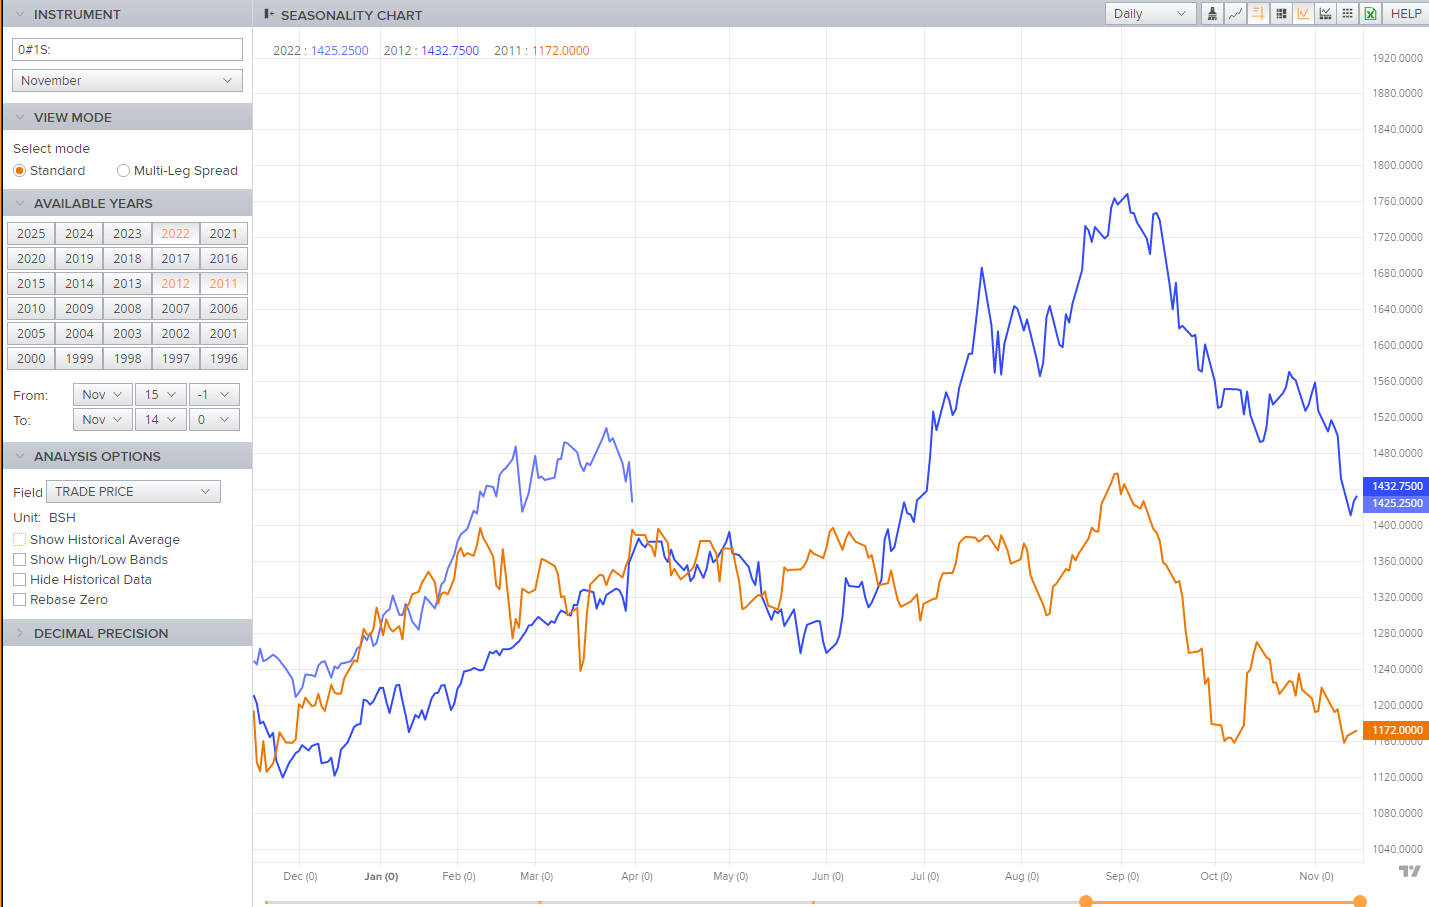
Last
time we saw November soybeans around these prices was back in 2011 and 2012
Source:
Reuters and FI
Nov.
soybeans/Dec. corn ratio
Source:
Reuters and FI
Updated
3/31/22
Soybeans
– November is seen in a wide $12.75-$15.50 range
Soybean
meal – May $430-$500
Soybean
oil – May 68.50-74.00
·
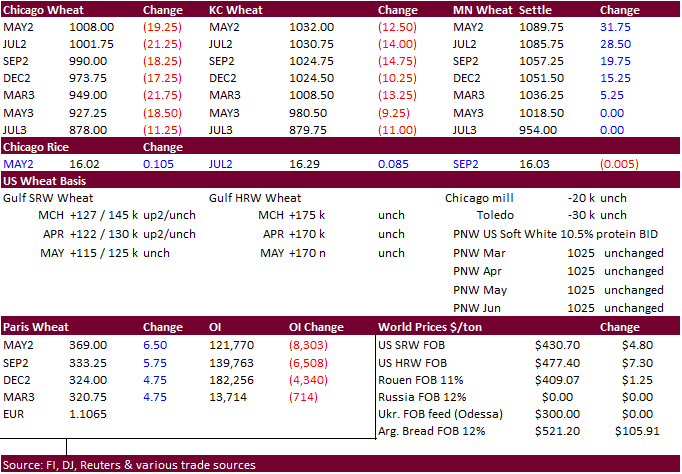
US wheat futures ended lower in Chicago and KC and higher in Minneapolis after USDA reported the other spring planted area at 11.2 million acres, 600,000 below trade expectations. Algeria picking up 600,000 tons of high protein
wheat was also supportive for the MN contracts. March 1 all-wheat stocks fell to 1.025 billion bushels, lowest level for end of Q3 since 2008. USDA trimmed winter wheat seedings by 200,000 acres to 34.2 million.
·
Poor USDA export sales and a higher USD weighted on KC and Chicago wheat.
·
Funds sold an estimated net 5,000 Chicago wheat contracts.
·
China allocated another $315 million USD to winter wheat producers to help stabilize their crop.
·
Ukraine said they have 13 million tons of corn stocks and 3.8 million tons of wheat.
·
May Paris wheat futures were up 6.50 euros (1.8%) to 369.50 euros.
·
Saudi Arabia seeks 355,000 tons of 12.5% protein wheat for Sep-Nov delivery.
·
Jordan passed on 120,000 tons of milling wheat for shipment during May, June, or July.
·
Algeria bought about 600,000 tons of milling wheat with prices around 448/ton C&F for May and/or June shipment.
·
Bangladesh is in for 50,000 tons of wheat with a deadline of April 4.
Bangladesh
seeks 50,000 tons of wheat on April 11 for shipment within 40 days after contract signing.
Rice/Other
·
(Bloomberg) — Qatar is seeking to buy 1.2m bags of rice in a tender that closes April 4, according to the Ministry of Commerce and Industry’s website. Qatar also seeks to buy 960k cartons of corn oil in a tender closing April
4
Updated
3/31/22
Chicago
May $9.00 to $12.00 range, December $8.50-$11.00
KC
May $9.00 to $12.00 range, December $8.75-$11.50
MN
May $9.75‐$12.00, December $9.00-$11.75
U.S. EXPORT SALES FOR WEEK ENDING 3/24/2022
|
|
CURRENT MARKETING YEAR |
NEXT MARKETING YEAR |
||||||
|
COMMODITY |
NET SALES |
OUTSTANDING SALES |
WEEKLY EXPORTS |
ACCUMULATED EXPORTS |
NET SALES |
OUTSTANDING SALES |
||
|
CURRENT YEAR |
YEAR |
CURRENT YEAR |
YEAR |
|||||
|
|
THOUSAND METRIC TONS |
|||||||
|
WHEAT |
|
|
|
|
|
|
|
|
|
HRW |
14.7 |
1,422.3 |
1,426.7 |
179.2 |
6,052.5 |
7,087.1 |
25.8 |
390.4 |
|
SRW |
2.8 |
516.1 |
331.4 |
54.3 |
2,242.5 |
1,451.5 |
55.5 |
419.5 |
|
HRS |
55.4 |
1,020.2 |
1,550.7 |
102.4 |
4,214.4 |
5,927.0 |
0.0 |
372.7 |
|
WHITE |
21.6 |
512.4 |
2,030.7 |
13.0 |
2,816.5 |
4,628.6 |
0.0 |
222.6 |
|
DURUM |
0.5 |
19.0 |
78.3 |
0.3 |
170.0 |
592.1 |
0.0 |
49.4 |
|
TOTAL |
95.0 |
3,489.9 |
5,417.7 |
349.2 |
15,495.9 |
19,686.3 |
81.3 |
1,454.6 |
|
BARLEY |
-8.2 |
5.7 |
5.8 |
0.0 |
14.7 |
23.1 |
8.2 |
8.2 |
|
CORN |
636.9 |
21,473.8 |
31,808.4 |
1,882.4 |
32,180.3 |
33,917.6 |
286.8 |
2,425.5 |
|
SORGHUM |
-16.2 |
2,919.3 |
2,562.8 |
339.2 |
3,840.8 |
3,824.7 |
0.0 |
0.0 |
|
SOYBEANS |
1,305.8 |
11,797.1 |
6,024.9 |
670.2 |
43,544.9 |
54,739.7 |
54.0 |
8,164.8 |
|
SOY MEAL |
103.0 |
3,087.1 |
2,476.8 |
238.9 |
6,068.4 |
6,459.6 |
60.5 |
337.4 |
|
SOY OIL |
30.9 |
186.0 |
107.4 |
12.1 |
447.3 |
531.8 |
0.0 |
0.0 |
|
RICE |
|
|
|
|
|
|
|
|
|
L G RGH |
12.0 |
227.2 |
316.2 |
19.0 |
942.0 |
1,092.6 |
0.0 |
0.0 |
|
M S RGH |
0.0 |
3.3 |
5.3 |
0.2 |
10.9 |
23.5 |
0.0 |
0.0 |
|
L G BRN |
0.2 |
16.4 |
3.7 |
0.3 |
33.6 |
33.9 |
0.0 |
0.0 |
|
M&S BR |
0.1 |
43.9 |
69.0 |
0.2 |
42.5 |
84.4 |
0.0 |
0.0 |
|
L G MLD |
2.4 |
71.9 |
49.4 |
4.4 |
573.6 |
453.6 |
0.0 |
0.0 |
|
M S MLD |
2.2 |
239.2 |
261.1 |
3.4 |
260.9 |
369.7 |
0.0 |
0.0 |
|
TOTAL |
17.0 |
602.0 |
704.7 |
27.5 |
1,863.4 |
2,057.6 |
0.0 |
0.0 |
|
COTTON |
|
THOUSAND RUNNING BALES |
||||||
|
UPLAND |
234.0 |
7,573.8 |
5,105.5 |
331.1 |
6,623.5 |
9,471.5 |
111.7 |
2,464.1 |
|
PIMA |
7.4 |
156.1 |
247.5 |
12.1 |
282.6 |
491.8 |
8.2 |
23.1 |
This
summary is based on reports from exporters for the period March 18-24, 2022.
Wheat: Net
sales of 95,000 metric tons (MT) for 2021/2022 were down 39 percent from the previous week and 58 percent from the prior 4-week average. Increases primarily for South Korea (45,000 MT), Mexico (30,500 MT, including decreases of 1,200 MT), Guatemala (29,800
MT switched from unknown destinations), Colombia (27,000 MT, including 25,000 MT switched from unknown destinations), and El Salvador (18,800 MT switched from unknown destinations), were offset by reductions primarily for unknown destinations (60,800 MT) and
Nigeria (15,900 MT). Net sales of 81,300 MT for 2022/2023 were reported for Mexico (32,000 MT), Colombia (31,300 MT), Nigeria (13,000 MT), and Peru (5,000 MT). Exports of 349,200 MT were down 5 percent from the previous week, but up 2 percent from the prior
4-week average. The destinations were primarily to Mexico (113,600 MT), Japan (83,100 MT), the Philippines (65,500 MT), Colombia (44,600 MT), and Nigeria (33,100 MT).
Corn:
Net sales of 636,900 MT for 2021/2022 were down 35 percent from the previous week and 53 percent from the prior 4-week average. Increases primarily for Japan (217,800 MT, including 125,000 MT switched from unknown destinations and decreases of 7,600 MT),
Colombia (103,800 MT, including 41,000 MT switched from unknown destinations and decreases of 20,100 MT), Mexico (86,600 MT, including decreases of 116,600 MT), Vietnam (69,300 MT, including 68,000 MT switched from unknown destinations), and Taiwan (66,000
MT switched from unknown destinations), were offset by reductions primarily for unknown destinations (74,300 MT), Lebanon (50,000 MT), and China (18,400 MT). Net sales of 286,800 MT for 2022/2023 were reported for unknown destinations (254,800 MT), Mexico
(30,000 MT), and Honduras (2,000 MT). Exports of 1,882,400 MT were up 26 percent from the previous week and 24 percent from the prior 4-week average. The destinations were primarily to China (457,600 MT), Japan (432,200 MT), Mexico (335,200 MT), Colombia
(170,800 MT), and Canada (96,800 MT).
Optional
Origin Sales:
For 2021/2022, new optional origin sales of 60,000 MT were reported for unknown destinations. Options were exercised to export 65,000 MT to unknown destinations from the United States. The current outstanding balance of 530,800
MT is for unknown destinations (300,000 MT), South Korea (130,000 MT), Morocco (60,000 MT), Italy (31,800 MT), and Saudi Arabia (9,000 MT). For 2022/2023, the current outstanding balance of 3,900 MT is for Italy.
Export
Adjustments:
Accumulated exports of corn to Mexico were adjusted down 698 MT for week ending March 17th. This shipment was reported in error.
Barley:
Total net sales reductions of 8,200 MT for 2021/2022 were up noticeably from the previous week and from the prior 4-week average. The destination was Japan. Total net sales of 8,200 MT for 2022/2023 were for Japan. No exports were reported for the week.
Sorghum:
Net sales reductions of 16,200 MT for 2021/2022–a marketing-year low–were up noticeably from the previous week, but down noticeably from the prior 4-week average. Increases reported for China (50,800 MT, including 68,000 MT switched from unknown destinations
and decreases of 23,000 MT) and Japan (1,000 MT), were more than offset by reductions for unknown destinations (68,000 MT). Exports of 339,200 MT–a marketing-year high–were up 33 percent from the previous week and 58 percent from the prior 4-week average.
The destinations were primarily to China (328,300 MT) and Japan (10,500 MT).
Rice:
Net sales of 17,000 MT for 2021/2022 were down 80 percent from the previous week and 71 percent from the prior 4-week average. Increases were primarily for Guatemala (5,500 MT), Honduras (3,500 MT, including decreases of 400 MT), Mexico (3,300 MT), Canada
(2,600 MT), and Saudi Arabia (800 MT). Exports of 27,500 MT were down 49 percent from the previous week and from the prior 4-week average. The destinations were primarily to Guatemala (11,000 MT), Honduras (6,000 MT), Canada (3,300 MT), Mexico (2,700 MT),
and Jordan (1,600 MT).
Soybeans:
Net sales of 1,305,800 MT for 2021/2022 were up noticeably from the previous week and up 11 percent from the prior 4-week average. Increases were primarily for China (593,200 MT, including 121,000 MT switched from unknown destinations and decreases of 3,600
MT), unknown destinations (520,700 MT), the Netherlands (56,000 MT, including 60,000 MT switched from unknown destinations and decreases of 4,000 MT), Japan (55,600 MT, including decreases of 2,100 MT), and Taiwan (32,400 MT, including decreases of 100 MT).
Total net sales of 54,000 MT for 2022/2023 were for Mexico. Exports of 670,200 MT were up 22 percent from the previous week, but down 6 percent from the prior 4-week average. The destinations were primarily to China (331,900 MT), Vietnam (65,600 MT), Mexico
(63,300 MT), Egypt (57,100 MT), and the Netherlands (56,000 MT).
Export
for Own Account:
For 2021/2022, the current exports for own account outstanding balance is 3,000 MT, all Canada.
Soybean
Cake and Meal:
Net sales of 103,000 MT for 2021/2022 were down 61 percent from the previous week and 50 percent from the prior 4-week average. Increases primarily for the Philippines (47,200 MT, including decreases of 2,200 MT), Ecuador (33,500 MT, including decreases of
2,500 MT), Morocco (30,000 MT), Canada (22,100 MT, including decreases of 600 MT), and Mexico (7,000 MT), were offset by reductions primarily for unknown destinations (52,900 MT). Net sales of 60,500 MT for 2022/2023 were reported for unknown destinations
(60,000 MT) and Japan (500 MT). Exports of 238,900 MT were up 75 percent from the previous week and 22 percent from the prior 4-week average. The destinations were primarily to the Philippines (94,600 MT), Honduras (27,900 MT), the Dominican Republic (24,900
MT), Canada (22,800 MT), and Mexico (21,400 MT).
Soybean
Oil:
Net sales of 30,900 MT for 2021/2022 were up noticeably from the previous week and from the prior 4-week average. Increases were reported for Guatemala (19,500 MT), unknown destinations (6,500 MT), Costa Rica (4,000 MT), Canada (600 MT), and the Dominican
Republic (300 MT, including decreases of 1,400 MT). Exports of 12,100 MT were down 38 percent from the previous week and 14 percent from the prior 4-week average. The destinations were to the Dominican Republic (7,400 MT), Venezuela (3,000 MT), Mexico (1,300
MT), and Canada (400 MT).
Cotton:
Net sales of 234,000 RB for 2021/2022 were down 24 percent from the previous week and 32 percent from the prior 4-week average. Increases primarily for China (177,000 RB, including decreases of 2,800 RB), Vietnam (21,300 RB, including 1,600 RB switched from
China, 800 RB switched from South Korea, and decreases of 1,000 RB), Turkey (13,800 RB, including decreases of 100 RB), Indonesia (5,000 RB, including 600 RB switched from Japan), and Taiwan (4,800 RB), were offset by reductions for Italy (2,200 RB), South
Korea (800 RB), and Bangladesh (300 RB). Net sales of 111,700 RB for 2022/2023 were primarily for Turkey (47,200 RB), Thailand (29,100 RB), Pakistan (13,800 RB), Vietnam (11,400 RB), and India (8,800 RB). Exports of 331,100 RB were down 25 percent from the
previous week and 8 percent from the prior 4-week average. The destinations were primarily to China (89,900 RB), Turkey (52,400 RB), Vietnam (47,000 RB), Pakistan (38,500 RB), and Mexico (20,000 RB). Net sales of Pima totaling 7,400 RB were up noticeably
from the previous week and up 27 percent from the prior 4-week average. Increases were primarily for India (3,500 RB), Peru (900 RB), China (900 RB), Bangladesh (800 RB), and Egypt (600 RB). Net sales of 8,200 RB for 2022/2023 were primarily for India (4,400
RB) and Peru (2,600 RB). Exports of 12,100 RB were up noticeably from the previous week and up 2 percent from the prior 4-week average. The destinations were primarily to India (5,200 RB), China (3,100 RB), Peru (2,400 RB), Vietnam (1,000 RB), and Pakistan
(200 RB).
Optional
Origin Sales:
For 2021/2022, the current outstanding balance of 57,200 RB is for Vietnam (52,800 RB) and Pakistan (4,400 RB).
Exports
for Own Account: For
2021/2022, the current exports for own account outstanding balance is 100 RB, all Vietnam.
Hides
and Skins:
Net sales of 332,600 pieces for 2022 were down 20 percent from the previous week and from the prior 4-week average. Increases primarily for China (212,100 whole cattle hides, including decreases of 18,800 pieces), Thailand (39,400 whole cattle hides, including
decreases of 1,000 pieces), Mexico (26,100 whole cattle hides, including decreases of 700 pieces), Taiwan (24,900 whole cattle hides, including decreases of 700 pieces), and South Korea (19,400 whole cattle hides, including decreases of 1,100 pieces), were
offset by reductions for Indonesia (800 pieces) and Brazil (100 pieces). Total net sales reductions of 1,400 calf skins were for Italy. Exports of 502,500 pieces were up 3 percent from the previous week and 17 percent from the prior 4-week average. Whole
cattle hides exports were primarily to China (286,200 pieces), South Korea (65,300 pieces), Mexico (62,200 pieces), Thailand (51,600 pieces), and Indonesia (9,500 pieces). Total exports of 5,600 calf skins were to Italy. In addition, total exports of 1,200
kip skins were to China.
Net
sales of 79,600 wet blues for 2022 were down 76 percent from the previous week and 39 percent from the prior 4-week average. Increases primarily for China (46,000 unsplit), Italy (6,800 grain splits and 4,800 unsplit, including decreases of 100 unsplit and
100 grain splits), Vietnam (11,400 unsplit, including decreases of 100 unsplit), India (6,900 grain splits), and Thailand (6,500 unsplit, including decreases of 300 unsplit),
were offset by reductions primarily for the Dominican Republic (7,200 grain splits). Exports of 180,600 wet blues were down 7 percent from the previous week, but up 35 percent from the prior 4-week average. The destinations were primarily to Italy (28,700
grain splits and 26,900 unsplit), China (44,500 unsplit), Vietnam (40,800 unsplit), Thailand (13,300 unsplit), and Taiwan (10,900 unsplit). Net sales of 1,228,600 splits were up noticeably from the previous week and up 88 percent from the prior 4-week average.
The destinations were primarily for Vietnam (784,300 pounds, including decreases of 26,500 pounds) and South Korea (399,200 pounds, including decreases of 10,700 pounds). Exports of 537,300 pounds were up 66 percent from the previous week and 12 percent from
the prior 4-week average. The destinations were to Vietnam (413,100 pounds) and China (124,200 pounds).
Beef:
Net sales of 23,000 MT for 2022 were down 17 percent from the previous week and 7 percent from the prior 4-week average. Increases primarily for China (7,100 MT, including decreases of 200 MT), Japan (5,300 MT, including decreases of 500 MT), South Korea
(4,600 MT, including decreases of 700 MT), Taiwan (1,100 MT, including decreases of 200 MT), and Mexico (1,000 MT), were offset by reductions for Kuwait (100 MT). Exports of 20,400 MT were down 51 percent from the previous week and 11 percent from the prior
4-week average. The destinations were primarily to South Korea (6,500 MT), Japan (5,200 MT), China (3,100 MT), Taiwan (1,600 MT), and Mexico (900 MT).
Pork:
Net sales of 27,600 MT for 2022 were up 19 percent from the previous week, but down 14 percent from the prior 4-week average. Increases primarily for Mexico (14,300 MT, including decreases of 300 MT), Japan (4,000 MT, including decreases of 200 MT), South
Korea (2,400 MT, including decreases of 500 MT), Canada (2,300 MT, including decreases of 700 MT), and the Dominican Republic (1,200 MT), were offset by reductions for Chile (300 MT) and El Salvador (100 MT). Exports of 30,600 MT were up 5 percent from the
previous week and 8 percent from the prior 4-week average. The destinations were primarily to Mexico (13,200 MT), Japan (5,400 MT), China (3,500 MT), South Korea (2,900 MT), and Canada (1,600 MT).
Terry Reilly
Senior Commodity Analyst – Grain and Oilseeds
Futures International
One Lincoln Center
18 W 140 Butterfield Rd.
Oakbrook Terrace, Il. 60181
W: 312.604.1366
ICE IM:
treilly1
Skype: fi.treilly

Trading of futures, options, swaps and other derivatives is risky and is not suitable for all persons. All of these investment products are leveraged, and you can lose more than your initial deposit. Each investment product is offered
only to and from jurisdictions where solicitation and sale are lawful, and in accordance with applicable laws and regulations in such jurisdiction. The information provided here should not be relied upon as a substitute for independent research before making
your investment decisions. Futures International, LLC is merely providing this information for your general information and the information does not take into account any particular individual’s investment objectives, financial situation, or needs. All investors
should obtain advice based on their unique situation before making any investment decision. The contents of this communication and any attachments are for informational purposes only and under no circumstances should they be construed as an offer to buy or
sell, or a solicitation to buy or sell any future, option, swap or other derivative. The sources for the information and any opinions in this communication are believed to be reliable, but Futures International, LLC does not warrant or guarantee the accuracy
of such information or opinions. Futures International, LLC and its principals and employees may take positions different from any positions described in this communication. Past results are not necessarily indicative of future results.