PDF Attached
Bloomberg
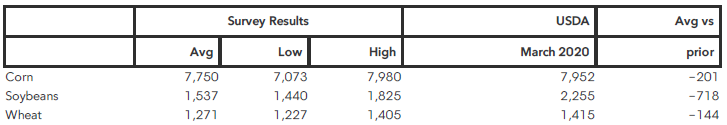
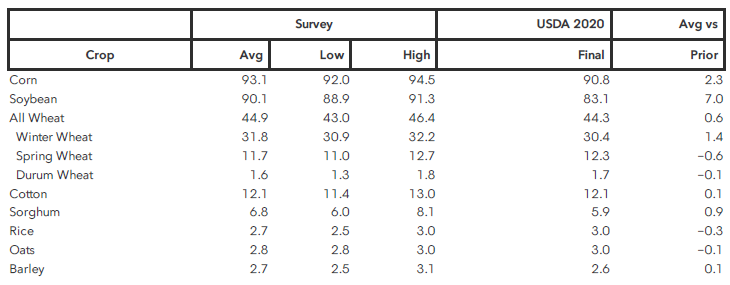
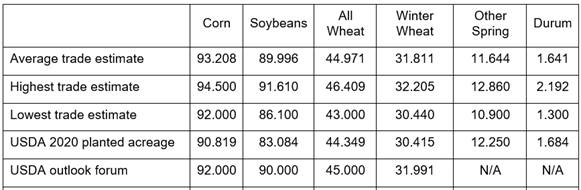
USDA survey results, US stocks & plantings
Reuters
trade estimates
Stocks:
Plantings:
![]()

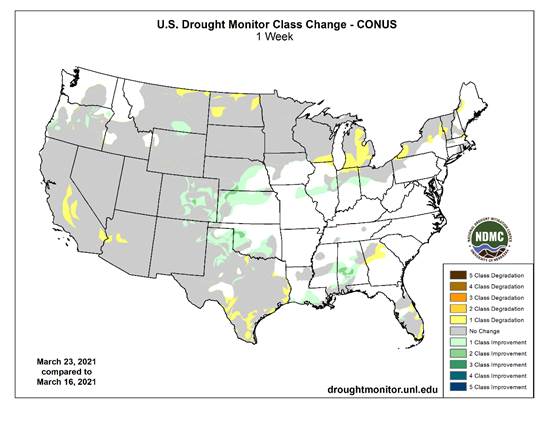
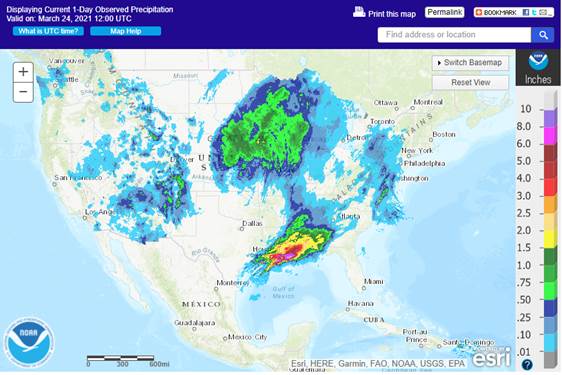
GFS
model run in showing a ridge of high pressure over the central U.S. throughout much of the second week of the outlook. The US southern and central Great Plains (HRW) bias eastern areas saw rain Wed-Thur. Too much precipitation for the Delta that will slow
fieldwork activity. Midwest will not start planting for a week or two so there is no concern there except for the Ten River Basin where too much rain will occur. Eastern Australia will continue to dry down. Brazil will see a drier bias over the next week.
Monsoon rains are expected to withdraw later in April. Argentina will see additional rains into Friday.
World
Weather Inc.
OVERNIGHT
MODEL CHANGES
UNITED
STATES
- No
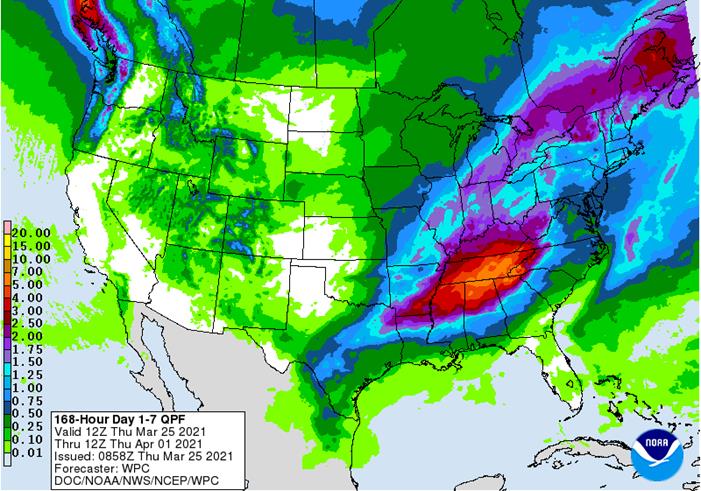
theme changes in the first week - Drier
and warmer second week outlook - Rain
was removed from the Delta into the central Plains April 5-6 - A
little too much rain may have been removed, but the high pressure ridge should be notable - Showers
and thunderstorms were increased April 6-8 as frontal system moves into the Plains - Greater
rainfall may be needed in future model runs
CANADA
PRAIRIES
- No
big changes in first week – light to moderate snow and rain still expected early next week in southeastern Prairies - Greater
precipitation in northwestern Prairies (northern Alberta and northwestern Saskatchewan) April 4-6 - The
event is overdone - Precipitation
added to eastern Prairies April 6-7 - The
event may be overdone, but may verify to some extent
ARGENTINA
- Rain
event under way today is evolving as expected – no change in the first week outlook with drier weather late this weekend and next week - Next
frontal system and precipitation event is expected late next week - GFS
model increased rain in northern Argentina April 5-6 and reduced it in southeastern Argentina - The
change was needed
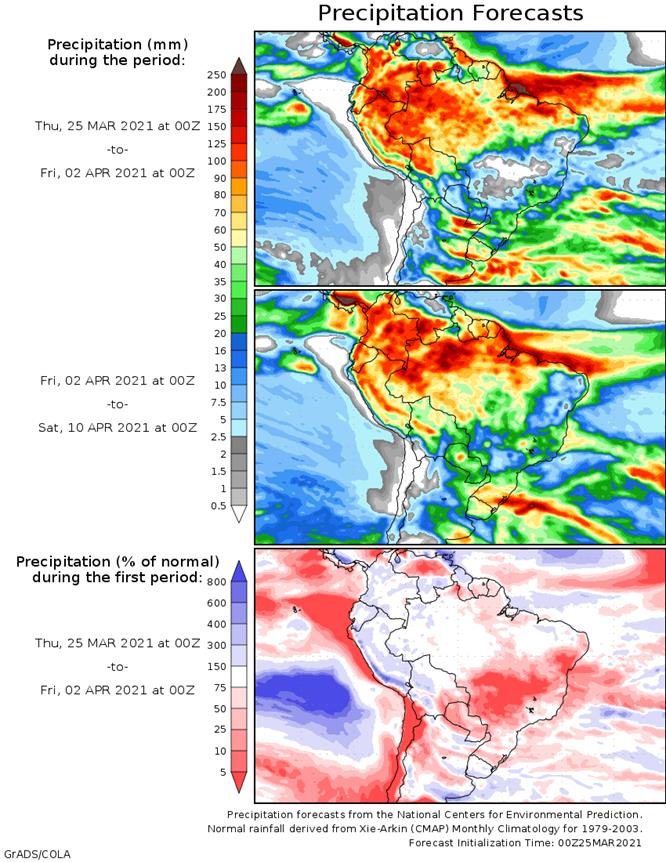
BRAZIL
- No
significant changes were noted for the next ten days with net drying southeastern half of Mato Grosso, Mato Grosso do Sul and western and northern Parana into Bahia - GFS
reduced rain in southern Brazil and parts of Paraguay April 4-6 - The
reduction was needed - GFS
increased rain from Mato Grosso to Minas Gerais April 7-8 - Some
increase was needed - GFS
reduced rain in far southern Brazil (Rio Grande do Sul) April 7-8 - Some
reduction was needed
EUROPE
- No
significant change in the first week of the outlook
CIS
- No
significant change was noted in the first week of the outlook – rain event is under way from eastern Ukraine to Kazakhstan
CHINA
- No
changes were noted in the first week of the outlook - GFS
was a little drier in the northern North China Plain and into southern Jilin April 1-3 - This
change was needed - GFS
increased rain in east-central China April 4-6 - Some
increase was needed
AUSTRALIA
- No
changes were noted through day 10 – eastern Australia will experience net drying throughout the period; all of southern Australia will be dry biased as well
SOUTH
AFRICA
- No
changes were noted in the first week of the outlook
Source:
World Weather inc.
Bloomberg
Ag Calendar
Thursday,
March 25:
- USDA
weekly crop net-export sales for corn, soybeans, wheat, cotton, pork, beef, 8:30am - Seminar
on sustainable palm oil in India by the Solvent Extractors’ Association and the Malaysian Palm Oil Board - International
Grains Council monthly report - Port
of Rouen data on French grain exports - Malaysia’s
March 1-25 palm oil export data - USDA
hogs & pigs Inventory, red meat production
Friday,
March 26:
- ICE
Futures Europe weekly commitments of traders report (6:30pm London) - CFTC
commitments of traders weekly report on positions for various U.S. futures and options, 3:30pm - FranceAgriMer
weekly update on crop conditions
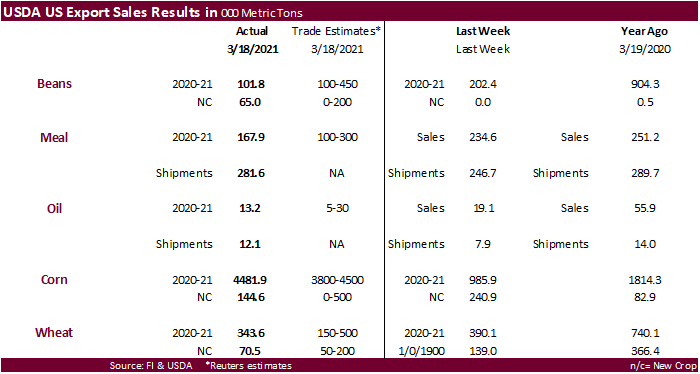
USDA
Export Sales
Soybeans
were disappointing, meal & SBO ok, corn at upper end of expectations and wheat within. China bought sorghum and pork sales were 38,700 tons.
Macro
US
GDP Annualized (Q/Q) Q4 T: 4.3% (exp 4.1%; prev 4.1%)
–
Personal Consumption Q4 T: 2.3% (exp 2.4%; prev 2.4%)
–
GDP Price Index Q4 T: 2.0% (exp 2.1%; prev 2.1%)
–
Core PCE (Q/Q) Q4 T: 1.3% (exp 1.4%; prev 1.4%)
US
Initial Jobless Claims Mar-20: 684K (exp 730K; R prev 781K)
–
Continuing Claims Mar-13: 3870K (exp 4000K; R prev 4134K)
Stranded
Suez Canal Vessel’s Grounding Situation Has Not Been Resolved – RTRS Citing Evergreen
Corn
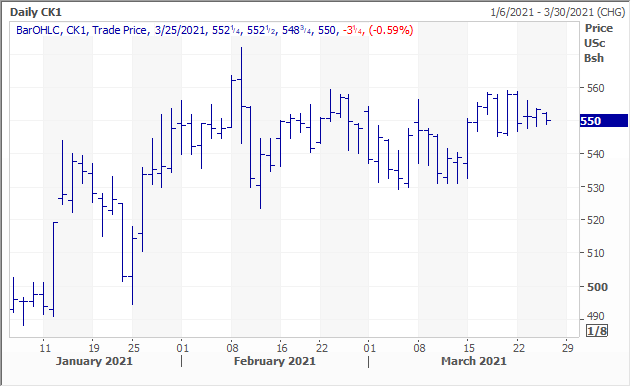
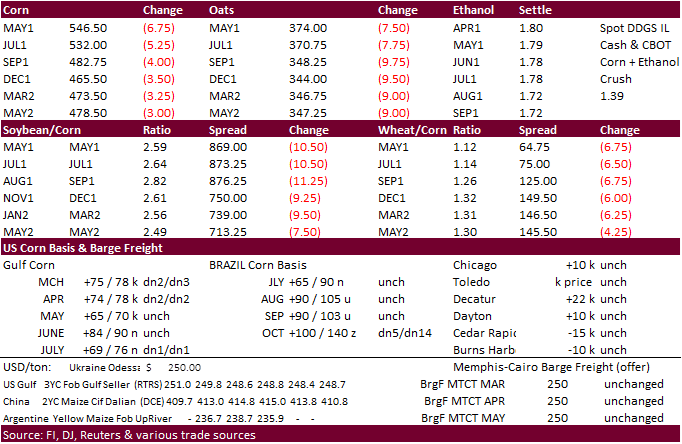
- May
corn closed 6.75 cents lower at $5.4650, just above its 20-day MA. It traded below its 50-day MA today but failed to attract a good number of sellers. Low today was $5.4150. The next support level for May corn is seen at $5.3550.
Last
three May corn trading days have been “inside” days. The breakout to the downside is seen bearish.
- CBOT
corn was lower following weakness in WTI, related agriculture markets, and higher USD. USDA in its export sales report (neutral view) confirmed China corn buying last week (see text after wheat comment). Note the USDA quarterly pig report, released after
the close, was initially seen as bearish CBOT corn futures.
- Funds
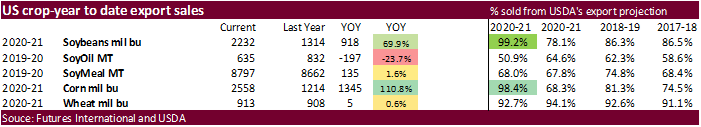
on Thursday sold an estimated net 20,000 contracts. - 98.4%
of USDA’s corn export forecast had been sold as of March 18. We look for USDA to increase corn exports 75-100 million bushels in April.
- The
EIA (Energy Information Administration) will expand their biofuel data in its monthly report to by adding renewable fuels on March 31, including production capacities for biodiesel and feedstocks used in the production. It will be called Monthly Biofuels
Capacity and Feedstocks Update, replacing Monthly Biodiesel Production Report. USDA will adopt the data.
- At
least eight tugboats are trying to free the massive container ship that ran aground in the Suez Canal, blocking up around 150 ships. It is too early to tell how long it will take to free the ship. Roughly 30% of the world’s shipping container volume transits
through the 193 km (120 miles) Suez Canal daily, and about 12% of total global trade of all goods. Some grain flows through the canal. We don’t see a disruption in global grain trade flows at this moment.
- Mexico’s
CNPAMM federation (represents more than 200,000 farmers) estimated Mexico’s corn production less than 24 million tons, well below the government projection of nearly 27 million tons (agriculture ministry’s SIAP). Last year Mexico produced about 27.5 million
tons. - (IGC)
International Grains Council (IGC) global grain production was projected at a record 2.287 billion tons for 2021-22 season.
- Wheat
790 million tons, up from 774 million last season - Corn
1.193 billion tons, up from 1.139 billion - Soybeans
383 million tons, up from 361 million in 2020/21.
Quarterly
hogs and pigs: USDA
reported the swine herd fell 2% as of March 1 from a year ago, while the industry thought it would slightly expand. COVID-19 that temporarily closed production facilities around this time year ago prompted animal unit producers to scale back on units. Higher
priced feed inputs also likely impacted the national number of animal units. The US swine herd totaled 74.773 million pigs as of March 1, down from 76.179 million a year ago (average estimate was 76.230 million).
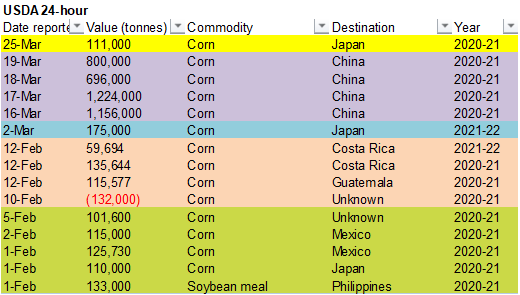
Export
developments.
- USDA
24-hour system reported 111,000 tons of 2020-21 corn for Japan.
Updated
3/24/21
May
corn is seen in a $5.35 and $5.55 range.
July
is seen in a $5.10 and $5.75 range.
December
corn is seen in a $3.85-$5.50 range.
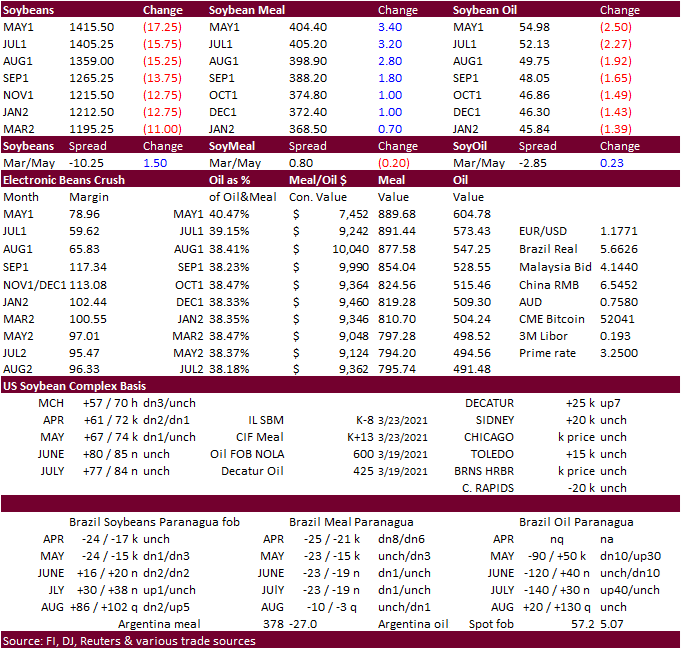
- May
soybean oil ended limit lower (250 points) at 54.98, May meal up $3.60 at $404.60, and May soybeans down 18.50 cents at $14.1425.
- Disappointing
USDA export sales added pressure to soybean futures (product sales were ok – see text after wheat section). Soybeans were initially weaker this morning following a lower trade in WTI crude oil, higher USD, and lack of US export developments for the balance
this week. Soybean oil traded choppy and is currently leading the complex lower. May SBO filled its 56.37 gap.
53.28-30
is seen as the next support level. - Funds
on Thursday
sold
an estimated net 14,000 soybean contracts, bought 3,000 soybean meal and sold 13,000 soybean oil.
- Russia
said they may soon propose a restrictive export tax on sunflower seeds from July 1 and a formula-based export tax on sunflower oil from September 1. Apparently, the export tax for sunflower oil will be based on a formula, set at 70% of the difference between
a base price per ton and a cut-off price not yet disclosed. - Argentine
sold 12.45 million tons of 2020/21 soybeans (latest week +552,500 tons) – Ministry of Agriculture
- There
were no changes to CBOT registrations. - MEDIA-Renewable
energy firm Sunseap Group weighs IPO – Bloomberg News – Reuters - ITS:
Malaysian March 1-25 palm exports up 10 percent to 1.011 million tons from 919,765 tons.
- AmSpec:
Malaysian March 1-25 palm exports up 10.4 percent to 1.018 million tons from 921,929 tons.
Export
Developments
- None
reported.
May
soybean oil share
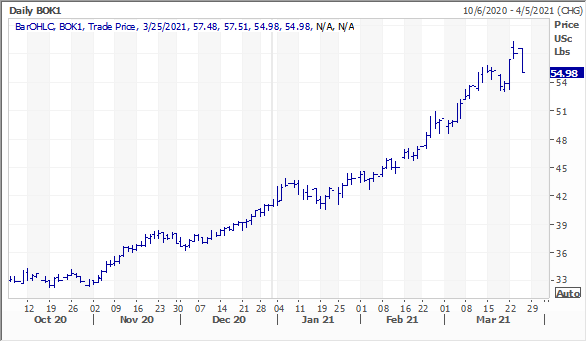
Updated
3/25/21
May
soybeans are seen in a $13.75 and $14.75 range.
May
soymeal is seen in a $390 and $420 range.
May
soybean oil is seen in a 53 and 58 cent range (dn
200, unch)
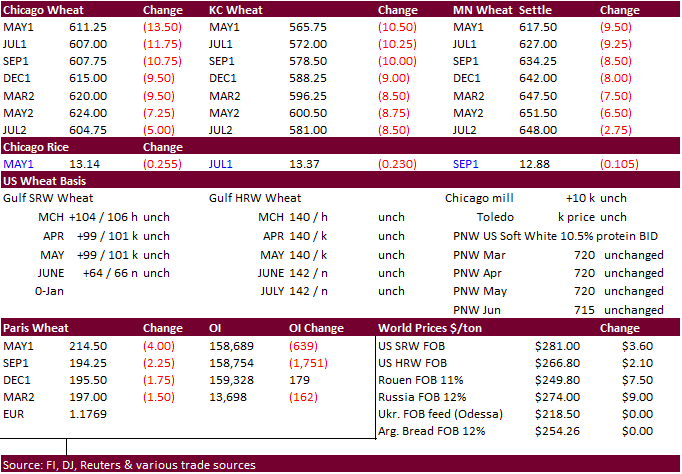
- May
Chicago wheat ended 12.25 cents lower, May KC 9.50 cents lower and May MN 9.50 cents lower. Chicago hit a three month low.
- US
wheat futures were lower led by Chicago (fund selling) after rains fell across the US over the past day, boosting soil moisture levels, and an upward production revision to the Russian wheat crop to nearly 80 million tons. USDA export sales were down from
the previous week but withing expectations (see text after the rice section) The USD was higher.
- Over
the past day the northern Great Plains bias the eastern crop areas saw good precipitation.
Past
7 days

- IKAR:
Russian wheat forecast 79.8 million tons from 78 million tons and exports 39.5 million tons (up 1 million tons previous). We have not seen the USDA Attaché publish a 2021-22 Russia wheat S&D yet.
- South
Korea bought at least 459,000 tons of feed wheat this week. After two South Korean groups about 262,000 tons of feed wheat on Wednesday, South Korea’s NOFI group bought 131,000 tons of feed wheat, optional origin, for arrival around August 5 and September
25. And later, MFG in their third import tender this week picked up another 66,000 tons of feed wheat at $268.40/ton c&f for arrival around October 20.
- Funds
on Thursday
sold
an estimated net 8,000 SRW wheat contracts. - EU
May milling wheat traded below a support level of 216 euros, then hit a session low of 213.50 and settled 4.50 lower at 214.00. Next level of support is seen at 210.50.
- The
European Commission estimated soft wheat production for the EU-27 at 126.7 million tons in 2021-22 from 117.1 million for 2020-21. Soft wheat exports were seen at 30.0 million tons compared to 27.0 million this season.
- South
Korea’s NOFI group bought 131,000 tons of feed wheat, optional origin, for arrival around August 5 and September 25, at an estimated $287.00 & $268.48/ton c&f.
- MFG
in their third import tender this week picked up another 66,000 tons of feed wheat at $268.40/ton c&f for arrival around October 20.
- Ethiopia
seeks 400,000 tons of optional origin milling wheat, on April 20, valid for 30 days. In January Ethiopia cancelled 600,000 tons of wheat from a November import tender because of contractual disagreements.
- Jordan
will be back in for feed barley on March 30. Possible shipment combinations are Oct. 1-15, Oct. 16-31, Nov. 1-15 and Nov. 16-30, the same periods as sought in the previous two tenders.
- Results
awaited: South Korean group SPC seeks 35,000 tons of milling wheat from the United States and Canada on March 23. for arrival in July.
Rice/Other
·
Ethiopia seeks 170,000 tons of parboiled rice on April 20.
·
Yesterday Sinograin estimated China’s cotton crop at 5.95 million tons up from an estimated 5.8 million tons in 2019-20.
·
Results awaited: South Korea’s Agro-Fisheries & Food Trade Corp. seeks 208,217 tons of rice, on March 25 for arrival in South Korea in 2021 between May 1 and Oct. 31. 64,444 tons of non-glutinous
brown rice is sought from the United States. Rest from Thailand, China, Australia and Vietnam.
·
Syria seeks 25,000 tons of white rice on March 29, from China or Egypt.
·
Syria seeks 39,400 tons of white rice on April 19. Origin and type might be White Chinese rice or Egyptian short grain rice.
Updated
3/25/21
May
Chicago wheat is seen in a $6.00‐$6.60 range (dn 15, dn 15)
May
KC wheat is seen in a $5.55‐$6.50 range (dn 10, dn 10)
May
MN wheat is seen in a $6.05‐$6.40 range (dn 10, dn 10)
USDA Export Sales
This
summary is based on reports from exporters for the period March 12 – 18, 2021.
Wheat: Net
sales of 343,600 metric tons (MT) for 2020/2021 were down 12 percent from the previous week, but up 24 percent from the prior 4-week average. Increases primarily for Japan (118,800 MT), South Korea (116,400 MT, including decreases of 500 MT and 65,000 MT
late), China (76,300 MT, including 65,000 MT switched from unknown destinations), Algeria (63,700 MT, including 35,000 MT switched from unknown destinations and decreases of 1,300 MT), and Bangladesh
(61,600 MT, including 57,000 MT switched from unknown destinations), were offset by reductions primarily for unknown destinations (215,200 MT). For 2021/2022, net sales of 70,500 MT were reported for the Philippines (58,000 MT), Mexico (10,000 MT), unknown
destinations (2,000 MT), and Colombia (500 MT). Exports of 658,800 MT were unchanged from the previous week, but up 37 percent from the prior 4-week average. The destinations were primarily to Bangladesh (116,600 MT), Japan (81,500 MT), Algeria (73,700 MT),
China (70,300 MT), and Mexico (64,300 MT).
Optional
Origin Sales:
For 2020/2021, decreases totaling 10,000 MT were reported for Spain.
Late
Reporting:
For 2020/2021, net sales totaling 65,000 MT of white wheat was reported late for South Korea.
Corn:
Net sales of 4,481,900 MT for 2020/2021 were up noticeably from the previous week and from the prior 4-week average.
Increases primarily for China (3,890,600 MT), South Korea (353,300 MT, including 125,000 MT switched from unknown destinations, decreases of 31,000 MT, and 66,000 MT late), Mexico (196,000 MT, including
13,000 MT switched from unknown destinations and decreases of 29,600 MT), Colombia (131,100 MT, including 93,300 MT switched from unknown destinations and decreases of 9,500 MT), and Indonesia (75,000 MT, including 66,000 MT switched from unknown destinations),
were offset by reductions primarily for unknown destinations (461,800 MT). For
2021/2022, net sales of 144,600 MT were reported for
Mexico (90,000 MT), unknown destinations (50,000 MT), and Japan (4,600 MT). Exports of 2,036,000 MT were down 7 percent from the previous week, but up 17 percent from the prior 4-week average. The destinations were primarily to Mexico (470,200 MT),
China (418,100 MT), South Korea (349,300 MT), Japan (197,300 MT), and Colombia (146,300 MT).
Optional
Origin Sales:
For 2020/2021, options were exercised to export 189,000 MT to South Korea from the United States. The current outstanding balance of 890,400 MT is for South Korea (549,000 MT), unknown destinations (244,000 MT), China (65,000 MT), and the Ukraine (32,400
MT).
Late
Reporting:
For 2020/2021, net sales totaling 66,000 MT were reported late for South Korea.
Barley:
For 2020/2021, net sales reductions of 4,700 MT resulting in increases primarily for South Korea (1,000 MT), were offset set by reductions for Japan (5,700 MT). For 2021/2022, total net sales of 5,700 MT were for Japan. Export of 700 MT were primarily to
Japan (300 MT) and Canada (300 MT).
Sorghum:
For 2020/2021, net sales of 60,800 MT were primarily for China (60,500 MT).
Exports of 71,000 MT were down 80 percent from the previous week and 53 percent from the prior 4-week average. The destination was primarily to China.
Rice:
Net sales of 53,700 MT for 2020/2021 were down 52 percent from the previous week and 32 percent from the prior 4-week average. Increases were primarily for Mexico (30,300 MT, including decreases of 200 MT), Japan (12,000 MT), Saudi Arabia (4,300 MT), Canada
(2,000 MT), and Guatemala (2,000 MT). Exports of 21,900 MT were down 76 percent from the previous week and 74 percent from the prior 4-week average. The destinations were primarily to Mexico (10,500 MT), Canada (3,600 MT), Saudi Arabia (2,000 MT), Taiwan
(900 MT), and Belgium (900 MT).
Soybeans:
Net sales of 101,800 MT for 2020/2021 were down 50 percent from the previous week and 56 percent from the prior 4-week average. Increases primarily for Egypt (109,700 MT, including 55,000 MT switched
from unknown destinations and decreases of 4,600 MT), Indonesia (63,100 MT, including 55,000 MT switched from unknown destinations and decreases of 100 MT), Mexico (50,600 MT, including 47,500 MT switched from unknown destinations and decreases of 1,000 MT),
Japan (9,600 MT), and Malaysia (4,800 MT, including decreases of 200 MT), were offset by reductions primarily for unknown destinations (152,500 MT). For
2021/2022, total net sales of 65,000 MT were reported for unknown destinations. Exports of 501,400 MT were down 6 percent from the previous week and 40 percent from the prior 4-week average. The
destinations were primarily to Egypt (164,700 MT), Mexico (145,100 MT), Indonesia (79,600 MT), Japan (35,200 MT), and Taiwan (28,600 MT).
Exports
for Own Account:
The current exports for own account outstanding balance is 5,800 MT, all Canada.
Soybean
Cake and Meal:
Net sales of 167,800 MT for 2020/2021 were down 29 percent from the previous week and 20 percent from the prior 4-week average. Increases primarily for Mexico (60,800 MT), Ecuador (45,000 MT), Colombia
(17,600 MT, including 10,000 MT switched from unknown destinations and 4,100 MT switched from Panama), Guatemala (12,900 MT, including 4,900 MT switched from Honduras, 4,500 MT switched from Costa Rica, and decreases of 100 MT), and Canada (11,500 MT, including
decreases of 200 MT), were offset by reductions primarily for Honduras (10,000 MT) and unknown destinations (10,000 MT). For
2021/2022, net sales of 17,200 MT were reported for Mexico (16,900 MT) and Canada (300 MT). Exports of 281,600 MT were up 14 percent from the previous week and 7 percent from the prior 4-week average.
The destinations were primarily to the Philippines (99,300 MT), Mexico (59,800 MT), Colombia (37,100 MT), Canada (26,900 MT), and the Dominican Republic (13,100 MT).
Soybean
Oil:
Net sales of 13,200 MT for 2020/2021 were down 31 percent from the previous week, but up 56 percent from the prior 4-week average. Increases were primarily for Venezuela (5,000 MT), the Dominican
Republic (4,000 MT), Guatemala (2,700 MT), Canada (900 MT), and Mexico (500 MT). Exports of 12,100 MT were up 53 percent from the previous week, but down 58 percent from the prior 4-week average. The destinations were primarily to Guatemala (7,000 MT), Jamaica
(3,500 MT), Mexico (800 MT), and Canada (600 MT).
Cotton:
Net sales of 271,200 RB for 2020/2021 were down 38 percent from the previous week, but up 2 percent from the prior 4-week average. Increases primarily for Vietnam (135,500 RB, including 2,200 RB switched from China, 1,100 RB switched from Japan, and 1,100
RB switched from South Korea), Turkey (77,000 RB, including decreases of 200 RB), Pakistan (22,200 RB, including 2,900 RB switched from the United Arab Emirates), Peru (14,900 RB), and Bangladesh (7,100 RB), were offset by reductions primarily for the United
Arab Emirates (2,900 RB) and China (1,800 RB). For 2021/2022, net sales of 69,400 RB were primarily for China (41,400 RB), Pakistan (8,800 RB), South Korea (7,900 RB), Honduras (3,100 RB), and Turkey (2,600 RB). Exports of 313,500 RB were down 11 percent
from the previous week and 9 percent from the prior 4-week average. Exports were primarily to China (62,300 RB), Pakistan (51,400 RB), Bangladesh (42,200 RB), Vietnam (40,800 RB), and Turkey (36,700 RB). Net sales of Pima totaling 7,000 RB were unchanged
from the previous week, but down 29 percent from the prior 4-week average. Increases were primarily for India (3,100 RB), Austria (1,300 RB), Honduras (1,300 RB), Bangladesh (700 RB), and Pakistan (400 RB). Exports of 9,300 RB were down 10 percent from the
previous week and 33 percent from the prior 4-week average. The destinations were primarily to India (2,900 RB), China (1,800 RB), Pakistan (1,000 RB), Thailand (900 RB), and Peru (900 RB).
Exports
for Own Account:
For 2020/2021, new exports for own account totaling 1,100 RB were to Vietnam. Exports for own account totaling 3,600 RB to China (2,100 RB) and Vietnam (1,500 RB) were applied to new or outstanding sales. The current exports for own account outstanding balance
of 34,400 RB are for China (25,200 RB), Vietnam (8,800 RB), and Bangladesh (400 RB).
Hides
and Skins:
Net sales of 560,000 pieces for 2021 were unchanged from the previous week and up 36 percent from the prior 4-week average. Increases were primarily for China (418,600 whole cattle hides, including decreases of 23,000 pieces), South Korea (62,000 whole cattle
hides, including decreases of 1,500 pieces), Indonesia (29,200 whole cattle hides, including decreases of 400 pieces), Mexico (21,000 whole cattle hides, including decreases of 500 pieces), and Thailand (15,300 whole cattle hides, including decreases of 300
pieces). In
addition, total net sales reductions of 800 kip skins were for Belgium.
Exports of 378,700 pieces for 2021 were up 4 percent from the previous week and from the prior 4-week average. Whole cattle hides exports were primarily to China (250,300 pieces), South Korea (52,300 pieces), Mexico (32,500 pieces), Thailand (18,900 pieces),
and Taiwan (12,600 pieces).
Net
sales of 220,600 wet blues for 2021 were up noticeably from the previous week and from the prior 4-week average. Increases were primarily for China (68,700 unsplit, including decreases of 400 unsplit), Vietnam (53,600 unsplit), Thailand (45,700 unsplit, including
decreases of 300 unsplit), Italy (28,900 unsplit, including decreases of 100 unsplit), and the Dominican Republic (9,600 unsplit). Exports of 100,500 wet blues for 2021 were up 1 percent from the previous week and 8 percent from the prior 4-week average.
The destinations were primarily to China (31,000 unsplit), Italy (19,800 unsplit), Vietnam (17,700 unsplit), Mexico (12,500 grain splits and 3,400 unsplit), and Thailand (8,200 unsplit). Net sales of 202,300 splits resulting in increases for Taiwan (128,200
pounds, including decreases of 1,600 pounds), Vietnam (40,700 pounds, including decreases of 4,000 pounds), and Italy (34,200 pounds, including decreases of 11,200 pounds), were offset by reductions for China (800 pounds). Exports of 408,200 pounds were to
Vietnam (237,600 pounds), Italy (86,700 pounds), China (42,200 pounds), and Taiwan (41,700 pounds).
Beef:
Net
sales of 18,900 MT reported for 2021 were down 27 percent from the previous week and 3 percent from the prior 4-week average. Increases were primarily for Japan (5,800 MT, including decreases of 600 MT), South Korea (4,400 MT, including decreases of 500 MT),
China (3,600 MT, including decreases of 100 MT), Taiwan (1,600 MT, including decreases of 200 MT), and Chile (800 MT). Exports of 18,500 MT were up 4 percent from the previous week and 5 percent from the prior 4-week average. The destinations were primarily
to Japan (5,700 MT), South Korea (4,400 MT), China (3,200 MT), Taiwan (1,300 MT), and Mexico (1,300 MT).
Pork:
Net
sales of 38,700 MT reported for 2021 were down 3 percent from the previous week and 2 percent from the prior 4-week average.
Increases primarily for Mexico (17,300 MT, including decreases of 400 MT), China (10,500 MT, including decreases of 1,000 MT), Japan (3,000 MT, including decreases of 400 MT), Canada (2,700 MT, including decreases of 300 MT), and South Korea (2,200 MT, including
decreases of 1,300 MT), were offset by reductions primarily for Australia (100 MT). Exports of 38,500 MT were down 5 percent from the previous week and 1 percent from the prior 4-week average. The destinations were primarily to China (12,000 MT), Mexico
(9,600 MT), Japan (4,800 MT), the Philippines (2,300 MT), and South Korea (2,300 MT).
March
25, 2021 1 FOREIGN AGRICULTURAL SERVICE/USDA
U.S. EXPORT SALES FOR WEEK ENDING 3/18/2021
|
|
CURRENT MARKETING YEAR |
NEXT MARKETING YEAR |
||||||
|
COMMODITY |
NET SALES |
OUTSTANDING SALES |
WEEKLY EXPORTS |
ACCUMULATED EXPORTS |
NET SALES |
OUTSTANDING SALES |
||
|
CURRENT YEAR |
YEAR |
CURRENT YEAR |
YEAR |
|||||
|
|
THOUSAND METRIC TONS |
|||||||
|
WHEAT |
|
|
|
|
|
|
|
|
|
HRW |
90.6 |
1,398.7 |
1,928.3 |
120.1 |
7,017.1 |
7,321.9 |
0.0 |
283.5 |
|
SRW |
28.8 |
354.6 |
289.5 |
62.1 |
1,439.8 |
2,044.2 |
10.5 |
313.3 |
|
HRS |
113.6 |
1,648.2 |
1,640.4 |
230.8 |
5,767.7 |
5,632.2 |
34.0 |
310.0 |
|
WHITE |
111.9 |
1,956.5 |
1,119.7 |
172.2 |
4,600.9 |
3,821.1 |
26.0 |
183.3 |
|
DURUM |
-1.3 |
78.3 |
230.4 |
73.7 |
592.1 |
682.2 |
0.0 |
5.0 |
|
TOTAL |
343.6 |
5,436.3 |
5,208.3 |
658.8 |
19,417.6 |
19,501.7 |
70.5 |
1,095.1 |
|
BARLEY |
-4.7 |
6.1 |
11.3 |
0.7 |
22.7 |
37.8 |
5.7 |
20.2 |
|
CORN |
4,481.9 |
32,988.6 |
13,783.9 |
2,036.0 |
31,998.1 |
17,048.1 |
144.6 |
1,939.5 |
|
SORGHUM |
60.8 |
2,748.1 |
1,286.6 |
71.0 |
3,518.4 |
1,186.0 |
0.0 |
756.0 |
|
SOYBEANS |
101.8 |
6,380.1 |
4,612.9 |
501.4 |
54,355.8 |
31,138.8 |
65.0 |
5,141.2 |
|
SOY MEAL |
167.8 |
2,594.5 |
3,051.2 |
281.6 |
6,202.2 |
5,610.5 |
17.2 |
250.3 |
|
SOY OIL |
13.2 |
114.0 |
278.9 |
12.1 |
521.1 |
553.1 |
0.0 |
0.6 |
|
RICE |
|
|
|
|
|
|
|
|
|
L G RGH |
32.0 |
330.5 |
346.8 |
10.0 |
1,053.2 |
935.2 |
0.0 |
0.0 |
|
M S RGH |
0.0 |
5.3 |
43.3 |
0.0 |
23.5 |
24.5 |
0.0 |
0.0 |
|
L G BRN |
0.3 |
4.0 |
20.9 |
0.3 |
33.4 |
36.3 |
0.0 |
0.0 |
|
M&S BR |
0.7 |
69.6 |
63.7 |
1.4 |
83.8 |
44.3 |
0.0 |
0.0 |
|
L G MLD |
5.5 |
58.3 |
93.4 |
4.8 |
440.9 |
644.9 |
0.0 |
0.0 |
|
M S MLD |
15.2 |
243.7 |
225.5 |
5.5 |
360.4 |
398.2 |
0.0 |
0.0 |
|
TOTAL |
53.7 |
711.4 |
793.6 |
21.9 |
1,995.4 |
2,083.4 |
0.0 |
0.0 |
|
COTTON |
|
THOUSAND RUNNING BALES |
||||||
|
UPLAND |
271.2 |
5,351.8 |
6,918.4 |
313.5 |
9,146.8 |
8,226.5 |
69.4 |
1,501.6 |
|
PIMA |
7.0 |
257.5 |
235.1 |
9.3 |
477.4 |
304.4 |
0.0 |
1.1 |
Terry Reilly
Senior Commodity Analyst – Grain and Oilseeds
Futures International
One Lincoln Center
18 W 140 Butterfield Rd.
Oakbrook Terrace, Il. 60181
W: 312.604.1366
ICE IM:
treilly1
Skype: fi.treilly

Trading of futures, options, swaps and other derivatives is risky and is not suitable for all persons. All of these investment products are leveraged, and you can lose more than your initial deposit. Each investment product is offered
only to and from jurisdictions where solicitation and sale are lawful, and in accordance with applicable laws and regulations in such jurisdiction. The information provided here should not be relied upon as a substitute for independent research before making
your investment decisions. Futures International, LLC is merely providing this information for your general information and the information does not take into account any particular individual’s investment objectives, financial situation, or needs. All investors
should obtain advice based on their unique situation before making any investment decision. The contents of this communication and any attachments are for informational purposes only and under no circumstances should they be construed as an offer to buy or
sell, or a solicitation to buy or sell any future, option, swap or other derivative. The sources for the information and any opinions in this communication are believed to be reliable, but Futures International, LLC does not warrant or guarantee the accuracy
of such information or opinions. Futures International, LLC and its principals and employees may take positions different from any positions described in this communication. Past results are not necessarily indicative of future results.