PDF Attached includes updated US soybean complex S&D’s. We lowered the SBO for biodiesel outlook for 2021-22 given the amount of renewable diesel coming online. No other major changes in this update but
we did pass a monthly forecast for SBO and SBM for 2021-22. Feedback welcome. Have a good evening.
Wild
trade in agriculture and outside markets today. US economic news, OPEC+ coupled with Powell comments and interest rate rally kept all types of traders on their toes.
MARKET
WEATHER MENTALITY FOR CORN AND SOYBEANS:
Dryness
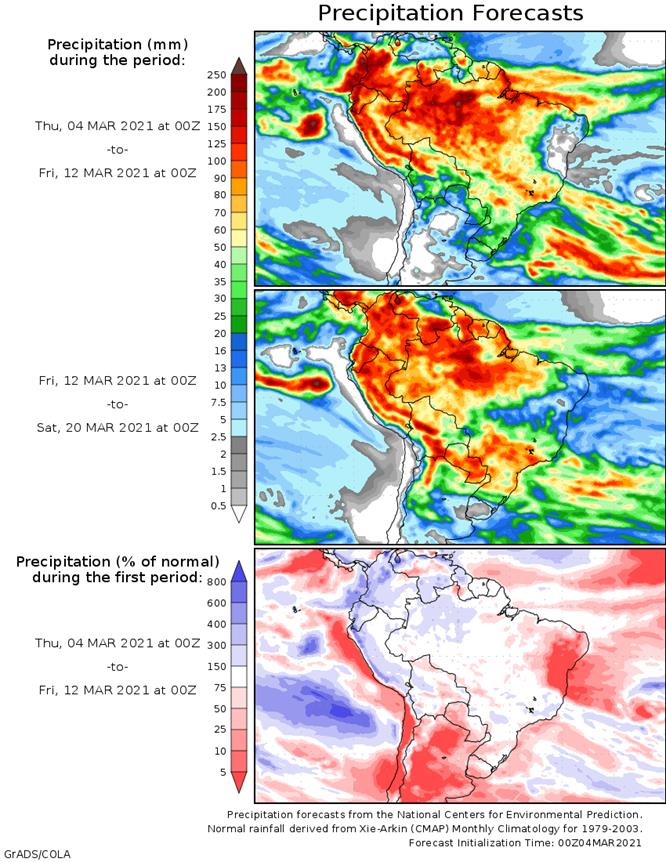
worry in Argentina and continued rain to center west Brazil will maintain concern over soybean harvesting and corn planting, although there will be a few more breaks in the pattern over this next ten days. Argentina is firming up and limited rainfall and warm
temperatures for the next week will deplete soil moisture and bring on greater crop stress as some plants continue in the late reproductive and filling stages of development. Brazil’s southern crop areas will see less rain this weekend into early next week
to improve field working conditions, but recent rain was good for Safrinha crops.
Weather
elsewhere in the world is of little concern. Australia’s summer crop areas will dry down stressing some unirrigated production areas. India will continue to dry down as well threatening some of the drier winter crop areas with a little yield decline. Europe
winter oilseed production areas are still mostly in favorable condition with warming needed to bring rapeseed out of dormancy. South Africa summer crops are still poised to produce very well.
Early
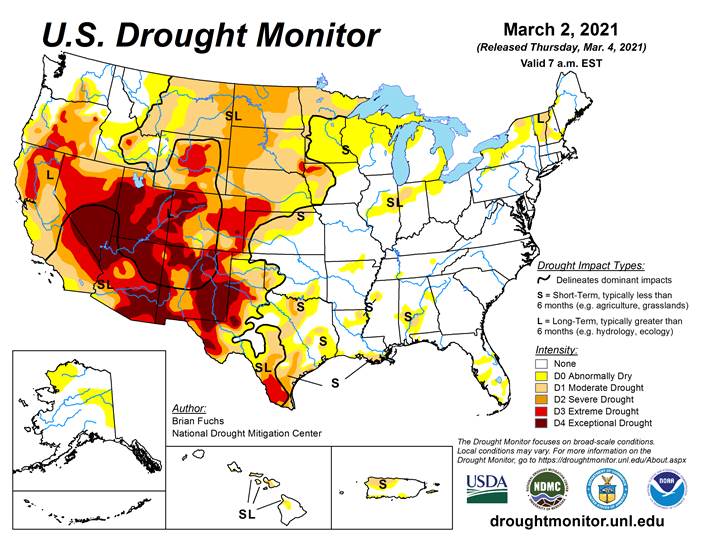
season planting delays may continue for a little while in the southern U.S., but improving weather is expected later this month.
Overall, weather today will likely produce a mixed environment for market trade with the soybean harvest beginning to pressure some of the trade activity. The market will soon be flooded with soybeans reducing concern over short supply for a while.
MARKET
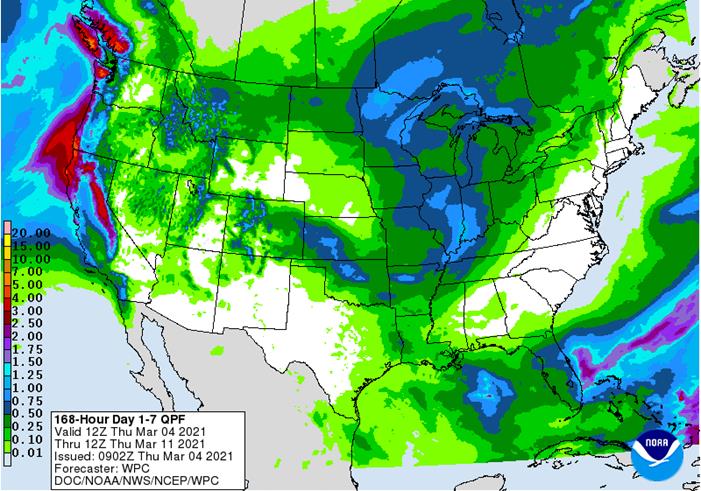
WEATHER MENTALITY FOR WHEAT: Rain prospects in the central and northern U.S. Plains during the coming week will offer “some” improvement to field conditions and to winter wheat development potential, but more rain will be needed.
There
is no threatening cold advertised for any of the Northern Hemisphere crop production areas and seasonal warming will continue to raise soil temperatures in many areas which will slowly bring crops out of dormancy.
North
Africa rainfall for this week will bring better production potential to the region’s wheat and barley, although more moisture will still be needed.
China
winter crops remain in good condition while those in India are still not experiencing the best weather for the best yields.
Overall,
weather today may have a neutral to bearish on market trade decisions.
Source:
World Weather Inc. and FI
Bloomberg
Ag Calendar
Thursday,
March 4:
- FAO
World Food Price Index, grains supply and demand reports - USDA
weekly crop net‐export sales for corn, soybeans, wheat, cotton, pork, beef, 8:30am - Port
of Rouen data on French grain exports - U.S.
National Coffee Association hosts annual convention (virtual), March 4‐5
Friday,
March 5:
- ICE
Futures Europe weekly commitments of traders report (6:30pm London) - CFTC
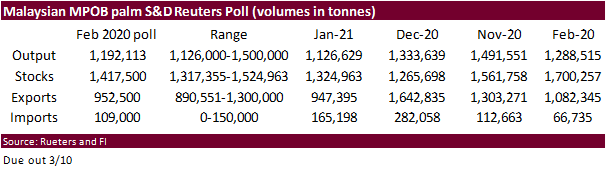
commitments of traders weekly report on positions for various U.S. futures and options, 3:30pm - Malaysia’s
March 1‐5 palm oil export data - FranceAgriMer
weekly update on crop conditions - China’s
CNGOIC to publish supply and demand reports on commodities such as corn and soybeans
USDA
export sales
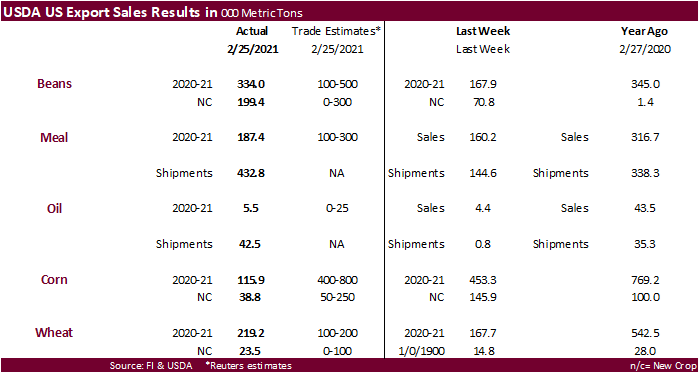
Corn
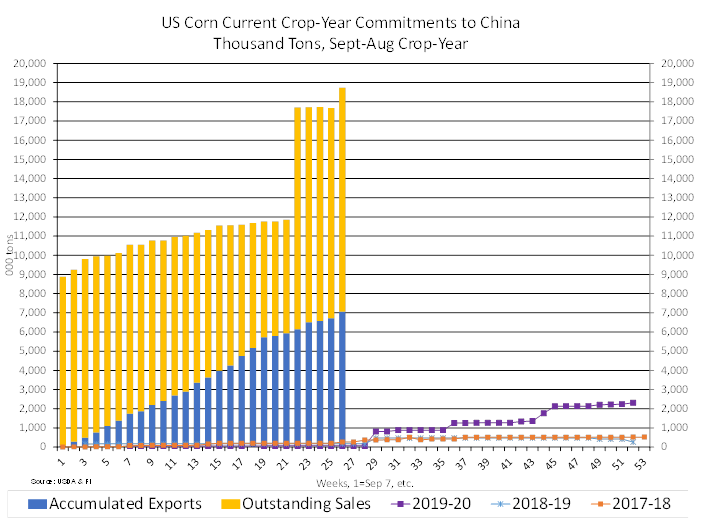
export sales fell well short of expectations for old and new crop. USDA noted for corn “Increases primarily for China (1,054,700 MT, including 1,046,000 MT switched from unknown destinations and decreases of 3,000 MT), Mexico (181,900 MT, including decreases
of 1,100 MT), Saudi Arabia (129,300 MT, including 112,900 MT switched from unknown destinations), Japan (108,600 MT, including 118,800 MT switched from unknown destinations and decreases of 68,600 MT), and South Korea (107,800 MT, including 68,000 MT switched
from unknown destinations and decreases of 15,400 MT), were offset by reductions primarily for unknown destinations (1,764,900 MT).” Soybean export sales were within expectations with Mexico and Germany taking the bulk of 2020-21. Meal sales of 187,400 tons
(Philippines 49,000 tons) were ok but shipments were very excellent at 432,800 tons. Soybean oil sales were poor at 5,500 tons but shipments were good at 42,500 tons. All-wheat export sales were above expectations for this crop-year but at 219,200 tons,
they are still viewed as low. Sorghum posted a net reduction of 52,200 tons (all China). Pork sales were excellent at 59,600 tons (China 28,000). Mixed reaction seen for futures post report with emphasis on corn selling.
The
US Senate will review the $1.9 trillion USD Covid-19 aid bill this week.
Canadian
Labor Productivity (Q/Q) Q4: -2.0% (est -1.9%; prev -10.3%)
US
Initial Jobless Claims Feb 27: 745K (est 750K; prevR 736K; prev 730K)
US
Continuing Claims Feb 20: 4295K (est 4300K; prev 4419K)
US
EIA Natural Gas Storage Change (BCF) 26-Feb: -98 (est -140; prev -338)
–
Salt Dome Cavern Natural Gas Storage Change (BCF): +9 (prev -83)
Saudis
Considering Extending Voluntary Oil Cut Of 1M Bpd By One Month Into April – RTRS Cites OPEC+
Corn
- Corn
futures traded two sided. Corn was higher during the morning session, but the front month contracts fell from a higher USD and sharply lower equities (at the time CBOT corn closed). Futures were higher this morning from sharply higher WTI crude oil (OPEC+
and unrest in the Middle East) but gains were trimmed on a higher USD (+62 points by 1:45 pm CT), higher interest rates and poor USDA export sales. The May corn contract fell to its lowest level since February 11. WTI crude oil prices surged after OPEC+
agreed to keep oil production unchanged in April but ended well off contract highs. The April WTI contract rallied $2.65 to $63.94 by 1:45 pm CT.
- US
equities were sharply lower after Powell pledged to keep credit loose and flowing until Americans are back to work, while mentioning the markets look “impatient.” The 10-year Treasury interest rate traded back above 1.5%.
- US
corn export sales fell well short of expectations for old and new crop. USDA noted several switches, that included China (1,054,700 MT, including 1,046,000 MT switched from unknown destinations and decreases of 3,000 MT). Sorghum posted a net reduction
of 52,200 tons (all China). Pork sales were excellent at 59,600 tons (China 28,000). Mixed reaction seen for futures post report with emphasis on corn selling.
Export
developments.
- Algeria
seeks 30,000 tons of corn, optional origin, on March 4, for shipment by April 15. - South
Korea’s MFG bought 68,000 tons of corn likely from South America or South Africa at an estimated $285.79 a ton c&f for arrival around July 30 in South Korea.
Updated
3/1/21
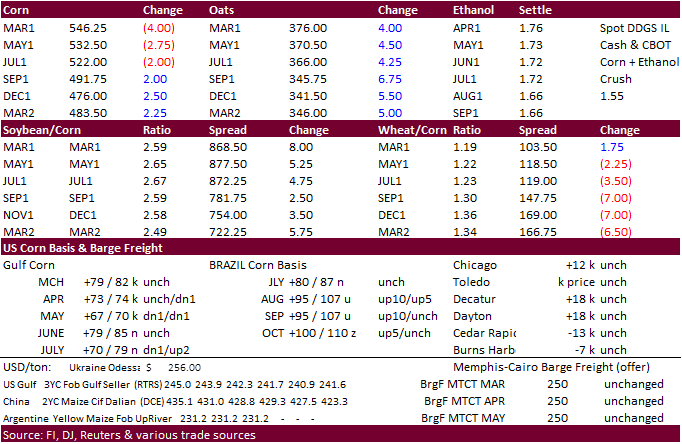
May
corn is seen in a $5.20 and $5.75 range.
July
is seen in a $5.00 and $6.00 range.
December
corn is seen in a $3.85-$5.50 range.
- Soybeans
and meal traded two sided, ending lower for soybean meal, higher for soybeans (late rally), and soybean oil held gains (up 83-98 points) from concerns over thin global vegetable oil supplies and a higher lead in outside related vegetable oil markets. Outside
commodity, rates, and equity markets were very volatile today. Palm oil rallied 53 MRY and cash palm was up $12.50. Soybean oil in China appreciated 1.4 percent.
- Rain
fell today across the central and northwest areas of Brazil while Argentina will see net drying in most areas. Light rain will occur later today across north Santa Fe, north Entre Rios, south Buenos Aires.
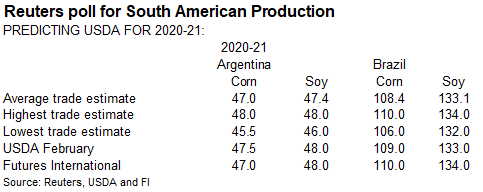
- The
Buenos Aires Grains Exchange said they may lower the Argentina soybean crop, currently estimated at 46 million tons if rains fail to materialize over the next few weeks. They went onto say the corn yields are also threatened.
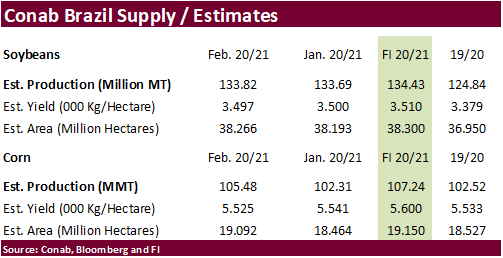
- A
Reuters trade guess for the Argentina soybean production is at 47.4 million tons, down from 47.5 million tons from Feb. Brazil soybeans are estimated at 133.1 million tons, up from 133 in Feb.
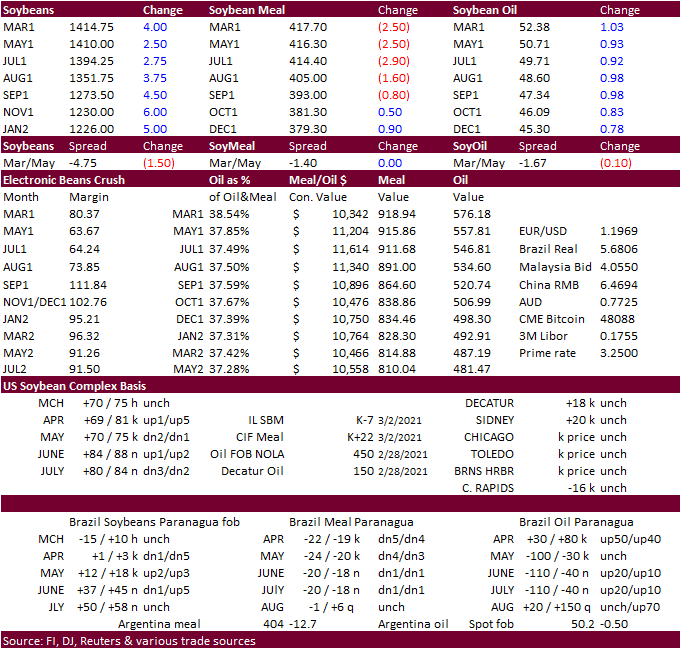
- China
cash crush margins on our analysis continue to weaken. At 91 cents, they are down from 112 cents late last week.
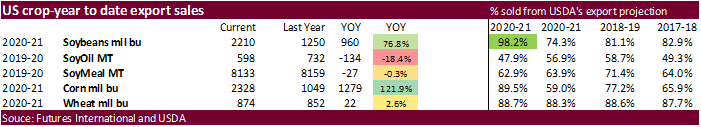
- Soybean
export sales were within expectations with Mexico and Germany taking the bulk of 2020-21. Meal sales of 187,400 tons (Philippines 49,000 tons) were ok but shipments were very excellent at 432,800 tons. Soybean oil sales were poor at 5,500 tons but shipments
were good at 42,500 tons. All-wheat export sales were above expectations for this crop-year but at 219,200 tons, they are still viewed as low. Little over 98 percent of USDA’s soybean export projection had been sold, but we have a way to go on shipments.
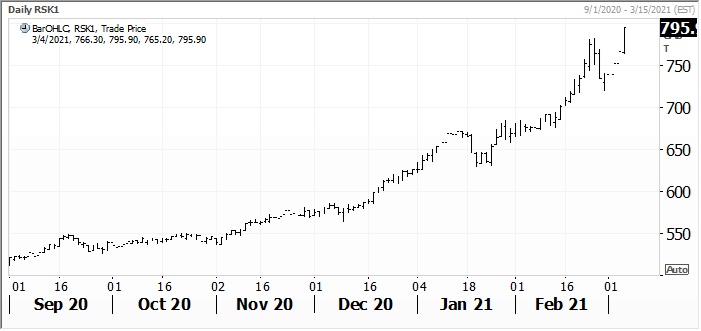
- ICE
canola was up 17.90 in the May position to 783.80 and made a new contract high today. It is up 5 straight sessions and does not seem it will slow down. Note March got as high as 852.10. This is good to keep in mind since the landscape of tight Canadian
canola stocks has not changed. Benchmark European rapeseed hit a record contract high. We look for the EU to increase imports of oilseeds over the next several months.
- A
Reuters article noted Cargill plans to expand their soybean processing capacity at two large Midwest crush plants and increasing efficiency at five others. They will spend about $475 million for the upgrades over a 5-year period. The Cedar Rapids plant will
increase 10 percent and Sydney, Ohio, by 100 percent. Efficiency increases will include processing centers for Guntersville, Alabama; Gainesville, Georgia; Wichita, Kansas; Kansas City, Missouri; and Fayetteville, North Carolina.
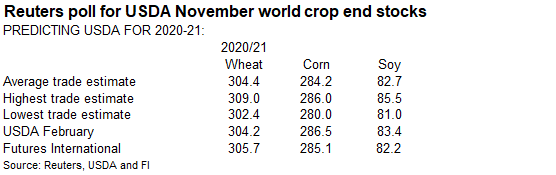
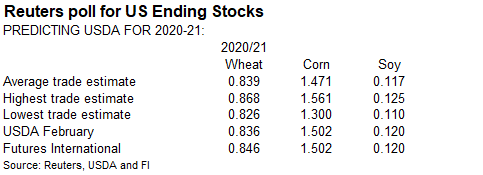
- On
March 9th USDA will release updates to their S&D’s. We do not look for changes in the US soybean and corn ending stocks unlike many other analysts that see both ending stocks tightening. Slowing US exports for soybeans and corn during the month
of February and slowdown in US soybean processing & ethanol production from the extremely cold weather snap may hinder USDA’s decision to raise domestic demand. A Reuters trade guess for the US 2020-21 soybean carryout is 117 million bushels, 3 below USDA
February. The average trade guess for corn is 1.470 billion bushels, below 1.502 billion projected in February. Traders are likely looking for USDA to increase corn exports. Looking back at USDA export sales data, February sales have averaged about 750,000
tons so far while January sales averaged about 1.5 million tons per week, excluding the 7.4 million ton week late January.
- We
passed a forecast for the US soybean meal balance sheet today for the upcoming 2021-22 crop-year, annual and by month. We think US soybean meal stocks will top out in February 2022, then gradually decline through the remainder of the production crop year.
Our product crush is 2.211 billion bushels, not far off USDA’s 2.210 billion Feb outlook projection. We also think soybean oil stocks will peak in February 2022. Attached are also the US SBO and soybean balances.
- Marathon
Petroleum said they are repositioning the Martinez refinery to become “Martinez Renewable Fuels, a renewable fuels manufacturing and terminal facility that will be able to produce approximately 730 million gallons of renewable fuels per year.” This plant
among others will eventually erode SBO for biodiesel use in quarters were BO to make biodiesel deemed unprofitable.
Export
Developments
- Egypt’s
GASC bought 60,000 tons of soybean oil and passed on sunflower oil. Two 30,000 ton purchases were bought at $1,180 a ton c&f for May 1-15 arrival in Egypt. The lowest offer for 10,000 tons of sunflower oil was at $1,554 a ton c&f. In another import tender,
GASC bought 18,000 tons of local soybean oil at $17,925 Egyptian pounds a ton ($1,143 a ton).
May
ICE Canola hit a contract high today
Source:
Reuters and FI
Updated
3/4/21
May
soybeans are seen in a $13.50 and $15.00 range.
May
soymeal is seen in a $400 and $460 range.
May
soybean oil is seen in a 49.00 and 54.00 cent range. (raised 200 points both ends)
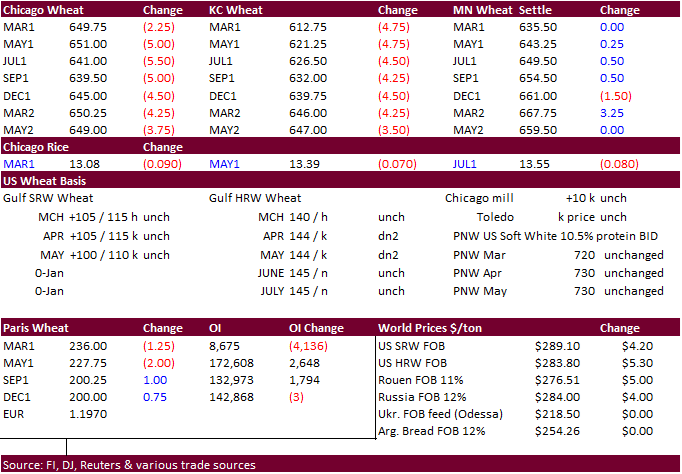
- Wheat
futures started
mostly lower on a higher USD and poor USDA export sales. Chicago and KC ended lower. The USD was up 61 points as of 1:30 pm CT.
MN
ended higher on good global demand for high protein wheat. Algeria bought a large amount of durum wheat. US wheat exports improved this week with Taiwan picking up various class wheat. But last week was different story. All-wheat export sales were above
expectations for this crop-year but at 219,200 tons, they are still viewed as low. The US markets sold off as a result.
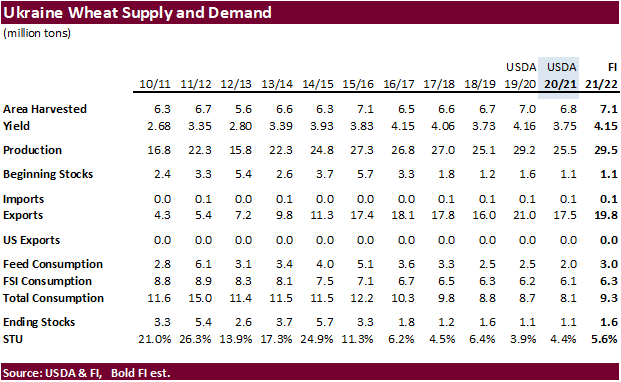
- Ukraine
winter grain crops were thought to be in in excellent condition due to favorable weather. 2021 production could end up at a record 75 million tons according to the government, including 29-30 million tons of wheat and at least 34 million tons of corn.
- Russian
grain conditions improved over the winter due to mild weather after a very poor start to plantings last fall. Only 7-9 percent of the crop was rated poor.
- EU
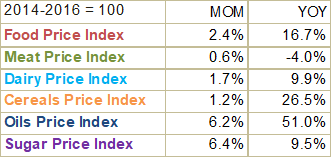
May milling wheat was down 2.00 at 227.75 euros. - The
FAO World Food Price Index averaged 116.0 points last month versus 113.2 in January.
Export
Developments.
- Algeria
bought between 180,000 and 240,000 tons durum wheat for shipment between April 1-15 and April 16-30, between $372 and $373 a ton &f. Origins were thought to include Canada, the United States and Mexico. - Taiwan
bought 100,410 tons of US wheat for April 25-May 9 shipment, and May 12-May 26 shipment (2 consignments).
- 26,370
tons of U.S. dark northern spring wheat of 14.5% protein content was bought at $290.64 a ton FOB. 16,025 tons of hard red winter wheat of 12.5% protein bought at $285.22 a ton FOB.
- 7,270
tons of soft white wheat of 9% protein bought at $287.79 a ton FOB. - 27,825
tons of dark northern spring wheat of 14.5% protein content bought at $292.11 a ton FOB.
- 15,725
tons of hard red winter wheat of 12.5% protein content bought at $284.12 a ton FOB.
- 7,195
tons of soft white wheat of 9% protein bought at $285.96 a ton FOB. - Saudi
Arabia seeks 540,000 tons of barley on Friday, valid until Monday, for April – May shipment.
- Results
awaited: The Philippines seeks 145,000 tons of milling wheat on March 4 for April and June shipment.
- Results
awaited: Iran’s SLAL seeks up to 400,000 tons of animal feed barley on Wednesday, March 3, for shipment between March 10 and April 10.
Rice/Other
·
South Korea’s Agro-Fisheries & Food Trade Corp. seeks 38,889 tons of rice from the United States and China, part arrival in South Korea around Sept. 30 from the US. Another 16,667 tons of non-glutinous
short grain brown rice from China is sought for arrival around June 30.
·
Syria seeks 25,000 tons of white rice on March 29, from China or Egypt.
Updated
3/4/21
May
Chicago wheat is seen in a $6.25‐$6.90 range.
May
KC wheat is seen in a $5.50‐$6.75 range.
May
MN wheat is seen in a $6.20‐$6.65 range.
U.S. EXPORT SALES FOR WEEK ENDING 2/25/2021
|
|
CURRENT MARKETING YEAR |
NEXT MARKETING YEAR |
||||||
|
COMMODITY |
NET SALES |
OUTSTANDING SALES |
WEEKLY EXPORTS |
ACCUMULATED EXPORTS |
NET SALES |
OUTSTANDING SALES |
||
|
CURRENT YEAR |
YEAR |
CURRENT YEAR |
YEAR |
|||||
|
|
THOUSAND METRIC TONS |
|||||||
|
WHEAT |
|
|
|
|
|
|
|
|
|
HRW |
87.4 |
1,335.1 |
1,775.6 |
136.6 |
6,671.9 |
6,828.0 |
0.0 |
252.0 |
|
SRW |
9.4 |
404.6 |
356.7 |
52.5 |
1,329.8 |
1,937.5 |
0.0 |
284.6 |
|
HRS |
68.4 |
1,984.0 |
1,574.6 |
105.8 |
5,108.3 |
5,230.1 |
23.5 |
232.7 |
|
WHITE |
44.0 |
2,285.1 |
1,057.1 |
112.7 |
3,999.9 |
3,591.4 |
0.0 |
80.3 |
|
DURUM |
10.0 |
154.2 |
148.4 |
0.0 |
517.9 |
679.8 |
0.0 |
5.0 |
|
TOTAL |
219.2 |
6,163.0 |
4,912.4 |
407.5 |
17,627.7 |
18,266.9 |
23.5 |
854.6 |
|
BARLEY |
0.0 |
10.6 |
14.9 |
0.4 |
21.7 |
34.3 |
0.0 |
14.5 |
|
CORN |
115.9 |
32,953.6 |
12,261.9 |
2,010.2 |
26,169.9 |
14,380.2 |
38.8 |
1,266.8 |
|
SORGHUM |
-52.2 |
2,843.3 |
668.9 |
72.4 |
3,035.0 |
1,069.9 |
0.0 |
703.0 |
|
SOYBEANS |
334.0 |
7,465.8 |
4,432.3 |
1,160.8 |
52,683.4 |
29,589.0 |
199.4 |
4,863.0 |
|
SOY MEAL |
187.4 |
2,683.4 |
3,421.7 |
432.8 |
5,449.1 |
4,737.5 |
0.0 |
215.1 |
|
SOY OIL |
5.5 |
159.7 |
246.4 |
42.5 |
438.3 |
486.2 |
0.0 |
0.6 |
|
RICE |
|
|
|
|
|
|
|
|
|
L G RGH |
76.6 |
275.6 |
393.7 |
54.4 |
982.4 |
863.9 |
0.0 |
0.0 |
|
M S RGH |
0.0 |
9.9 |
42.8 |
1.5 |
19.0 |
17.5 |
0.0 |
0.0 |
|
L G BRN |
0.1 |
12.9 |
14.2 |
0.1 |
24.0 |
33.7 |
0.0 |
0.0 |
|
M&S BR |
0.7 |
70.7 |
71.7 |
27.2 |
81.7 |
35.8 |
0.0 |
0.0 |
|
L G MLD |
7.3 |
73.7 |
91.7 |
37.5 |
396.8 |
600.5 |
0.0 |
0.0 |
|
M S MLD |
7.7 |
235.0 |
170.7 |
23.3 |
330.1 |
377.2 |
0.0 |
0.0 |
|
TOTAL |
92.3 |
677.8 |
784.8 |
144.0 |
1,834.0 |
1,928.5 |
0.0 |
0.0 |
|
COTTON |
|
THOUSAND RUNNING BALES |
||||||
|
UPLAND |
169.0 |
5,447.9 |
6,997.4 |
377.4 |
8,129.8 |
7,045.5 |
40.6 |
1,196.7 |
|
PIMA |
7.8 |
274.4 |
230.3 |
9.1 |
434.1 |
256.5 |
0.0 |
1.1 |
This
summary is based on reports from exporters for the period February 19-25, 2021.
Wheat: Net
sales of 219,200 metric tons (MT) for 2020/2021 were up 31 percent from the previous week, but down 51 percent from the prior 4-week average. Increases primarily for Mexico (69,300 MT, including decreases of 1,400 MT), China (65,900 MT, including 65,000 MT
switched from unknown destinations and decreases of 100 MT), Nigeria (56,000 MT, including decreases of 1,000 MT), Canada (31,600 MT), and Japan (30,600 MT, including decreases of 200 MT), were offset by reductions primarily for unknown destinations (55,000
MT) and Chile (8,000 MT). For 2021/2022, total net sales of 23,500 MT were for Haiti. Exports of 407,500 MT were up 4 percent from the previous week, but down 5 percent from the prior 4-week average. The destinations were primarily to Mexico (147,800 MT),
Indonesia (74,500 MT), Thailand (57,900 MT), Honduras (36,800 MT), and Nigeria (29,000 MT).
Optional
Origin Sales:
For 2020/2021, the current outstanding balance of 10,000 MT, all Spain.
Corn:
Net sales of 115,900 MT for 2020/2021–a marketing-year low–were down 74 percent from the previous week and 96 percent from the prior 4-week average. Increases primarily for China (1,054,700 MT, including 1,046,000 MT switched from unknown destinations and
decreases of 3,000 MT), Mexico (181,900 MT, including decreases of 1,100 MT), Saudi Arabia (129,300 MT, including 112,900 MT switched from unknown destinations), Japan (108,600 MT, including 118,800 MT switched from unknown destinations and decreases of 68,600
MT), and South Korea (107,800 MT, including 68,000 MT switched from unknown destinations and decreases of 15,400 MT), were offset by reductions primarily for unknown destinations (1,764,900 MT). For 2021/2022, net sales of 38,800 MT were reported for Mexico
(26,800 MT) and Japan (12,000 MT). Exports of 2,010,200 MT–a marketing-year high–were up 69 percent from the previous week and 57 percent from the prior 4-week average. The destinations were primarily to Japan (351,600 MT), China (346,700 MT), Mexico (261,100
MT), South Korea (173,700 MT), and Saudi Arabia (129,300 MT).
Optional
Origin Sales:
For 2020/2021, decreases totaling 105,000 MT were reported for South Korea (55,000 MT) and unknown destinations (50,000 MT). The current outstanding balance of 1,174,400 MT is for South Korea (793,000 MT), unknown destinations (244,000 MT), Taiwan (70,000
MT), China (65,000 MT), and Ukraine (2,400 MT).
Barley:
No net sales were reported for the week. Exports of 400 MT were to Japan (300 MT) and Canada (100 MT).
Sorghum:
For 2020/2021, total net sales reductions of 52,200 MT were for China. Exports of 72,400 MT were down 42 percent from the previous week and 49 percent from the prior 4-week average. The destination was China.
Rice:
Net sales of 92,300 MT for 2020/2021 were up 14 percent from the previous week and 22 percent from the prior 4-week average. Increases were primarily for Mexico (35,300 MT), Venezuela (31,500 MT), El Salvador (7,000 MT, including decreases of 1,000 MT), the
Dominican Republic (4,600 MT), and Guatemala (2,500 MT). Exports of 144,000 MT were up noticeably from the previous week and from the prior 4-week average. The destinations were primarily to Mexico (27,500 MT), South Korea (27,100 MT), Haiti (21,600 MT),
Guatemala (14,300 MT), and Japan (13,800 MT).
Soybeans:
Net sales of 334,000 MT for 2020/2021 were up noticeably from the previous week, but down 33 percent from the prior 4-week average. Increases primarily for Mexico (139,700 MT, including 34,000 MT switched from unknown destinations and decreases of 1,900 MT),
Germany (137,700 MT), Japan (121,800 MT, including 45,000 MT switched from unknown destinations and decreases of 2,600 MT), the Netherlands (68,100 MT, including 60,000 MT switched from unknown destinations), and Bangladesh (56,000 MT, including 55,000 MT
switched from unknown destinations), were offset by reductions primarily for unknown destinations (351,400 MT). For 2021/2022, net sales of 199,400 MT were reported for China (198,000 MT) and Canada (1,400 MT). Exports of 1,160,800 MT were up 18 percent
from the previous week, but down 22 percent from the prior 4-week average. The destinations were primarily to China (320,600 MT), Germany (137,700 MT), Egypt (115,800 MT), Taiwan (105,700 MT), and Japan (98,500 MT).
Exports
for Own Account:
The current exports for own account outstanding balance is 5,800 MT, all Canada.
Export
Adjustments:
Accumulated exports of soybeans to the Netherlands were adjusted down 68,676 MT for week ending February 4th
and 69,060 MT for week ending February 18th. The correct destination for these shipments was Germany.
Soybean
Cake and Meal:
Net sales of 187,400 MT for 2020/2021 were up 17 percent from the previous week, but down 28 percent from the prior 4-week average. Increases primarily for the Philippines (49,000 MT, including decreases of 1,000 MT), Mexico (37,400 MT, including decreases
of 22,400 MT), the Dominican Republic (33,800 MT), Canada (21,300 MT, including decreases of 500 MT), and the United Kingdom (19,500 MT, including 17,700 MT switched from unknown destinations), were offset by reductions primarily for unknown destinations (27,700
MT). Exports of 432,800 MT–a marketing-year high–were up noticeably from the previous week and up 80 percent from the prior 4-week average. The destinations were primarily to Mexico (68,000 MT), Vietnam (48,700 MT), the Philippines (48,200 MT), Colombia
(42,200 MT), and Chile (36,500 MT).
Soybean
Oil:
Net sales of 5,500 MT for 2020/2021 were up 25 percent from the previous week and 16 percent from the prior 4-week average. Increases primarily for Guatemala (5,400 MT), El Salvador (1,000 MT), Canada (300 MT), and Trinidad and Tobago (100 MT), were offset
by reductions for Colombia (900 MT) and Venezuela (500 MT). Exports of 42,500 MT were up noticeably from the previous week and from the prior 4-week average. The destinations were primarily to Peru (18,900 MT), the Dominican Republic (14,500 MT), Colombia
(7,500 MT), Canada (1,000 MT), and Mexico (500 MT).
Cotton:
Net sales of 169,000 RB for 2020/2021 were down 32 percent from the previous week and 27 percent from the prior 4-week average. Increases primarily for Vietnam (65,300 RB, including 2,000 RB switched from China, 1,700 RB switched from South Korea, and decreases
of 1,700 RB), Pakistan (33,600 RB), China (24,100 RB, including decreases of 100 RB), Indonesia (23,200 RB, including 1,400 RB switched from Japan and decreases 2,800 RB), and Bangladesh (15,900 RB, including decreases of 100 RB), were offset by reductions
primarily for Turkey (23,900 RB). For 2021/2022, net sales of 40,600 RB were primarily for Vietnam (15,500 RB), China (13,200 RB), Guatemala (6,500 RB), Pakistan (2,600 RB), and Peru (1,500 RB). Exports of 377,400 RB were up 29 percent from the previous
week and 11 percent from the prior 4-week average. Exports were primarily to Vietnam (98,800 RB), China (94,700 RB), Pakistan (49,700 RB), Turkey (27,600 RB), and Indonesia (22,700 RB). Net sales of Pima totaling 7,800 RB were down 34 percent from the previous
week and 43 percent from the prior 4-week average. Increases were primarily for China (3,900 RB), Turkey (1,900 RB), India (1,600 RB, including decreases of 100 RB), and Italy (300 RB). Exports of 9,100 RB were down 26 percent from the previous week and
29 percent from the prior 4-week average. The destinations were primarily to China (2,600 RB), Vietnam (2,200 RB), Pakistan (1,100 RB), Peru (1,100 RB), and India (900 RB).
Exports
for Own Account:
For 2020/2021, new exports for own account totaling 13,900 RB were to Vietnam (10,600 RB), China (2,000 RB), Malaysia (1,100 RB), and Bangladesh (200 RB). Exports for own account totaling 6,500 RB to Vietnam (4,400 RB), China (1,700 RB), and Bangladesh (400
RB) were applied to new or outstanding sales. The current exports for own account outstanding balance of 40,500 RB is for China (28,200 RB), Vietnam (10,800 RB), Malaysia (1,100 RB), and Bangladesh (400 RB).
Hides
and Skins:
Net sales of 359,700 pieces for 2021 were up 71 percent from the previous week and 6 percent from the prior 4-week average. Increases primarily for China (240,500 whole cattle hides, including decreases of 15,300 pieces), South Korea (53,000 whole cattle
hides, including decreases of 1,700 pieces), Thailand (21,200 whole cattle hides, including decreases of 400 pieces), Taiwan (16,600 whole cattle hides), and Cambodia (9,800 whole cattle hides, including decreases of 700 pieces), were offset by reductions
for Japan (100 pieces). Total net sales of 5,000 calf skins were for Italy, including decreases of 800 pieces. In addition, total
net sales of 1,000 kip skins were for Belgium, including decreases of 1,000 pieces.
Exports of 392,100 pieces for 2021 were up 29 percent from the previous week and 10 percent from the prior 4-week average. Whole cattle hides exports were primarily to China (281,300 pieces), South Korea (54,300 pieces),
Mexico (28,000 pieces), Thailand (7,700 pieces), and Brazil (6,800 pieces). Exports of 1,800 calf skins were to Italy. Additionally, exports of 2,600 kip skins were to Belgium.
Net
sales of 75,700 wet blues for 2021 were up noticeably from the previous week, but down 28 percent from the prior 4-week average. Increases primarily for China (29,800 unsplit, including decreases of 600 unsplit and 600 grain splits), Brazil (19,600 unsplit),
Vietnam (16,300 unsplit), the Dominican Republic (6,400 unsplit), and Japan (4,300 unsplit), were offset by reductions for China (500 grain splits) and Italy (300 unsplit). Exports of 94,200 wet blues for 2021 were up 34 percent from the previous week, but
down 25 percent from the prior 4-week average. The destinations were primarily to Italy (23,100 unsplit and 10,600 grain splits), Vietnam (26,300 unsplit), China (22,700 unsplit), Mexico (2,100 grain splits and 1,000 unsplit), and Brazil (2,900 unsplit).
Net sales of 496,600 splits resulting in increases for Vietnam (398,000 pounds) and Taiwan (128,300 pounds, including decreases of 1,500 pounds), were offset by reductions for China (29,700 pounds). Exports of 377,500 pounds were to China (175,700 pounds),
Vietnam (160,000 pounds), and Taiwan (41,800 pounds).
Beef:
Net
sales of 22,600 MT reported for 2021 were up noticeably from the previous week and up 15 percent from the prior 4-week average. Increases primarily for South Korea (6,800 MT, including decreases of 500 MT), China (4,500 MT), Japan (3,800 MT, including decreases
of 500 MT), Taiwan (2,400 MT, including decreases of 100 MT), and Mexico (2,000 MT, including decreases of 100 MT), were offset by reductions primarily for the Philippines (100 MT). Exports of 19,700 MT were up 30 percent from the previous week and 20 percent
from the prior 4-week average. The destinations were primarily to Japan (5,700 MT), South Korea (5,000 MT), China (3,100 MT), Mexico (1,700 MT), and Taiwan (1,100 MT).
Pork:
Net
sales of 59,600 MT reported for 2021 were up noticeably from the previous week and up 68 percent from the prior 4-week average. Increases were primarily for China (28,000 MT, including decreases of 1,300 MT), Mexico (14,500 MT, including decreases of 1,100
MT), Japan (4,600 MT, including decreases 400 MT), Canada (2,700 MT, including decreases of 400 MT), and South Korea (2,200 MT, including decreases of 1,800 MT). Exports of 40,000 MT were up 13 percent from the previous week and 6 percent from the prior 4-week
average. The destinations were primarily to China (13,400 MT), Mexico (9,100 MT), Japan (4,600 MT), South Korea (2,500 MT), and Canada (2,100 MT).
March
4, 2021 1 FOREIGN AGRICULTURAL SERVICE/USDA
Terry Reilly
Senior Commodity Analyst – Grain and Oilseeds
Futures International
One Lincoln Center
18 W 140 Butterfield Rd.
Oakbrook Terrace, Il. 60181
W: 312.604.1366
ICE IM:
treilly1
Skype: fi.treilly

Trading of futures, options, swaps and other derivatives is risky and is not suitable for all persons. All of these investment products are leveraged, and you can lose more than your initial deposit. Each investment product is offered
only to and from jurisdictions where solicitation and sale are lawful, and in accordance with applicable laws and regulations in such jurisdiction. The information provided here should not be relied upon as a substitute for independent research before making
your investment decisions. Futures International, LLC is merely providing this information for your general information and the information does not take into account any particular individual’s investment objectives, financial situation, or needs. All investors
should obtain advice based on their unique situation before making any investment decision. The contents of this communication and any attachments are for informational purposes only and under no circumstances should they be construed as an offer to buy or
sell, or a solicitation to buy or sell any future, option, swap or other derivative. The sources for the information and any opinions in this communication are believed to be reliable, but Futures International, LLC does not warrant or guarantee the accuracy
of such information or opinions. Futures International, LLC and its principals and employees may take positions different from any positions described in this communication. Past results are not necessarily indicative of future results.