PDF Attached
WORLD
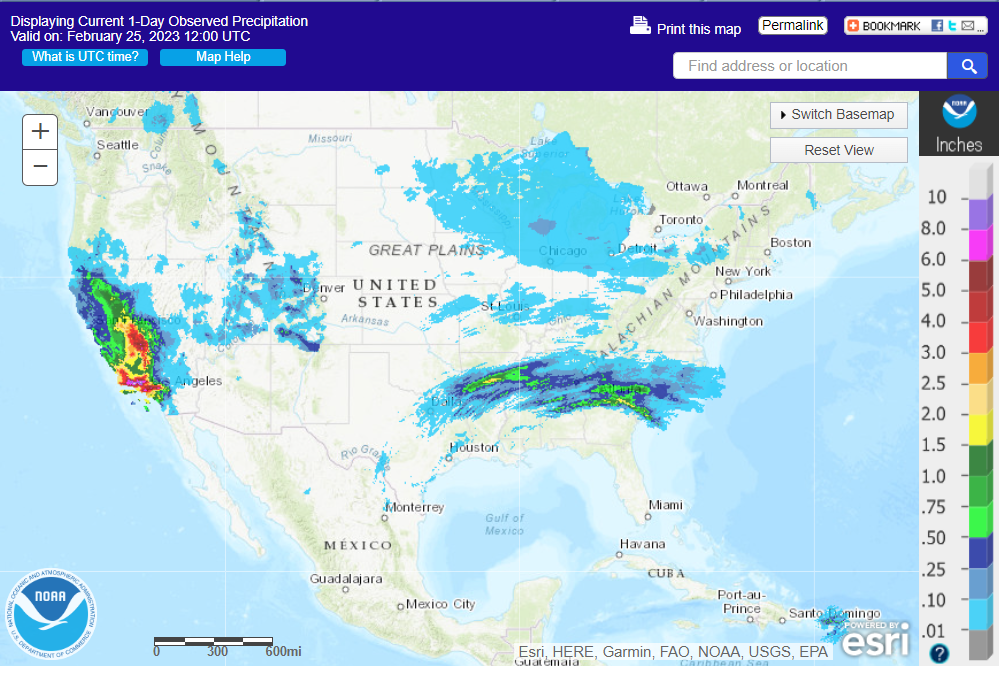
WEATHER HIGHLIGHTS FOR FEBRUARY 24, 2023
·
No changes in Brazil’s forecast were noted overnight
o
Brazil will continue too wet in Parana, Sao Paulo, portions of Mato Grosso do Sul and southernmost Minas Gerais
o
Mato Grosso weather will not be wet enough to seriously disrupt soybean harvesting or Safrinha corn planting, although some occasional rain will keep the planting pace a little slow at times
·
Argentina’s central and southern crop areas will be dry into Wednesday of next week and then there is a
chance for rain during the latter part of next week and into the following weekend
o
No drought busting rain is expected, but
there will be opportunity for relief from dryness in some central crop areas
o
Northern Argentina will see periodic rainfall over the next couple of weeks offering the best environment for crop improvements.
·
North America temperatures will continue cold in Canada’s Prairies and in the western United States over the next couple of weeks
·
Unusually warm temperatures have been occurring and will continue to occur in the southern U.S. Plains, Delta and southeastern states for another week to ten days bringing winter crops out of dormancy and stimulating some significant growth
·
Western U.S. hard red winter wheat areas will miss significant rain for a while longer
·
Recent cold weather in the northern and west-central high U.S. Plains has not induced permanent crop damage due to snow cover even though some of the snow cover was minimal in northwestern Kansas
·
Southwestern Europe will be cooler than usual into next week while the remainder of Europe and Asia will continue warmer than usual
·
Eastern China will continue to dry down for a while longer; including some rapeseed and wheat areas, although neither crop will be negatively impacted
o
Greater rain will be needed later in March and April to ensure the best crop development
·
India rainfall is still advertised to be minimal over the next ten days with temperatures near to slightly above normal
o
The environment will not be ideal for the best yields, but irrigated crops should perform normally
·
Southern Europe and northern Africa will experience greater rainfall potentials during the next couple of weeks which may bring some relief to dryness for some areas
·
Tropical Cyclone Freddy will produce significant rain in Mozambique today and Saturday
Source:
World Weather and FI
Friday,
Feb. 24:
- The
USDA’s Agricultural Outlook Forum, Arlington, day 2 - USDA
weekly net-export sales for corn, soybeans, wheat, cotton, pork and beef, 8:30am - ICE
Futures Europe weekly commitments of traders report - CFTC
commitments of traders weekly report on positions for various US futures and options, 3:30pm
“Staff
will begin with the CoT report that was originally scheduled to be published on Friday, February 3, 2023. Thereafter, staff intends to sequentially issue the missed CoT reports in an expedited manner, subject to reporting firms submitting accurate and complete
data. https://www.cftc.gov/PressRoom/PressReleases/8662-23
- FranceAgriMer’s
weekly crop conditions reports - US
cattle on feed, 3pm - US
cold storage data for beef, pork and poultry, 3pm
Monday,
Feb. 27:
- USDA
export inspections – corn, soybeans, wheat, 11am - Dubai
Sugar Conference, day 1 - EARNINGS:
Olam, FGV
Tuesday,
Feb. 28:
- Dubai
Sugar Conference, day 2 - EU
weekly grain, oilseed import and export data - US
agricultural prices paid, received, 3pm - Malaysia’s
Feb. palm oil export data - Vietnam
coffee, rice and rubber export data - EARNINGS:
Golden Agri
Wednesday,
March 1:
- Dubai
Sugar Conference, day 3 - EIA
weekly US ethanol inventories, production, 10:30am - USDA
soybean crush, DDGS production, corn for ethanol, 3pm - Global
Grain and Animal Feed Asia 2023, Singapore, day 1
Thursday,
March 2:
- Dubai
Sugar Conference, day 4 - USDA
weekly net-export sales for corn, soybeans, wheat, cotton, pork and beef, 8:30am - Port
of Rouen data on French grain exports - Global
Grain and Animal Feed Asia 2023, day 2
Friday,
March 3:
- FAO
World Food Price Index, grains report - ICE
Futures Europe weekly commitments of traders report - CFTC
commitments of traders weekly report on positions for various US futures and options, 3:30pm - FranceAgriMer’s
weekly crop conditions reports - Global
Grain and Animal Feed Asia 2023, day 3
Source:
Bloomberg and FI
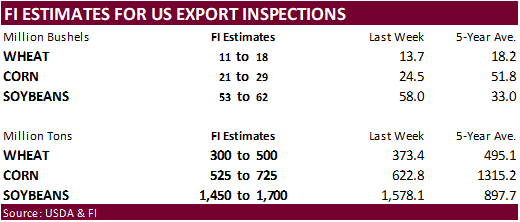
USDA
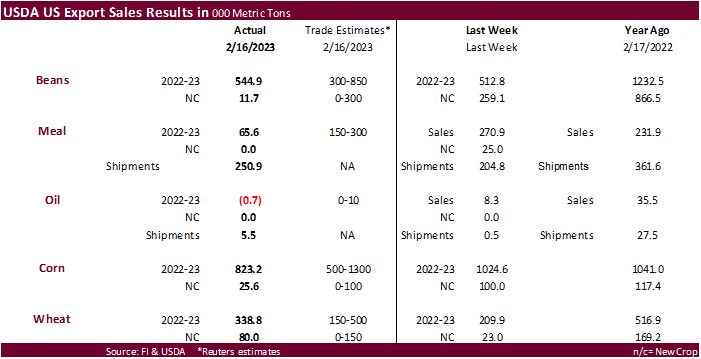
export sales were within expectations for soybeans but poor for the products, within expectations for corn and within wheat.
Macros
Traders
Now Fully Price In 50Bps Of BoE Hikes By May
US
PCE Deflator (M/M) Jan: 0.6% (est 0.5%; prev 0.1%)
US
PCE Deflator (Y/Y) Jan: 5.4% (est 5.0%; prev 5.0%)
US
PCE Core Deflator (M/M) Jan: 0.6% (est 0.4%; prev 0.3%)
US
PCE Core Deflator (Y/Y) Jan: 4.7% (est 4.3%; prev 4.4%)
US
Personal Income Jan: 0.6% (est 1.0%; prevR 0.3%)
US
Personal Spending Jan: 1.8% (est 1.4%; prevR -0.1%)
US
Real Personal Spending Jan: 1.1% (est 1.1%; prev -0.3%)
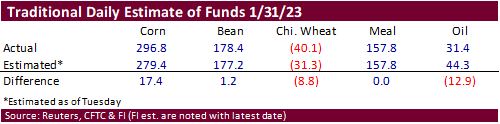
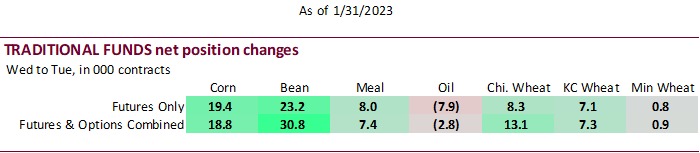
Commitment
of traders as of January 31

Reuters
table
SUPPLEMENTAL
Non-Comm Indexes Comm
Net Chg Net Chg Net Chg
Corn
141,657 18,972 354,826 -516 -421,624 -20,120
Soybeans
135,314 30,574 130,850 2,263 -220,387 -29,528
Soyoil
4,506 -2,273 101,241 4,991 -111,565 -2,309
CBOT
wheat -72,229 12,009 98,631 43 -26,003 -12,265
KCBT
wheat -12,119 7,315 46,414 1,183 -30,830 -7,947
FUTURES
+ OPTS Managed Swaps Producer
Net Chg Net Chg Net Chg
Corn
219,924 18,127 215,543 744 -417,093 -21,161
Soybeans
175,504 29,242 72,824 1,456 -208,745 -28,938
Soymeal
140,943 5,440 76,694 2,480 -248,933 -6,501
Soyoil
31,224 -4,738 97,807 2,191 -134,580 1,042
CBOT
wheat -63,628 10,305 64,247 -846 -23,035 -12,418
KCBT
wheat 1,339 8,172 35,525 876 -30,821 -7,664
MGEX
wheat -1,825 1,086 1,646 150 -1,987 -2,101
———- ———- ———- ———- ———- ———-
Total
wheat -64,114 19,563 101,418 180 -55,843 -22,183
Live
cattle 87,833 10,977 44,084 -475 -134,032 -13,165
Feeder
cattle -2,474 3,075 2,418 -556 4,122 -1,618
Lean
hogs -7,865 -4,194 47,001 -289 -39,309 -858
Other NonReport Open
Net Chg Net Chg Interest Chg
Corn
56,485 626 -74,859 1,665 1,602,455 14,834
Soybeans
6,195 1,548 -45,778 -3,308 807,030 9,673
Soymeal
15,507 1,944 15,789 -3,364 477,982 7,609
Soyoil
-269 1,913 5,817 -409 461,965 19,000
CBOT
wheat 22,814 2,746 -399 212 414,563 -5,107
KCBT
wheat -2,577 -833 -3,467 -551 202,955 6,767
MGEX
wheat 1,610 -209 556 1,074 60,605 1,989
———- ———- ———- ———- ———- ———-
Total
wheat 21,847 1,704 -3,310 735 678,123 3,649
Live
cattle 11,046 3,628 -8,930 -965 381,520 1,103
Feeder
cattle 158 1,792 -4,224 -2,693 59,790 -3,353
Lean
hogs -1,782 3,224 1,955 2,118 289,404 5,869
Corn
·
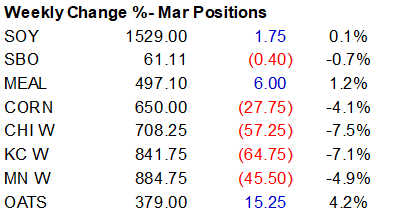
Corn futures ended
lower, lowest since Mid-January (May position) on follow through selling and lack of fresh fundamental news. China indicated they don’t want the Ukraine/Russia conflict to escalate. The recent winter storm across the central and upper Midwest dropped a good
amount of precipitation, beneficial for soil moisture ahead of the US growing season. USDA export sales were within a range of trade estimates.
·
South Korea was active buying corn but most of it may originate from South America.
·
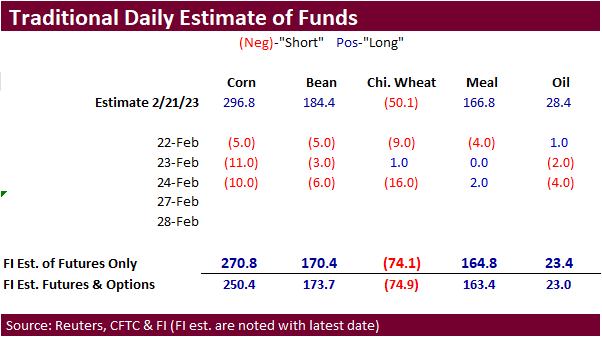
Funds were estimated net sellers of 10,000 corn contracts.
Export
developments.
-
South
Korea’s KFA bought 63,000 tons of optional origin corn at an estimated $334.45 a ton c&f for arrival around June 20.
-
South
Korea’s FLC bought 65,000 tons of optional origin corn at an estimated $334.49 a ton c&f for arrival around June 20.
-
South
Korea’s MFG bought an estimated 50,000 tons of feed corn from South Africa at an estimated $334.50/ton c&f for arrival around June 23 with shipment between May 5 and May 24. -
South
Korea’s NOFI group bought an estimated 69,000 tons of corn for arrival in South Korea around June 15 at $334.49 a ton c&f for shipment sometime between late April through FH May shipment.
Updated
02/22/23
Soybeans
·
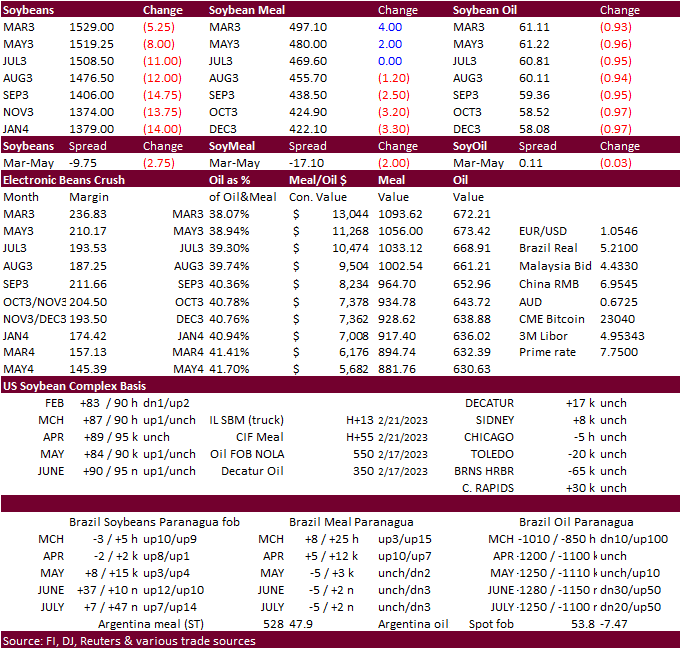
CBOT soybeans fell on widespread commodity selling and positioning ahead of the weekend. May soybeans reach a one week low after a hitting multi month high on Wednesday. Poor Argentina crop conditions supported nearby meal prices.
Soybean oil fell on product spreading. China plans to auction off soybean oil from state reserves next week. USDA export sales last week were slow for soybeans and poor for the products.
·
Argentina crushed 1.9 million tons of soybeans during the month of January, down 24 percent from a year ago and well below 2.6 million tons crushed during December 2022.
·
Argentina producers will launch a protest next week over taxes, exchange rates and financial support.
·
Funds were net sellers of an estimated net 6,000 soybeans, bought 2,000 meal and sold 4,000 soybean oil.
·
Brazil producers collected 30.3 percent of their soybean crop, down from 41.8 percent year earlier.
·
Brazil’s government will decide whether or not to raise their biodiesel mandate next month. It’s currently at 10 percent, lowered from 13 percent a while back.
·
Yesterday Egypt bought a combined 79,000 tons of vegetable oils.
·
Malaysia May palm futures fell on Friday from profit taking.
·
AmSpec reported February 1-25 palm oil exports up 15.3 percent to 949,082 tons from 823,376 tons during January 1-25. ITS reported a 25.4 percent rise to 1.034 million tons from 824,373 tons during January 1-25.
Export
Developments
·
China plans to auction off 32,472 tons of soybean oil from state reserves on February 28.
·
Turkey’s state grain board TMO bought about 48,000 tons of crude sunflower oil for delivery March 13-April 13 and April 14-May 14. Prices ranged from $1,159 to $1,173.80.
Updated
02/22/23
Soybean
meal – May $435-$500
Wheat
·
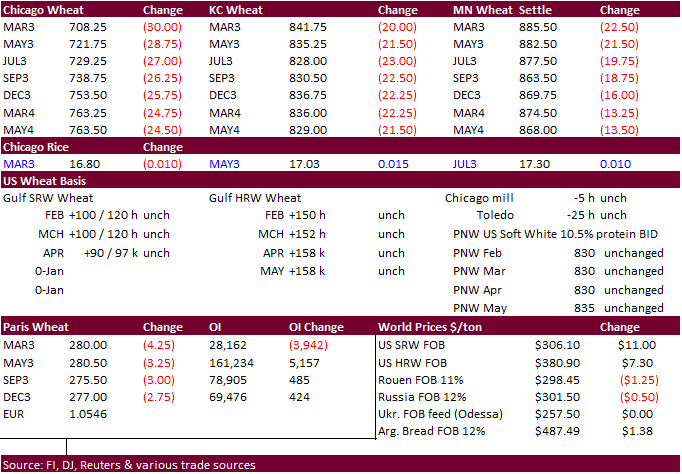
US wheat futures fell sharply on ideas the Black Sea grain export deal will be extended and no indications Russia stepped up their offense on Ukraine on the first anniversary. Black Sea wheat remains cheapest origin in the world.
Paris wheat hit a one month low.
·
Funds were net sellers of an estimated net 16,000 Chicago wheat contracts.
·
Traders are waiting for Black Sea grain export deal news. Negotiations should have already started. Expect prices to remain choppy until a decision has been finalized.
·
France reported nearly all of the winter wheat crop was rated in good to excellent condition. 95 percent was reported G/E for winter wheat, up 2 point previous week and 92 percent two week prior.
·
Paris May wheat was down 1.3% at 280.00 euros ($295.60) a ton.
·
China will auction off 140,000 tons of wheat from state reserves on March 1. USDA export sales is delayed until Friday.
·
India so far sold 1.81 million tons of wheat in the open market.
Export
Developments.
·
Iraq bought an estimated 200,000 tons of milling wheat this week from Australia at $428/ton c&f.
·
Turkey seeks an estimated 790,000 tons of milling wheat on February 28 for March 8-April 7 and April 10-May 10 shipment.
·
Jordan’s state grain buyer seeks 120,000 tons of optional origin milling wheat on February 28 for shipment between Aug. 1-15 and Aug. 16-31.
·
Jordan’s state grain buyer seeks 120,000 tons of optional origin feed barley for shipment between June 1-15, June 16-30, and July 1-15.
·
Taiwan seeks 48,975 tons of US milling wheat on March 1 for PNW shipment between April 19 and May 3. Wheat types sought include dark northern spring, hard red winter and white wheat.
·
Turkey seeks 440,000 tons of feed barley on March 2.
Rice/Other
·
None reported
Updated
02/25/23
KC
– May $7.50-$9.25
MN
– May
$8.00-$10.00
U.S.
EXPORT SALES FOR WEEK ENDING 2/16/2023
|
|
CURRENT |
NEXT |
||||||
|
COMMODITY |
NET |
OUTSTANDING |
WEEKLY |
ACCUMULATED |
NET |
OUTSTANDING |
||
|
CURRENT |
YEAR AGO |
CURRENT |
YEAR AGO |
|||||
|
|
THOUSAND |
|||||||
|
WHEAT |
|
|
|
|
|
|
|
|
|
HRW |
83.9 |
756.9 |
1,869.7 |
74.5 |
3,835.5 |
5,367.0 |
0.0 |
101.3 |
|
SRW |
53.4 |
632.5 |
641.7 |
29.3 |
2,013.5 |
2,001.1 |
26.0 |
183.1 |
|
HRS |
120.9 |
1,055.9 |
1,050.6 |
116.4 |
4,013.6 |
3,722.2 |
0.0 |
49.8 |
|
WHITE |
80.0 |
1,035.5 |
618.3 |
102.1 |
3,194.3 |
2,541.7 |
19.0 |
42.4 |
|
DURUM |
0.7 |
68.6 |
19.8 |
15.8 |
244.5 |
149.9 |
35.0 |
36.9 |
|
TOTAL |
338.8 |
3,549.3 |
4,200.1 |
338.0 |
13,301.3 |
13,782.0 |
80.0 |
413.5 |
|
BARLEY |
0.3 |
3.9 |
13.8 |
0.8 |
8.0 |
14.7 |
0.0 |
0.0 |
|
CORN |
823.2 |
14,276.5 |
23,354.5 |
687.4 |
14,363.4 |
24,218.9 |
25.5 |
1,562.7 |
|
SORGHUM |
102.8 |
634.0 |
3,923.0 |
71.3 |
366.0 |
2,642.5 |
0.0 |
0.0 |
|
SOYBEANS |
544.9 |
7,728.7 |
9,284.1 |
1,739.7 |
40,849.6 |
40,025.3 |
11.7 |
1,173.8 |
|
SOY |
65.6 |
2,899.4 |
3,188.1 |
250.9 |
4,653.8 |
5,044.9 |
0.0 |
78.4 |
|
SOY |
-0.8 |
19.8 |
179.5 |
5.5 |
31.1 |
379.0 |
0.0 |
0.6 |
|
RICE |
|
|
|
|
|
|
|
|
|
L |
17.6 |
164.6 |
272.3 |
3.9 |
308.8 |
815.8 |
0.0 |
0.0 |
|
M |
0.0 |
32.1 |
9.0 |
1.0 |
18.3 |
4.6 |
0.0 |
0.0 |
|
L |
0.0 |
3.3 |
19.3 |
0.5 |
12.9 |
30.1 |
0.0 |
0.0 |
|
M&S |
0.1 |
35.8 |
44.1 |
0.1 |
8.6 |
41.5 |
0.0 |
0.0 |
|
L |
0.7 |
127.9 |
83.6 |
14.9 |
367.8 |
494.0 |
0.0 |
0.0 |
|
M |
13.8 |
142.1 |
168.1 |
1.9 |
146.2 |
234.0 |
0.0 |
0.0 |
|
TOTAL |
32.2 |
505.7 |
596.5 |
22.2 |
862.5 |
1,620.0 |
0.0 |
0.0 |
|
COTTON |
|
THOUSAND |
||||||
|
UPLAND |
425.3 |
5,179.1 |
7,732.7 |
193.6 |
5,179.2 |
4,848.9 |
11.9 |
1,297.1 |
|
PIMA |
1.4 |
41.1 |
184.5 |
3.9 |
93.9 |
223.3 |
0.0 |
3.5 |
Export
Sales Highlights
This
summary is based on reports from exporters for the period February 10-16, 2023.
Wheat: Net
sales of 338,800 metric tons (MT) for 2022/2023 were up 62 percent from the previous week and 39 percent from the prior 4-week average. Increases primarily for the Philippines (105,000 MT), Mexico (69,000 MT, including decreases of 200 MT), China (68,300 MT,
including 65,000 MT switched from unknown destinations), Vietnam (36,000 MT), and Thailand (30,400 MT, including decreases of 200 MT), were offset by reductions for unknown destinations (46,100 MT). Net sales of 80,000 MT for 2023/2024 were reported for unknown
destinations (35,000 MT), Nigeria (26,000 MT), and Thailand (19,000 MT). Exports of 338,000 MT were down 32 percent from the previous week and 25 percent from the prior 4-week average. The destinations were primarily to China (68,300 MT), Japan (64,000 MT),
Thailand (56,900 MT), Mexico (55,300 MT), and Taiwan (51,500 MT).
Corn: Net
sales of 823,200 MT for 2022/2023 were down 20 percent from the previous week and 30 percent from the prior 4-week average. Increases primarily for Japan (312,000 MT, including 137,000 MT switched from unknown destinations and decreases of 96,000 MT), Mexico
(289,600 MT, including decreases of 2,400 MT), Taiwan (77,500 MT, including 70,000 MT switched from China), Colombia (73,200 MT, including decreases of 8,400 MT), and Venezuela (50,000 MT), were offset by reductions for China (69,900 MT) and Italy (35,000
MT). Net sales of 25,500 MT for 2023/2024 were reported for El Salvador (22,500 MT) and unknown destinations (3,000 MT). Exports of 687,400 MT were up 3 percent from the previous week and 7 percent from the prior 4-week average. The destinations were primarily
to Mexico (272,300 MT), Japan (137,000 MT), Taiwan (83,600 MT), Guatemala (63,200 MT), and Colombia (36,700 MT).
Optional
Origin Sales: For
2022/2023, the current outstanding balance of 100,000 MT, all South Korea.
Barley: Total
net sales of 300 MT for 2022/2023 were for Japan. Exports of 800 MT were to Japan.
Sorghum:
Net sales of 102,800 MT for 2022/2023 were down 9 percent from the previous week, but up 18 percent from the prior 4-week average. Increases reported for China (115,800 MT, including 68,000 MT switched from unknown destinations), were offset by reductions
for unknown destinations (13,000 MT). Exports of 71,300 MT were up noticeably from the previous week and from the prior 4-week average. The destination was primarily to China (70,800 MT).
Rice: Net
sales of 32,200 MT for 2022/2023 were down 46 percent from the previous week and from the prior 4-week average. Increases primarily for Honduras (18,600 MT), Japan (13,000 MT), Canada (700 MT, including decreases of 100 MT), Mexico (600 MT, including decreases
of 300 MT), and the Bahamas (200 MT), were offset by reductions for Guatemala (900 MT), Saudi Arabia (300 MT), and El Salvador (100 MT). Exports of 22,200 MT were down 64 percent from the previous week and 53 percent from the prior 4-week average. The destinations
were primarily to Haiti (12,000 MT), Mexico (5,900 MT), Canada (2,500 MT), Saudi Arabia (700 MT), and Jordan (300 MT).
Soybeans: Net
sales of 544,900 MT for 2022/2023 were up 20 percent from the previous week, but down 18 percent from the prior 4-week average. Increases primarily for China (176,200 MT, including 119,800 MT switched from unknown destinations, decreases of 3,100 MT, and 21,000
MT – late), Egypt (142,300 MT, including 50,000 MT switched from unknown destinations), the Netherlands (125,200 MT, including 128,000 MT switched from unknown destinations and decreases of 5,600 MT), Germany (124,300 MT, including 66,000 MT switched from
unknown destinations), and Indonesia (81,400 MT, including 55,000 MT switched from unknown destinations, decreases of 500 MT, and 6,800 MT – late), were offset by reductions primarily for unknown destinations (311,300 MT). Total net sales of 11,700 MT for
2023/2024 were for Japan. Exports of 1,739,700 MT were down 6 percent from the previous week and from the prior 4-week average. The destinations were primarily to China (1,057,800 MT, including 16,000 MT – late), the Netherlands (125,200 MT), Germany (124,300
MT), Egypt (90,300 MT), and Indonesia (84,800 MT, including 6,800 MT – late).
Optional
Origin Sales: For
2022/2023, the current outstanding balance of 300 MT, all South Korea.
Export
for Own Account: For
2022/2023, the current exports for own account outstanding balance of 1,600 MT are for Canada (1,500 MT) and Taiwan (100 MT).
Export
Adjustments: Accumulated
exports of soybeans to the Netherlands were adjusted down 56,678 MT for week ending February 9th. The correct destination for this shipment is Germany.
Late
Reporting: For
2022/2023, net sales totaling 65,800 MT of soybeans were reported late for China (21,000 MT), Malaysia (12,100 MT), Thailand (10,900 MT), Taiwan (9,500 MT), Indonesia (6,800 MT), Vietnam (3,700 MT), and the Philippines (1,800 MT). Exports of 48,000 MT were
late to China (16,000 MT), Malaysia (10,100 MT), Indonesia (6,800 MT), Taiwan (5,000 MT), Thailand (4,900 MT), Vietnam (3,500 MT), and the Philippines (1,700 MT).
Soybean
Cake and Meal: Net
sales of 65,600 MT for 2022/2023 were down 76 percent from the previous week and 72 percent from the prior 4-week average. Increases primarily for Colombia (21,400 MT, including decreases of 16,400 MT), Honduras (11,200 MT, including decreases of 13,700 MT),
the Dominican Republic (10,500 MT), Mexico (6,500 MT), and Trinidad and Tobago (4,000 MT), were offset by reductions for Guatemala (100 MT) and Taiwan (100 MT). Exports of 250,900 MT were up 23 percent from the previous week, but down 8 percent from the prior
4-week average. The destinations were primarily to the Philippines (48,600 MT), Saudi Arabia (46,100 MT), Mexico (34,000 MT), Ecuador (32,300 MT), and the Dominican Republic (31,500 MT).
Soybean
Oil: Total
net sales reductions of 800 MT for 2022/2023 were down noticeably from the previous week and from the prior 4-week average. The destination was for Canada. Exports of 5,500 MT were up noticeably from the previous week and from the prior 4-week average. The
destinations were to Colombia (5,000 MT) and Canada (500 MT).
Cotton:
Net sales of 425,300 RB for 2022/2023–a marketing-year high–were up 96 percent from the previous week and 97 percent from the prior 4-week average. Increases primarily for Vietnam (131,200 RB, including 1,900 RB switched from South Korea and 1,200 RB switched
from Japan), Pakistan (95,600 RB), Turkey (79,600 RB, including decreases of 6,800 RB), China (46,200 RB, including decreases of 18,100 RB), and Indonesia (19,200 RB, including 1,300 RB switched from China and 500 RB switched from Japan), were offset by reductions
primarily for Colombia (1,300 RB). Net sales of 11,900 RB for 2023/2024 were reported for Turkey (6,600 RB), Thailand (4,000 RB), and Colombia (1,300 RB). Exports of 193,600 RB were up 4 percent from the previous week, but down 1 percent from the prior 4-week
average. The destinations were primarily to Pakistan (54,300 RB), China (44,000 RB), Vietnam (28,200 RB), Mexico (17,100 RB), and Turkey (15,700 RB). Net sales of Pima totaling 1,400 RB for 2022/2023 were down 31 percent from the previous week and 30 percent
from the prior 4-week average. Increases were reported for Pakistan (700 RB), Thailand (400 RB), Indonesia (200 RB), and Malaysia (100 RB). Exports of 3,900 RB were down 43 percent from the previous week and 31 percent from the prior 4-week average. The destinations
were to China (2,200 RB), Vietnam (700 RB), India (400 RB), Pakistan (400 RB), and Bangladesh (200 RB).
Optional
Origin Sales: For
2022/2023, the current outstanding balance of 9,300 RB, all Malaysia.
Export
for Own Account: For
2022/2023, new exports for own account totaling 18,800 RB were to China (8,900 RB), Vietnam (6,700 RB), and Turkey (3,100 RB). Exports for own account totaling 21,700 RB primarily to China (18,600 RB) and Turkey (2,300 RB) were applied to new or outstanding
sales. The current exports for own account outstanding balance of 97,000 RB are for China (56,100 RB), Vietnam (26,300 RB), Turkey (5,700 RB), Pakistan (5,000 RB), South Korea (2,400 RB), and India (1,500 RB).
Hides
and Skins: Net
sales of 364,800 pieces for 2023 were down 45 percent from the previous week and 20 percent from the prior 4-week average. Increases primarily for China (244,400 whole cattle hides, including decreases of 19,000 pieces), South Korea (37,300 whole cattle hides,
including decreases of 2,600 pieces), Mexico (34,200 whole cattle hides, including decreases of 4,300 pieces), Italy (16,200 whole cattle hides, including decreases of 300 pieces), and Thailand (15,800 whole cattle hides, including decreases of 800 pieces),
were offset by reductions for Brazil (200 pieces). In addition, total net sales reductions of 200 kip skins were for Canada. Exports of 453,100 pieces were down 2 percent from the previous week and 3 percent from the prior 4-week average. Whole cattle hides
exports were primarily to China (302,800 pieces), Mexico (54,000 pieces), South Korea (51,200 pieces), Brazil (17,200 pieces), and Thailand (9,000 pieces). In addition, exports of 1,300 kip skins were to Canada.
Net
sales of 102,500 wet blues for 2023 were up 4 percent from the previous week, but down 11 percent from the prior 4-week average. Increases primarily for Vietnam (42,100 unsplit, including decreases of 100 unsplit), China (28,500 unsplit), Italy (12,400 unsplit,
including decreases of 100 unsplit), Thailand (10,700 unsplit), and Taiwan (4,600 unsplit), were offset by reductions for Brazil (100 grain splits). Exports of 166,900 wet blues were up 12 percent from the previous week and 30 percent from the prior 4-week
average. The destinations were primarily to Italy (54,500 unsplit and 1,900 grain splits), China (41,500 unsplit), Vietnam (22,600 unsplit), Thailand (15,400 unsplit), and Hong Kong (13,000 unsplit). Net sales of 1,500 splits reported for Vietnam (3,000 pounds)
and Hong Kong (2,700 pounds), were offset by reductions for South Korea (4,200 pounds). Exports of 42,300 pounds were to Hong Kong.
Beef: Net
sales of 15,400 MT for 2023 were down 45 percent from the previous week and 35 percent from the prior 4-week average. Increases primarily for China (4,300 MT, including decreases of 100 MT), South Korea (2,800 MT, including decreases of 400 MT), Japan (2,200
MT, including decreases of 600 MT), Taiwan (1,600 MT, including decreases of 100 MT), and Canada (1,200 MT, including decreases of 100 MT), were offset by reductions for Colombia (100 MT). Total net sales of 100 MT for 2024 were for Canada. Exports of 16,700
MT were unchanged from the previous week and from the prior 4-week average. The destinations were primarily to South Korea (4,600 MT), Japan (4,100 MT), China (3,400 MT), Mexico (1,500 MT), and Taiwan (900 MT).
Pork: Net
sales of 51,900 MT for 2023 were up 16 percent from the previous week and 39 percent from the prior 4-week average. Increases were primarily for Mexico (25,000 MT, including decreases of 300 MT), China (12,100 MT, including decreases of 200 MT), Japan (4,000
MT, including decreases of 200 MT), South Korea (2,700 MT, including decreases of 600 MT), and Colombia (2,300 MT, including decrease of 100 MT). Exports of 29,200 MT were down 4 percent from the previous week and 8 percent from the prior 4-week average. The
destinations were primarily to Mexico (13,000 MT), Japan (3,300 MT), China (3,100 MT), South Korea (2,900 MT), and Canada (2,000 MT).
| Terry Reilly Senior Commodity Analyst – Grain and Oilseeds |
| Futures International One Lincoln Center 18W140 Butterfield Rd. Suite 1450 Oakbrook terrace, Il. 60181 |
| Work: 312.604.1366 ICE IM: treilly1 Skype IM: fi.treilly |
| treilly@futures-int.com
|
| DISCLAIMER: The contents of this communication and any attachments are for informational purposes only and under no circumstances should they be construed as an offer to buy or sell, or a solicitation to buy or sell any future, option, swap or other derivative. The sources for the information and any opinions in this communication are believed to be reliable, but Futures International, LLC does not warrant or guarantee the accuracy of such information or opinions. This communication may contain links to third party websites which are not under the control of FI and FI is not responsible for their content. Trading of futures, options, swaps and other derivatives is risky and is not suitable for all persons. All of these investment products are leveraged, and you can lose more than your initial deposit. Each investment product is offered only to and from jurisdictions where solicitation and sale are lawful, and in accordance with applicable laws and regulations in such jurisdiction. The information provided here should not be relied upon as a substitute for independent research before making your investment decisions. Futures International, LLC is merely providing this information for your general information and the information does not take into account any particular individual’s investment objectives, financial situation, or needs. All investors should obtain advice based on their unique situation before making any investment decision. Futures International, LLC and its principals and employees may take positions different from any positions described in this communication. Past results are not necessarily indicative of future results. |