PDF Attached
The
USDA Agriculture Forum selected presentations https://www.usda.gov/oce/ag-outlook-forum
WEATHER
EVENTS AND FEATURES TO WATCH
- U.S.
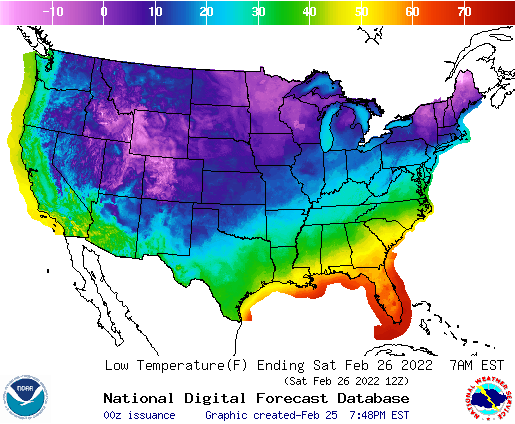
hard red winter wheat areas experienced another morning of near and below-zero degree Fahrenheit temperatures with little to no snow on the ground, clear skies and light wind speeds - Concern
over wheat conditions has been rising this week because of the recent series of dramatic temperature swings and ongoing dryness in some areas - Heaving
topsoil may be damaging root systems - Recent
warm temperatures may have reduced winter hardiness, but the bitter cold of the past two days has certainly reversed that trend - U.S.
hard red winter wheat areas will see another temperature swing to warmer than usual conditions this weekend into next week when high temperatures return to the 60s and lower 70s - Normal
highs at this time of year should be in the 40s and 50s Fahrenheit - Cold
weather may return in the second week of March, but before that happens temperatures are likely to rise farther above normal - Southeastern
U.S. weather is expected to be dry and warm enough over the next two weeks to raise concern over drought development - The
area of concern will include Florida, southeastern Alabama, southern Georgia and a part of South Carolina - La
Nina springs usually bring on dryness in these areas and this year’s La Nina will last longer than usual raising the potential for planting delays and/or slow emergence and early season crop development - California
will continue struggling for precipitation of significance - Snow
water equivalency is still running 53-59% of the April 1 normal and varies from 61-78% of normal for this time of year - Much
more snowfall is needed to stop the decline in water reservoir levels during the year ahead - U.S.
Lower Midwest, the Tennessee River Basin and northern Delta received additional rain Thursday adding to runoff that has already induced some flooding - U.S.
lower Midwest weather will trend drier over the coming week while the Delta and Tennessee River Basin get another round of rain this weekend - Excessive
soil moisture will runoff during the week next week, but returning wet weather in the following week will likely lead to more flooding - Worry
over planting delays will likely rise during March in the northern Delta and Tennessee River Basin and the same may evolve in the lower eastern Midwest in the last days of March and early April - A
more active weather pattern will return to the central and eastern U.S. during the second week of the forecast and especially in the second week of March resulting in “opportunities” for rain and snow in the central Plains and western Corn Belt, but the volume
of moisture should remain low in the western high Plains region - West
Texas will get its next threat of rain in about ten days; until then conditions will be mostly dry - South
Texas and the Texas Coastal Bend area will receive some periodic rainfall, but it will be light - Any
moisture will be good for early season planting of corn and sorghum which is either about to begin or is already getting started - Greater
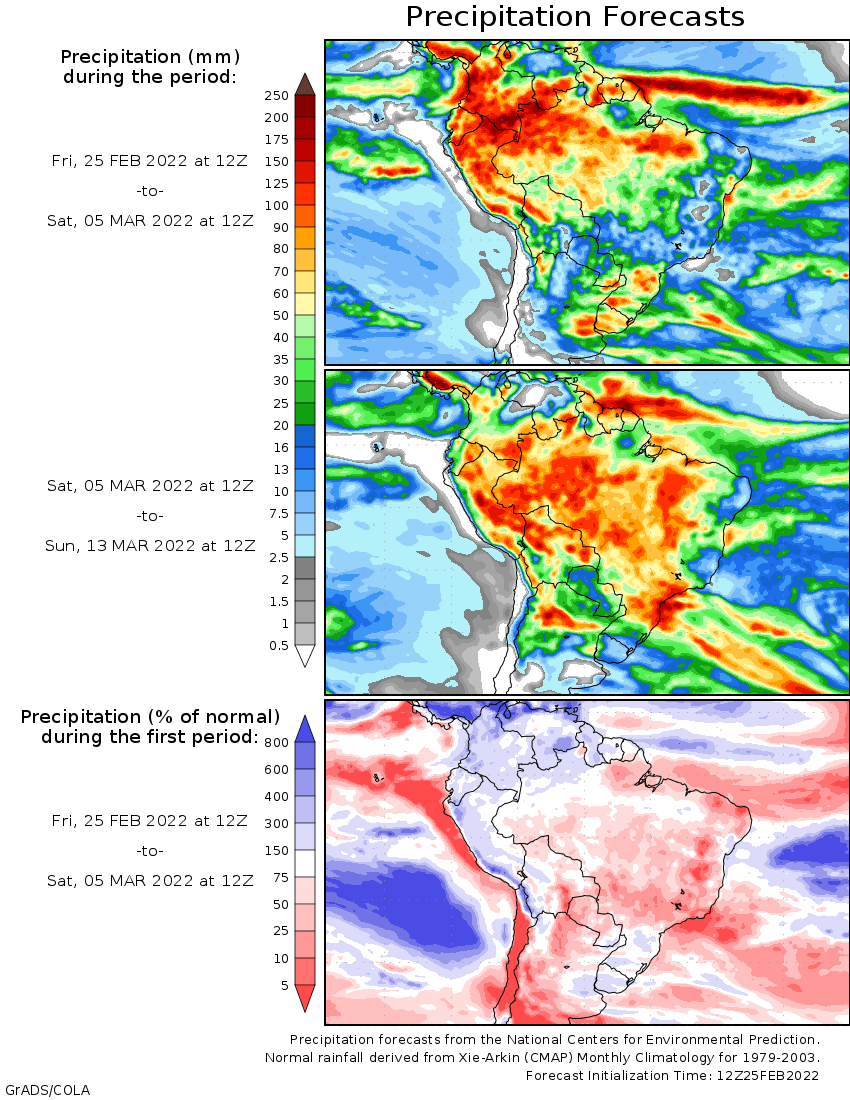
rain is desired, though - Argentina
rainfall Thursday diminished after being significant in the central and south Wednesday night into Thursday morning, but more waves of rain are expected - In
the coming week, central and northeastern Argentina will get 2.00 to 4.00 inches of rain and locally more
- This
moisture will wipe out the crop moisture stress in Santa Fe, Entre Rios, southern and eastern Chaco and Corrientes - The
precipitation comes a little late to seriously improve production, but it will stop the decline in crop conditions and production potential - Far
southern Argentina is not expecting much moisture in the coming week, but soil moisture is favorably rated to support ongoing crop development
- Interior
Southern Brazil (i.e. Mato Grosso do Sul and Parana) will be dry biased through Monday and then get some much needed rain Tuesday into the following weekend - The
precipitation will be well timed enough to improve Safrinha corn after a bout of dryness that may have delayed emergence and early development
- Far
southern Brazil will get rain like Argentina, although it will come mostly late this weekend into early next week - Northern
Rio Grande do Sul reported some rainfall Thursday and early today with amounts up to 1.00 inch in few areas - Much
greater rainfall should occur with next week’s rain - Northern
Brazil will experience less frequent and less significant rain over the next week to ten days favoring improved late season soybean and other summer crop maturation and harvest conditions - Coffee,
cocoa, sugarcane and citrus crops will all benefit from greater sunshine and warmer temperatures - Colombia,
Ecuador and western Venezuela may experience greater than usual rainfall in the coming week to ten days - Some
flooding may evolve next week - Northern
Parts of Brazil’s Amazon River Basin are will also experience the rainy weather - Northwest
Africa and parts of Spain are advertised to receive some needed moisture over the coming week to ten days - The
precipitation is needed to restore favorable soil moisture for aggressive wheat and barley development - Dryness
in recent weeks and months has raised concern about small grain production in northwestern Africa, although northeastern Algeria and far northern Tunisia never became too dry - Morocco
crops cannot fully recover from this year’s dryness because much of the crop in the southwest is dry and water supply has been depleted so that no planting could occur this year - Irrigated
and rain-fed crops in the remainder of northwestern Africa will benefit from the moisture and crop development could improve greatly with routinely occurring rainfall - Confidence
is not high over the prospects for additional rain, but the most active time of the year for storm systems to impact northern Africa is now - Ivory
Coast and Ghana will receive some much needed rainfall early next week to bolster soil moisture and induce some early season coffee and cocoa flowering - Other
west-central Africa coffee and cocoa production areas will not likely get much precipitation - Indonesia,
Malaysia and Philippines weather will remain mixed over the next ten days with most crops staying in good condition. - Excessive
rain is expected along the northeast coast of Peninsular Malaysia this weekend into early next week - Rain
totals may vary from 5.00 to 15.00 inches with much of that occurring today and Saturday - This
disturbance may move toward Sri Lanka and southern India in another week - Philippines
rainfall will be greatest in the southeast during the coming week - A
tropical disturbance near the coast of Northern Territory, Australia will produce very heavy rainfall this weekend into early next week before possibly turning to the south into eastern portions of Western Australia - Very
heavy rain will impact areas near Darwin, Australia - Excessive
rain will impact the lower Queensland and upper New South Wales, Australia coast this weekend resulting in some flooding - The
area produces sugarcane and a few sorghum and cotton areas may also be impacted - The
dairy region of northeastern New South Wales might also be included in this
- Eastern
Australia’s summer crop areas received some rainfall this week and more is needed - The
resulting precipitation should have been good for reducing moisture stress in unirrigated crop areas, although greater volumes of rain will still be needed for the late maturing crop - Irrigated
crops remain in mostly favorable condition - Middle
East rainfall over the coming week will prove to be welcome and beneficial so that there is an opportunity for additional crop improvements after a dry autumn and early winter - Southern
China is getting a break from recent wet weather this week with much less frequent precipitation and lighter amounts as well.
- Temperatures
should trend a little warmer this week and remain that way next week - Most
other areas in China are experiencing mostly good crop and field conditions - Wheat
and rapeseed are mostly dormant or semi-dormant, but poised to perform well this spring if temperatures warm up normally in March and April - Some
rapeseed areas in the Yangtze River Basin have been too wet recently and this week’s drier weather will be welcome - Northern
Vietnam and northern Laos will continue to dry down following impressive rainfall last weekend - The
precipitation was great enough to possibly induce some premature coffee flowering, although cool temperatures might have helped to curtail that event - Some
winter rice crop quality decline might have occurred - Drier
weather is expected over the next week to ten days - Most
of Europe outside of the Iberian Peninsula and parts of Romania are favorably moist with routinely occurring light precipitation in the next ten days supporting status quo winter crop conditions.
- Greater
rain must occur soon for Spain and Portugal and at some time in the next few weeks in Romania to prevent dryness from threatening early season crop development - Weather
in the coming ten days will produce light and somewhat erratic precipitation, but soil moisture is good except as noted above leaving the outlook relatively benign on agriculture.
- Western
Russia, northwestern Ukraine, Belarus and Baltic States have abundant soil moisture and some areas in Russia are still buried beneath significant snow accumulations - Flood
potentials may be high for the spring this year in Russia if the region heats up too fast and all of the snow melts over a short period of time
- Precipitation
in the western CIS over the coming week will be greatest near the Black Sea
- Russia
picked a good weather time to invade Ukraine with the region seeing some of its best weather in weeks - There
are no threatening cold temperatures expected in Europe or any part of Asia during the next ten days to two weeks - Temperatures
will be above normal especially in Russia, Ukraine and eastern Europe - Kazakhstan
and southern Russia’s New Lands will receive only light amounts of precipitation in the next ten days, but any moisture would be welcome for improved topsoil conditions in the spring - Recent
snowfall has changed the early spring moisture outlook at least a little, but the region still has moisture deficits left over from drought last summer and greater precipitation will be needed in the spring.
- India
precipitation will be limited to a few sporadic very light showers during the next ten days except in the far north and extreme east where some moderate rain may impact a few areas - A
weak tropical disturbance may impact Sri Lanka and the far southern tip of India during mid- to late-week next week, but confidence is low.
- The
bulk of winter crops in the nation are poised to perform well barring no excessive heat in the next few weeks - At
least one more timely rain event would help push yields high than usual - Xinjiang,
China precipitation is expected to be restricted during the next week to ten days - The
province needs moisture to support spring planting in a few weeks - Snow
and rain will impact areas from Pakistan through the mountains of western Xinjiang, China during the coming week to ten days possibly improving mountain snowpack and spring runoff potentials - South
Africa will experience a good mix of rain and sunshine for late season crop development - Summer
crop conditions are still rated quite favorably. - East-central
Africa precipitation has been and will continue to be most significant in Tanzania which is normal for this time of year.
- Ethiopia
is dry biased along with northern Uganda and that is also normal - Today’s
Southern Oscillation Index is +9.00 - The
index will move lower over the coming week - Mexico
will experience seasonable temperatures and a limited amount of rainfall during the coming week - Central
America precipitation will be greatest along the Caribbean Coast during the next seven to ten days - Guatemala
will also get some showers periodically
Source:
World Weather Inc.
Bloomberg
Ag Calendar
- USDA
weekly net-export sales for corn, soybeans, wheat, cotton, pork and beef, 8:30am
- ICE
Futures Europe weekly commitments of traders report, ~1:30pm - CFTC
commitments of traders weekly report on positions for various U.S. futures and options, 3:30pm - USDA
corn, cotton, soybean and wheat end-stockpile outlook, 8:30am - FranceAgriMer
weekly update on crop conditions - Malaysia’s
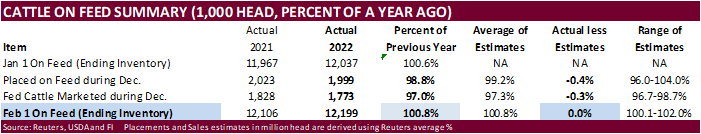
Feb. 1-25 palm oil exports - U.S.
cattle on feed, 3pm
Monday,
Feb. 28:
- USDA
export inspections – corn, soybeans, wheat, 11am - Ivory
Coast cocoa arrivals - Malaysia’s
Feb. 1-20 palm oil export data - Vietnam
General Statistics office releases Feb. coffee, rice, rubber export data - U.S.
agricultural prices paid, received, 3pm - EARNINGS:
Olam, FGV - HOLIDAY:
Brazil, Indonesia
Tuesday,
March 1:
- EU
weekly grain, oilseed import and export data - USDA
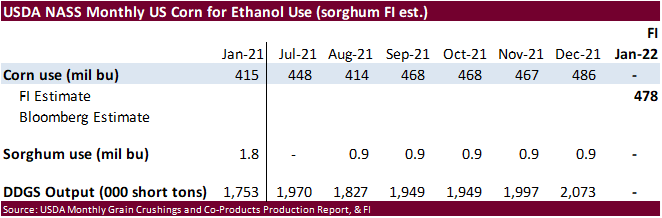
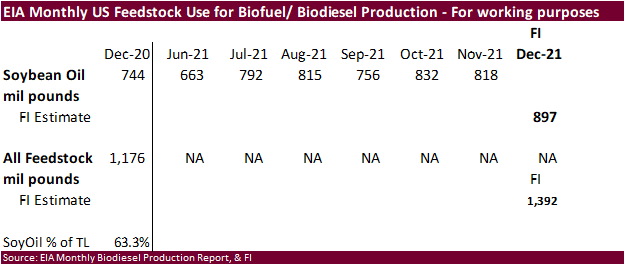
soybean crush, corn for ethanol, DDGS output, 3pm - U.S.
Purdue Agriculture Sentiment - Australia
Commodity Index - New
Zealand dairy trade auction - EARNINGS:
Golden Agri Resources - HOLIDAY:
Brazil, Argentina, India, South Korea
Wednesday,
March 2:
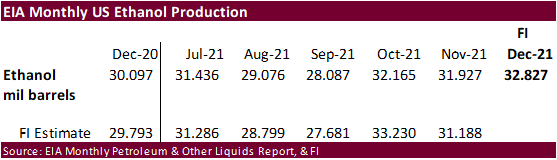
- EIA
weekly U.S. ethanol inventories, production, 11am - Winter
Grain conference in Siberia
Thursday,
March 3:
- FAO
Food Price Index - USDA
weekly net-export sales for corn, soybeans, wheat, cotton, pork and beef, 8:30am - New
Zealand Commodity Price - HOLIDAY:
Indonesia
Friday,
March 4:
- ICE
Futures Europe weekly commitments of traders report, ~1:30pm - CFTC
commitments of traders weekly report on positions for various U.S. futures and options, 3:30pm - FranceAgriMer
weekly update on crop conditions
Source:
Bloomberg and FI
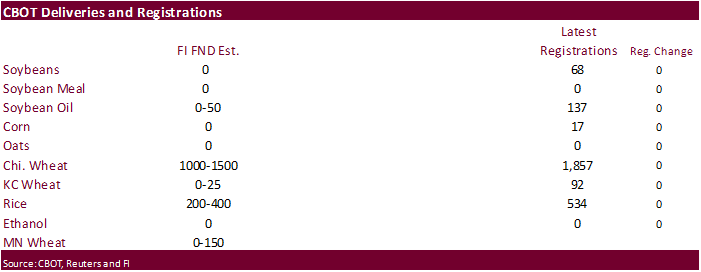
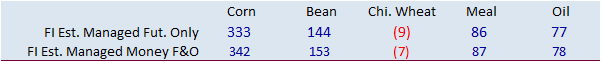
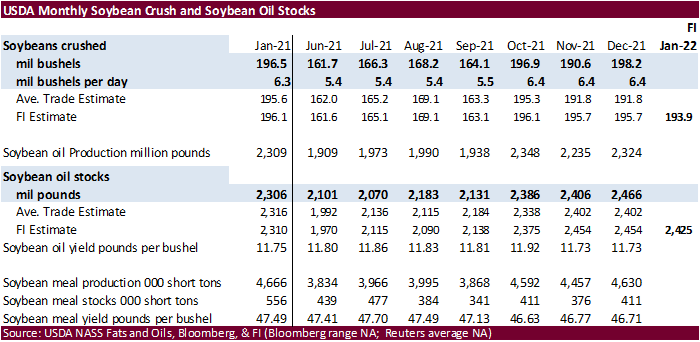
FI
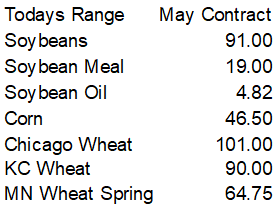
First Notice Delivery estimates
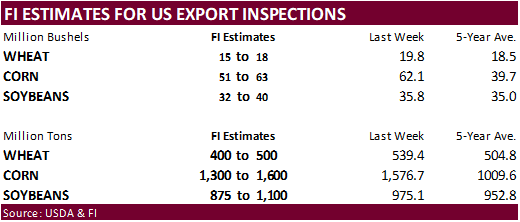
USDA
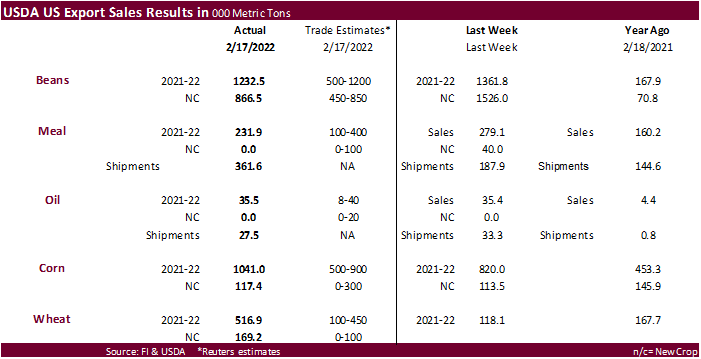
export sales
were within expectations for the soybean complex and slightly above for grains. Soybean sales of 1.233 million tons were slightly lower from previous week. Egypt bought 379,300 tons of soybeans (50k switched from unknown) and China booked 291,400 tons of
soybeans (172k switched from unknown). SBO sales of 35,500 tons stood out with India booking 30,000 tons, switched from unknown, confirming earlier speculation. Soybean meal sales of 231,900 tons included Philippines, Ireland and other routine buyers. Corn
export sales were 1.041 million tons, up from 820,000 tons previous week. Sorghum sales of 60,500 tons were mainly for China. All-wheat sales of 516,900 tons were up from 118,100 tons previous week, with increases for routine buyers.
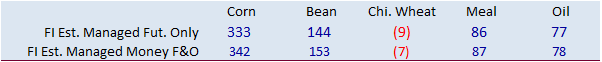
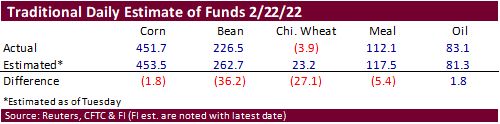
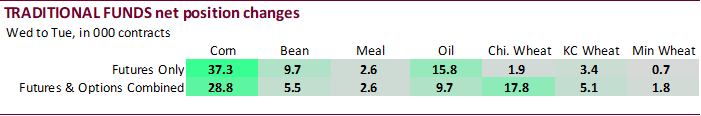
The
volatility that started last week was reflected in how analysts estimated the net fund positions. Funds were much less long than estimated for soybeans, Chicago wheat and to lesser extent soybean meal. One interesting thing we saw was index funds adding
to their long positions. The index fund net long position for combined soybeans, meal, soybean oil, corn, Chicago wheat and KC wheat was a record for the week ending February 22 of 1.096 million contracts. Managed money added 28,900 futures & options contracts
to their net long position.


As
of Friday
Reuters
table via CFTC
SUPPLEMENTAL
Non-Comm Indexes Comm
Net Chg Net Chg Net Chg
Corn
286,692 27,239 445,034 10,125 -702,827 -36,715
Soybeans
144,862 4,563 192,662 2,311 -306,408 -9,336
Soyoil
41,045 9,308 123,357 2,669 -178,852 -12,517
CBOT
wheat -40,327 15,662 145,684 -1,125 -98,575 -11,240
KCBT
wheat 16,997 4,384 58,358 923 -75,920 -5,312
=================================================================================
FUTURES
+ OPTS Managed Swaps Producer
Net Chg Net Chg Net Chg
Corn
354,436 28,922 297,381 7,399 -702,628 -35,522
Soybeans
180,334 4,962 132,138 375 -315,154 -8,332
Soymeal
90,417 1,247 94,704 2,399 -232,594 -4,995
Soyoil
79,200 8,819 91,235 -748 -183,177 -9,519
CBOT
wheat -18,053 16,606 91,961 -4,226 -81,625 -10,315
KCBT
wheat 40,780 4,729 25,544 -1,374 -64,770 -3,736
MGEX
wheat 6,983 1,715 2,472 365 -18,838 -1,834
———- ———- ———- ———- ———- ———-
Total
wheat 29,710 23,050 119,977 -5,235 -165,233 -15,885
Live
cattle 85,433 -629 84,159 561 -168,684 2,212
Feeder
cattle 2,667 -589 6,843 -110 -886 1,734
Lean
hogs 76,961 -2,281 64,003 1,609 -136,893 -1,644
Other NonReport Open
Net Chg Net Chg Interest Chg
Corn
79,711 -150 -28,899 -651 1,947,320 -115,356
Soybeans
33,798 534 -31,116 2,461 1,036,939 -87,897
Soymeal
18,181 1,315 29,291 33 489,168 -35,393
Soyoil
-1,705 908 14,449 541 457,440 -28,925
CBOT
wheat 14,499 1,231 -6,783 -3,296 471,913 -39,126
KCBT
wheat -2,118 376 564 6 233,966 -15,063
MGEX
wheat 4,861 78 4,521 -325 70,932 -3,134
———- ———- ———- ———- ———- ———-
Total
wheat 17,242 1,685 -1,698 -3,615 776,811 -57,323
Live
cattle 21,030 -449 -21,937 -1,695 414,494 7,774
Feeder
cattle 1,687 -766 -10,312 -268 57,428 -753
Lean
hogs 9,144 1,761 -13,214 554 362,129 -5,487
=================================================================================
Macros
77
Counterparties Take $1.603 Tln At Fed Reverse Repo Op (prev $1.650 Tln, 78 Bids)
US
Durable Goods Orders Jan P: 1.6% (est 1.0%; prev -0.7%; prevR 1.2%)
US
Durables Ex Transportation Jan P: 0.7% (est 0.4%; prev 0.6%; PrevR 0.9%)
US
PCE Core Deflator (M/M) Jan: 0.6% (est 0.6%; prev 0.4%; prevR 0.5%)
US
PCE Deflator (M/M) Jan: 0.6% (est 0.6%; prev 0.4%; prevR 0.5%)
US
Personal Income Jan: 0.0% (est -0.3%; prev 0.3%; prevR 0.4%)
US
Personal Spending Jan: 2.1% (est 1.6%; prev -0.6%; prevR -0.8%)
US
Real Personal Spending Jan: 1.5% (est 1.2%; prev -1.0%; prevR -1.3%)
US
Pending Home Sales (M/M) Jan: -5.7% (est 0.2%; prev R -2.3%)
–
Pending Home Sales NSA (Y/Y): -9.1% (est -1.8%; prev R -5.8%)
US
Univ. Of Michigan Sentiment Feb F: 62.8 (est 61.7; prev 61.7)
–
Conditions: 68.2 (est 68.5; prev 68.5)
–
Expectations: 59.4 (est 57.3; prev 57.4)
–
1-Year Inflation: 4.9% (prev 5.0%)
–
5-10 Year Inflation: 3.0% (prev 3.1%)
Corn
·
CBOT corn ended
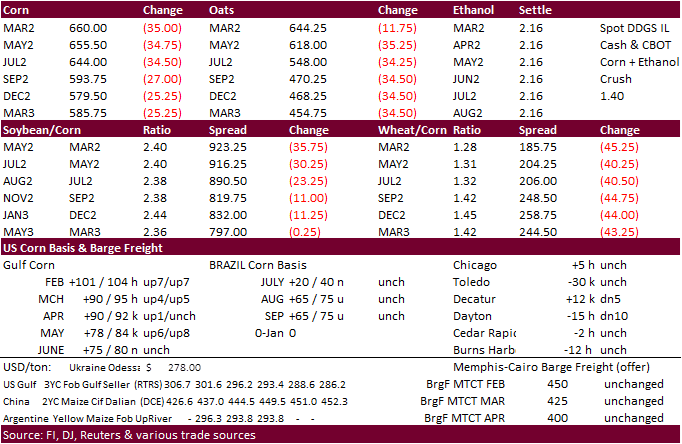
24.25-35.50 cents lower following weakness in other commodity markets and heavy fund selling. Funds sold an estimated net 45,000 corn contracts on Friday. Fundamental news directly related to the corn market was light. Taiwan passed on corn.
·
A media outlet said a missile hit a grain elevator in the Ovruch district of Zhytomyr region (northern Ukraine), which caught on fire.
·
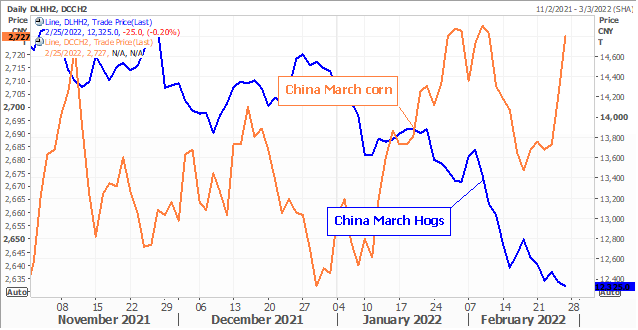
China’s end of January sow herd fell 0.9% from the previous month to 42.9 million head and is 2% above year ago. Pigs slaughtered were 28.47 million heads, down 1.7% from the previous month and up 45.9% from year ago.
·
USDA’s “confirms the presence of H5N1 highly pathogenic avian influenza (HPAI) in two commercial turkey flocks in Greene County, Indiana, and in backyard flocks in Kalamazoo County, Michigan and Knox County, Maine” (Bloomberg)
·
USDA’s Chickens and Eggs report showed January egg production up 1 percent. United States egg production totaled 9.59 billion during January 2022. The total number of layers during January 2022 averaged 391 million, down 1 percent
from last year. Egg-type chicks hatched were down 5 percent. Egg-type chicks hatched during January 2022 totaled 48.6 million. Eggs in incubators totaled 50.7 million on February 1, 2022, down 5 percent from a year ago. Broiler-type chicks hatched were down
1 percent. Broiler-type chicks hatched during January 2022 totaled 840 million. Eggs in incubators totaled 716 million on February 1, 2022, up 2 percent from a year ago.
Export
developments.
- Taiwan’s
MFIG passed on 65,000 tons of corn for shipment between May 1 and early June shipment, depending on origin.
The
lowest price offered for U.S corn was at a premium of 341.00 cents over the September. Lowest for Argentina was 349.13 cents over September. No offers for Brazilian or South African corn were reported.
Updated
2/24/22
May
corn is seen in a $6.50 and $7.25 range
December
corn is seen in a wide $5.50-$7.25 range
·
In a wide trading range, CBOT May soybeans
traded
sharply lower from end of week profit taking, technical selling, and rain that occurred across Argentina over the past couple of days. Yesterday BAGE rated Argentina’s soybean crop at 24% good/excellent, down from 31% last week. We think today’s move was
in large part to money flow and technical selling. Equities were sharply higher, so we could have seen long commodity liquidation (profits) roll into other instruments. Soybean products followed soybeans lower. CBOT May crush values popped 8.75 cents to $1.4875.
·
Funds sold an estimated net 30,000 soybean contracts on Friday, sold 8,000 soybean meal and sold 10,000 soybean oil.
·
Safras & Mercado estimated 2022 Brazil soybean exports at 80.5 million tons versus 85.5 million in a previous estimate, and left crush of 47.5 million tons unchanged. A smaller Brazil soybean crop impacts exports first, then
domestic demand if needed.
·
Egypt said they have enough reserves of vegetable oils to last about four months. They also have about five months of sugar and four months of rice reserves.
·
We are hearing there are soybean oil supply issues in Argentina and Bangladesh has been a good buyer of soybean oil.
·
India has about 380,000 tons of sunflower oil stuck in the Black Sea region as shipping was halted. They may have to buy palm and soybean oil for March/April shipment to meet consumption.
·
A report later said India might have to turn to Brazil for soybean oil. Abiove looks for Brazil soybean oil exports to surpass 1.7 million tons, a marketing year high.
·
Indonesia set its crude palm oil reference price at $1,432.24 per ton for March, above $1,314.78 for February, set tax and levy rates at maximum levels of $200 per ton and $175 per ton respectively, unchanged from February.
·
Indonesia’s Sumatra and Kalimantan saw heavy rain today.
·
AmSpec reported Malaysian palm oil exports for February 1-25 rose 27.9 percent to 1,060,303 tons from 829,022 tons during January 1-25. ITS reported a 25.1 percent increase to 1,095,753 tons from 876,056 tons.
- Results
awaited: Iran’s SLAL seeks up to 60,000 tons of soybean meal and 60,000 tons of feed barley for an unknown shipment period.
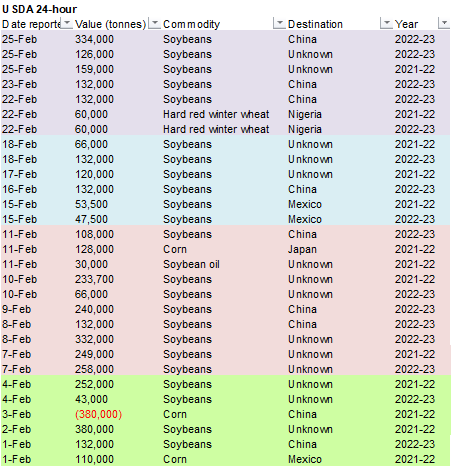
- Private
exporters reported the following activity:
-334,000
metric tons of soybeans received in the reporting period for delivery to China during the 2022/2023 marketing year
-285,000
metric tons of soybeans for delivery to unknown destinations. Of the total, 159,000 metric tons is for delivery during the 2021/2022 marketing year and 126,000 metric tons is for delivery during the 2022/2023 marketing year.
Updated
2/24/22
Soybeans
– May $15.00-$18.00
Soybeans
– November is seen in a wide $12.50-$16.00 range
Soybean
meal – May $425-$520
·
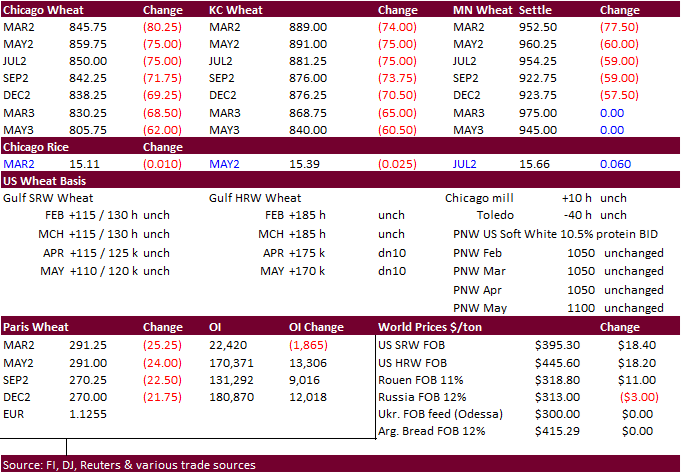
US wheat ended sharply lower. In an expanded limit session, Chicago and KC fell 65 to 75 cents. Since Chicago and KC May and July settled down 75 cents, limits expand again to $1.50/bu.
https://www.cmegroup.com/trading/price-limits.html
·
Wheat futures lost ground early on heavy investment selling ahead of the weekend. Long traders feared to carry positions over the weekend from uncertainty over the Ukraine situation. Technical selling was also a factor after
Chicago hit a 13-1/2 year high on Thursday.
·
Funds sold an estimated net 25,000 Chicago wheat contracts on Friday.
·
Ukraine ports remain closed, and several elevators shuttered operations to project their employees.
·
Egypt said they have enough wheat reserves for 4.5 months and after purchasing local wheat this season, reserves should be high enough last until the end of the year.
·
French soft wheat crop conditions were rated 93% good or excellent condition by Feb. 21, down from 95% a week earlier but above a year-ago rating of 87%.
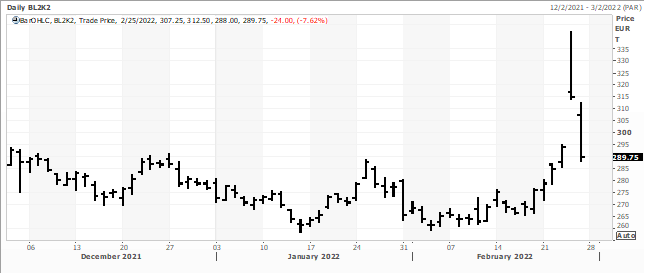
·
Paris May wheat futures filled its gap of 294.75 euros. The contract ended 24 euros or 7.6% lower at 289.75.
·
Russia’s wheat export duty will decline from $91.00/ton to $88.20/ton for the March 2-8 period, seventh consecutive weekly decline. Barley will decrease to $72.30 per ton from $73.30 and corn will rise to $52.70 per ton from
$52.20 per ton.
·
Lebanon has only one month of wheat reserves and seeks wheat from various countries. The country usually depends on Ukraine to supply around 60 percent of its wheat imports.
·
Jordan seeks 120,000 tons of wheat on March 2.
·
Turkey seeks 435,000 tons of milling wheat on March 2 for March-April shipment.
·
Jordan seeks 120,000 tons of feed barley on March 1.
Rice/Other
·
South Korea seeks 72,200 tons rice from U.S. and Vietnam on Feb. 25.
Updated
2/24/22
Chicago
May $8.00 to $10.50 range
KC
May $8.25 to $10.75 range
MN
May $9.25‐$11.50
U.S. EXPORT SALES FOR WEEK ENDING 2/17/2022
|
|
CURRENT MARKETING YEAR |
NEXT MARKETING YEAR |
||||||
|
COMMODITY |
NET SALES |
OUTSTANDING SALES |
WEEKLY EXPORTS |
ACCUMULATED EXPORTS |
NET SALES |
OUTSTANDING SALES |
||
|
CURRENT YEAR |
YEAR |
CURRENT YEAR |
YEAR |
|||||
|
|
THOUSAND METRIC TONS |
|||||||
|
WHEAT |
|
|
|
|
|
|
|
|
|
HRW |
270.4 |
1,869.7 |
1,384.2 |
226.1 |
5,367.0 |
6,535.4 |
103.5 |
171.3 |
|
SRW |
68.6 |
641.7 |
447.7 |
37.8 |
2,001.1 |
1,277.3 |
54.9 |
190.5 |
|
HRS |
99.2 |
1,050.6 |
2,021.4 |
168.2 |
3,722.2 |
5,002.5 |
10.8 |
71.8 |
|
WHITE |
77.7 |
618.3 |
2,353.8 |
77.7 |
2,541.7 |
3,887.2 |
0.0 |
67.0 |
|
DURUM |
1.0 |
19.8 |
144.2 |
36.8 |
149.9 |
517.9 |
0.0 |
47.0 |
|
TOTAL |
516.9 |
4,200.1 |
6,351.3 |
546.6 |
13,782.0 |
17,220.2 |
169.2 |
547.6 |
|
BARLEY |
0.0 |
13.8 |
11.1 |
0.0 |
14.7 |
21.3 |
0.0 |
0.0 |
|
CORN |
1,040.9 |
23,354.5 |
34,847.9 |
1,886.2 |
24,218.9 |
24,159.7 |
117.4 |
1,682.9 |
|
SORGHUM |
60.5 |
3,923.0 |
2,967.8 |
256.8 |
2,642.5 |
2,962.6 |
0.0 |
0.0 |
|
SOYBEANS |
1,232.5 |
9,284.1 |
8,292.6 |
1,260.1 |
40,025.3 |
51,445.6 |
866.5 |
5,365.8 |
|
SOY MEAL |
231.9 |
3,188.1 |
2,928.8 |
361.6 |
5,044.9 |
5,016.4 |
0.0 |
174.7 |
|
SOY OIL |
35.5 |
179.5 |
196.7 |
27.5 |
379.0 |
395.8 |
0.0 |
0.0 |
|
RICE |
|
|
|
|
|
|
|
|
|
L G RGH |
60.8 |
272.3 |
253.4 |
87.8 |
815.8 |
928.0 |
0.0 |
0.0 |
|
M S RGH |
0.0 |
9.0 |
11.4 |
0.4 |
4.6 |
17.5 |
0.0 |
0.0 |
|
L G BRN |
0.3 |
19.3 |
12.9 |
0.9 |
30.1 |
23.8 |
0.0 |
0.0 |
|
M&S BR |
0.2 |
44.1 |
97.3 |
1.2 |
41.5 |
54.5 |
0.0 |
0.0 |
|
L G MLD |
17.8 |
83.6 |
103.9 |
10.4 |
494.0 |
359.3 |
0.0 |
0.0 |
|
M S MLD |
5.1 |
168.1 |
250.6 |
16.1 |
234.0 |
306.7 |
0.0 |
0.0 |
|
TOTAL |
84.2 |
596.5 |
729.6 |
116.8 |
1,620.0 |
1,690.0 |
0.0 |
0.0 |
|
COTTON |
|
THOUSAND RUNNING BALES |
||||||
|
UPLAND |
247.2 |
7,732.7 |
5,656.2 |
376.1 |
4,848.9 |
7,752.4 |
218.2 |
2,062.6 |
|
PIMA |
4.9 |
184.5 |
275.7 |
18.0 |
223.3 |
425.1 |
0.2 |
12.8 |
This
summary is based on reports from exporters for the period February 11-17, 2022.
Wheat: Net
sales of 516,900 metric tons (MT) for 2021/2022 were up noticeably from the previous week and from the prior 4-week average. Increases primarily for Mexico (151,000 MT, including decreases of 6,500 MT), Nigeria (141,600 MT, including 30,000 MT switched from
unknown destinations and decreases of 46,000 MT), South Korea (90,000 MT), Japan (87,300 MT), and El Salvador (52,300 MT, including 12,900 MT switched from unknown destinations, 1,900 MT switched from Costa Rica, and decreases of 900 MT), were offset by reductions
primarily for unknown destinations (88,000 MT) and Peru (35,000 MT). Net sales of 169,200 MT for 2022/2023 were primarily for Nigeria (60,000 MT), El Salvador (47,000 MT), Mexico (43,100 MT), Honduras (7,000 MT), and Belize (5,000 MT). Exports of 546,600
MT were up 33 percent from the previous week and 42 percent from the prior 4-week average. The destinations were primarily to Japan (90,600 MT), Nigeria (83,600 MT), Mexico (81,000 MT), Taiwan (56,300 MT), and South Korea (55,000 MT).
Corn: Net sales of 1,040,900 MT for 2021/2022 were up
27 percent from the previous week and 4 percent from the prior 4-week average. Increases primarily for Japan (260,400 MT, including 147,900 MT switched from unknown destinations and decreases of 14,000 MT), Mexico (178,400 MT, including decreases of 42,600
MT), Colombia (127,500 MT, including decreases of 19,900 MT), Costa Rica (115,600 MT), and unknown destinations (90,600 MT), were offset by reductions for Jamaica (22,400 MT) and Guatemala (8,800 MT). Total net sales for 2022/2023 of 117,400 MT were for Japan. Exports
of 1,886,200 MT–a marketing-year high–were up 17 percent from the previous week and 41 percent from the prior 4-week average. The destinations were primarily to China (555,200 MT), Japan (388,100 MT), Mexico (351,700 MT), Canada (172,500 MT), and Guatemala
(101,200 MT).
Optional Origin Sales: For 2021/2022, the
current outstanding balance of 220,800 MT is for unknown destinations (115,000 MT), South Korea (65,000 MT), Italy (31,800 MT), and Saudi Arabia (9,000 MT). For 2022/2023, the current outstanding balance of 3,900 MT is for Italy.
Barley: No net sales or exports were reported for the
week.
Sorghum: Net sales of 60,500 MT for 2021/2022 were down
59 percent from the previous week and 65 percent from the prior 4-week average. Increases reported for China (125,500 MT, including 65,000 MT switched from unknown destinations and decreases of 16,200 MT), were offset by reductions for unknown destinations
(65,000 MT). Exports of 256,800 MT were up 81 percent from the previous week and up noticeably from the prior 4-week average. The destinations were to China (255,700 MT) and Mexico (1,100 MT).
Rice: Net sales of 84,200 MT for 2021/2022 were up noticeably
from the previous week, but down 25 percent from the prior 4-week average. Increases primarily for Mexico (53,700 MT), Haiti (15,200 MT, including decreases of 100 MT), El Salvador (6,000 MT, including 500 MT switched from Honduras), Costa Rica (5,000 MT),
and Canada (2,400 MT), were offset by reductions for Honduras (1,500 MT). Exports of 116,800 MT–a marketing-year high–were up 87 percent from the previous week and 77 percent from the prior 4-week average. The destinations were primarily to Colombia (46,000
MT), Mexico (33,200 MT), Japan (13,400 MT), Haiti (7,100 MT), and El Salvador (5,500 MT).
Exports for Own Account: For 2021/2022, new exports for
own account totaling 100 MT were to Canada. The current exports for own account outstanding balance is 100 MT, all Canada.
Soybeans: Net
sales of 1,232,500 MT for 2021/2022 were down 6 percent from the previous week and 1 percent from the prior 4-week average. Increases primarily for Egypt (379,300 MT, including 50,000 MT switched from unknown destinations, decreases of 300 MT, and 240,000
MT – late), China (291,400 MT, including 172,000 MT switched from unknown destinations and decreases of 1,100 MT), Mexico (93,900 MT, including decreases of 1,500 MT), Japan (75,800 MT, including 51,300 MT switched from unknown destinations and decreases of
2,000 MT), and Germany (68,800 MT), were offset by reductions for Nepal (100 MT). Net sales of 866,500 MT for 2022/2023 reported for China (601,000 MT), unknown destinations (192,000 MT), Mexico (47,500 MT), and Norway (31,000 MT), were offset by reductions
primarily for Taiwan (4,000 MT). Exports of 1,260,100 MT were up 8 percent from the previous week, but down 5 percent from the prior 4-week average. The destinations were primarily to China (393,000 MT), Egypt (320,300 MT), Mexico (135,400 MT), Germany (66,800
MT), and Japan (57,800 MT).
Export for Own Account: For 2021/2022, the current exports
for own account outstanding balance is 3,000 MT, all Canada.
Export Adjustment: Accumulated exports of soybeans to
the Netherlands were adjusted down 44,597 MT for week ending February 10th. The correct destination for this shipment is Germany.
Late Reporting: For
2021/2022, net sales totaling 240,000 MT of soybeans were reported late for Egypt. For 2022/2023, net sales totaling 105,000 MT of soybeans were reported
late for Egypt.
Soybean Cake and Meal: Net sales of 231,900 MT for 2021/2022
were down 17 percent from the previous week and 36 percent from the prior 4-week average. Increases primarily for the Philippines (47,300 MT), Ireland (30,000 MT), Costa Rica (26,400 MT, including decreases of 2,900 MT), Nicaragua (24,000 MT), and Mexico
(22,800 MT), were offset by reductions for Jamaica (11,500 MT), Guatemala (10,400 MT), and Belgium (3,200 MT). Exports of 361,600 MT were up 92 percent from the previous week and 35 percent from the prior 4-week average. The destinations were primarily to
the Philippines (96,200 MT), Ecuador (65,900 MT), Guatemala (40,100 MT), Colombia (39,000 MT), and Mexico (30,700 MT).
Soybean Oil: Net sales of 35,500 MT for 2021/2022 were
unchanged from the previous week, but up noticeably from the prior 4-week average. Increases primarily for India (30,000 MT switched from unknown destinations), Bangladesh (18,000 MT), Venezuela (6,500 MT), Mexico (5,200 MT), and Colombia (4,000 MT), were
offset by reductions for unknown destinations (30,000 MT). Exports of 27,500 MT were down 17 percent from the previous week, but up 14 percent from the prior 4-week average. The destinations were primarily to Inia (20,000 MT), Haiti (3,500 MT), Mexico (2,000
MT), Canada (800 MT), and Trinidad (700 MT).
Cotton: Net sales of 247,200 RB for 2021/2022 were up
56 percent from the previous week, but down 7 percent from the prior 4-week average. Increases were primarily for China (92,000 RB, including 5,400 RB – late), Pakistan (25,700 RB, including 4,400 RB – late), Turkey (24,400 RB, including decreases of 1,300
RB), Vietnam (19,700 RB, including 1,100 RB switched from Japan), and Peru (14,600 RB). Net sales of 218,200 RB for 2022/2023 were primarily for Pakistan (94,700 RB), Bangladesh (43,600 RB), Indonesia (30,800 RB), Mexico (23,600 RB), and Turkey (17,600 RB). Exports
of 376,100 RB–a marketing-year high–were up 39 percent from the previous week and 41 percent from the prior 4-week average. The destinations were primarily to China (172,400 RB, including 10,700 RB – late), Vietnam (55,500 RB), Pakistan (33,300 RB, including
2,100 RB – late), Turkey (32,800 RB, including 4,300 RB – late), and Mexico (21,700 RB). Net sales of Pima totaling 4,900 RB were up 61 percent from the previous week, but down 1 percent from the prior 4-week average. Increases were primarily for China (3,300
RB), India (800 RB), and Vietnam (400 RB). Total net sales for 2022/2023 of 200 RB were for Italy. Exports of 18,000 RB were up noticeably from the previous week and up 65 percent from the prior 4-week average. The destinations were primarily to India (10,500
RB), Peru (3,100 RB), China (1,900 RB), Vietnam (1,600 RB), and Pakistan (400 RB).
Optional Origin Sales: For 2021/2022, the current outstanding
balance of 61,600 RB is for Vietnam (52,800 RB) and Pakistan (8,800 RB).
Exports for Own Account: For 2021/2022, the current exports
for own account outstanding balance is 100 RB, all Vietnam.
Late Reporting: For
2021/2022, net sales totaling 10,200 MT of upland cotton were reported late for China (5,400 RB), Pakistan (4,400 RB), and Italy (400 RB). Exports totaling 18,100 MT of upland cotton were reported late to China (10,700 RB), Turkey (4,300 RB), Pakistan (2,100
RB), India (600 RB), and Peru (400 RB).
Hides and Skins: Net
sales of 379,700 pieces for 2022 were down 13 percent from the previous week and 18 percent from the prior 4-week average. Increases primarily for China (178,000 whole cattle hides, including decreases of 24,700 pieces), Thailand (50,400 whole cattle hides,
including decreases of 3,400 pieces), South Korea (50,000 whole cattle hides, including decreases of 1,900 pieces), Mexico (39,900 whole cattle hides, including decreases of 500 pieces), and Taiwan (27,500 whole cattle hides, including decreases of 100 pieces),
were offset by reductions for Vietnam (100 pieces). Total net sales of 2,600 kip skins, including decreases of 300 pieces, were for Belgium. Exports of 403,400 pieces were down 3 percent from the previous, but up 6 percent from the prior 4-week average. Whole
cattle hides exports were primarily to China (237,100 pieces, including 7,800 pieces – late), South Korea (60,100 pieces), Thailand (36,700 pieces), Mexico (28,500 pieces), and Taiwan (9,200 pieces). In addition, exports of 2,600 kip skins were to Belgium.
Net sales of 113,600 wet blues for 2022 were down 25 percent from the previous week and 27 percent from the prior 4-week
average. Increases primarily for Vietnam (56,900 unsplit), China (20,400 unsplit), Italy (16,000 grain splits, 2,300 unsplit, including decreases of 100 unsplit and 100 grain splits), Thailand (10,000 unsplit), and Mexico (3,400 unsplit), were offset by reductions
for Portugal (300 grain splits). Exports of 111,000 wet blues were down 34 percent from the previous week and 24 percent from the prior 4-week average. The destinations were primarily to Vietnam (37,900 unsplit and 1,300 grain splits), Italy (33,600 unsplit
and 3,000 grain splits), China (22,000 unsplit), Mexico (3,400 unsplit), and the Dominican Republic (3,200 unsplit). Net sales of 325,200 splits reported for South Korea (296,300 pounds, including decreases of 3,800 pounds) and China (44,000 pounds), were
offset by reductions for Vietnam (15,100 pounds). Exports of 364,100 pounds were to Vietnam (320,000 pounds) and China (44,100 pounds).
Late Reporting: For
2022, exports totaling 7,800 pieces of hides and skins were reported late to China.
Beef: Net sales of 14,500 MT for 2022 were down 37 percent
from the previous week and 25 percent from the prior 4-week average. Increases were primarily for Japan.
decreases of 400 MT), South Korea (2,300 MT, including decreases of 600 MT), China (1,900 MT, including decreases of 100 MT), Taiwan (1,500 MT, including decreases
of 100 MT), and Indonesia (1,000 MT). Exports of 15,300 MT were down 7 percent from the previous week and 2 percent from the prior 4-week average. The destinations were primarily to Japan (4,400 MT), South Korea (4,200 MT), China (2,200 MT), Taiwan (1,100
MT), and Mexico (1,000 MT).
Pork: Net sales of 26,600 MT for 2022 were up 45 percent
from the previous week, but down 8 percent from the prior 4-week average. Increases primarily for Mexico (12,800 MT, including decreases of 500 MT), Canada (6,700 MT, including decreases of 400 MT), Japan (3,100 MT, including decreases of 100 MT), the Dominican
Republic (1,100 MT, including decreases of 100 MT), and Honduras (900 MT), were offset by reductions for Nicaragua (100 MT). Exports of 30,200 MT were down 3 percent from the previous week and from the prior 4-week average. The destinations were primarily
to Mexico (14,000 MT), Japan (4,200 MT), China (3,700 MT), South Korea (2,700 MT), and Canada (1,400 MT).
Terry Reilly
Senior Commodity Analyst – Grain and Oilseeds
Futures International
One Lincoln Center
18 W 140 Butterfield Rd.
Oakbrook Terrace, Il. 60181
W: 312.604.1366
ICE IM:
treilly1
Skype: fi.treilly

Trading of futures, options, swaps and other derivatives is risky and is not suitable for all persons. All of these investment products are leveraged, and you can lose more than your initial deposit. Each investment product is offered
only to and from jurisdictions where solicitation and sale are lawful, and in accordance with applicable laws and regulations in such jurisdiction. The information provided here should not be relied upon as a substitute for independent research before making
your investment decisions. Futures International, LLC is merely providing this information for your general information and the information does not take into account any particular individual’s investment objectives, financial situation, or needs. All investors
should obtain advice based on their unique situation before making any investment decision. The contents of this communication and any attachments are for informational purposes only and under no circumstances should they be construed as an offer to buy or
sell, or a solicitation to buy or sell any future, option, swap or other derivative. The sources for the information and any opinions in this communication are believed to be reliable, but Futures International, LLC does not warrant or guarantee the accuracy
of such information or opinions. Futures International, LLC and its principals and employees may take positions different from any positions described in this communication. Past results are not necessarily indicative of future results.