PDF Attached
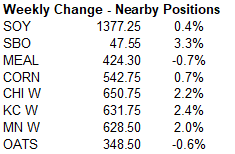
CH
settle 542.75
SH
settle 1377.25
SMH
424.30
BOH
47.55
WH
650.75
KEH
631.75
CZ
21 460 settle
SX21
1196.25
USDA
reported a bullish outlook for the 2021-22 US soybean ending stocks at 145 million bushels, IMO, and corn stocks are expected to stay near the psychological 1.55 billion bushels level while wheat stocks are expected to contract below 700 million bushels but
in our view at a comfortable level. Corn use for ethanol was projected to rebound to 5.2 billion bushels (4.950 this year) and soybean crush was estimated at a record 2.210 billion level (10 higher than 2020-21). US corn exports were projected at 2.650 billion,
50 higher than 2020-21, and soybean exports at 2.200 billion, 50 less than this year. US wheat exports were seen at 925 million vs. 985 this year. Soybean oil for biodiesel for 2021-22 estimated at 7.8 billion pounds, below 8.3 billion forecast for 2020-21.
While we see the USDA commodity outlooks as a good starting point for new-crop, supply and demand rarely comes in agreement with wheat actually happens.
See our attached forum versus actual tables.
https://www.usda.gov/oce/ag-outlook-forum
-
USDA
PROJECTS 2021/22 CORN CROP AT 15.150 BLN BUSHELS VS 14.182 BLN IN 2020/21 -
USDA
PROJECTS 2021/22 CORN YIELD AT 179.5 BUSHELS/ACRE VS 172.0 IN 2020/21 -
USDA
PROJECTS 2021/22 CORN ENDING STOCKS AT 1.552 BLN BUSHELS VS 1.502 BLN IN 2020/21 -
USDA
PROJECTS 2021/22 WHEAT CROP AT 1.827 BLN BUSHELS VS 1.826 BLN IN 2020/21 -
USDA
PROJECTS 2021/22 WHEAT ENDING STOCKS AT 698 MLN BUSHELS VS 836 MLN IN 2020/21 -
USDA
PROJECTS 2021/22 SOYBEAN CROP AT 4.525 BLN BUSHELS VS 4.135 BLN IN 2020/21 -
USDA
PROJECTS 2021/22 SOYBEAN YIELD AT 50.8 BUSHELS/ACRE VS 50.2 IN 2020/21 -
USDA
PROJECTS 2021/22 SOYBEAN ENDING STOCKS AT 145 MLN BUSHELS VS 120 MLN IN 2020/21
World
Weather Inc.
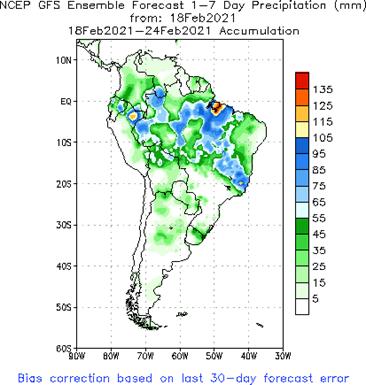
- Argentina’s
forecast is a little drier today in the second week of the forecast - The
loss of rainfall in the first week of March, if it verifies, raises the potential for greater crop stress that might pose a threat to last season yields and crop quality - Totally
dry weather is not expected and both the GFS and European model runs have a trough of low pressure moving into Argentina during the first days of March - This
event still has potential to produce some important rainfall and needs to be closely monitored - World
Weather, Inc. still believes that “some” rain will fall during that week and there is potential for just enough to fall to squelch to building crop stress that is expected prior to that time - Follow
up rain will still be imperative - A
general soaking does not look very plausible, but “some” short term relief cannot be ruled out yet - Argentina’s
hotter temperatures and restricted rainfall next week will accelerate drying and crop moisture stress will be on the rise, but subsoil moisture should carry many crops through the week without production losses - The
exception will be in the already dry areas of La Pampa, western Buenos Aires and in central Chaco - Central
Santa Fe and Entre Rios will be drying out soon, too, but Cordoba received some rain overnight that was beneficial in slowing the recent drying trend - Cordoba
rainfall overnight ranged from 0.05 to 0.75 inch with a few northwestern amounts over 1.00 inch; coverage was close to 100% - Brazil
weather may be more favorable than detrimental during the coming week depending on location - Many
areas from southern Mato Grosso through Mato Grosso do Sul and southwestern Sao Paulo to Rio Grande do Sul and Paraguay will experience restricted rainfall
- The
environment will be nearly ideal for soybean maturation and harvesting as well as Safrinha corn planting
- Sufficient
subsoil moisture will be present to carry on normal crop development for full season and late soybean crops as well as second season corn.
- Rain
frequency will be high in northern and eastern Mato Grosso, Goias, Minas Gerais and Tocantins - This
will keep soybean maturation and harvest progress slow as well as the advancement of Safrinha crops, but some progress is expected around the rainfall - Some
days will be wetter than others - The
situation will not be ideal and ongoing concern for crops in these areas will continue - Bitter
cold still occurred in parts of the U.S. Plains and western Midwest this morning, but readings were not as cold as earlier this week - Warming
in the United States and Canada’s Prairies will restore more normal temperatures in the coming week
- This
will restore more normal energy consumption rates after recently shortages of natural gas and other heating fuels - U.S.
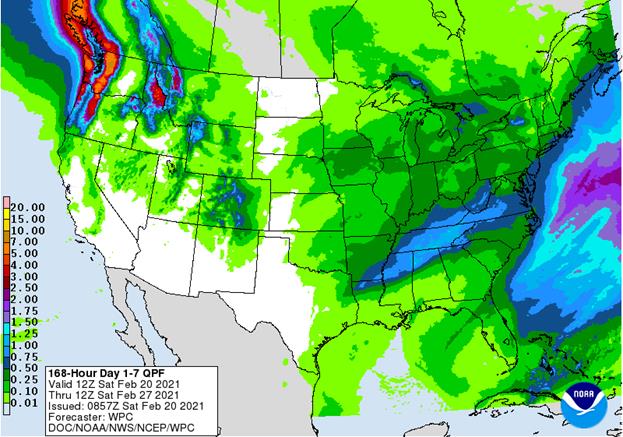
weather will remain active - Snow
and rain will move across the Midwest Sunday into Monday reaching the northeastern and middle Atlantic States with snow and rain Monday - The
next larger storm system will be in the lower Midwest and impact a part of the Delta Thursday before reaching the middle Atlantic Coast region Friday, Feb. 26 - Another
large storm system may evolve in the Midwest and impact a part of the eastern Plains, Delta and Atlantic Coast States Feb. 28-March 2 - Drier
weather may occur for a little while following the Feb. 28-Mar. 2 event - South
Africa will experience net drying through Saturday, but timely rain will fall in many areas next week maintaining a very good production outlook - Recent
rain in eastern Australia cotton and sorghum production areas has been ideal for supporting crops
- Alternating
periods of rain and sunshine will resume in the coming week and continue into early March - China
winter crop conditions are rated quite favorably - Wheat
is dormant in most of the nation, but was well established last autumn and soil moisture is favorable for this time of year - Rapeseed
is breaking dormancy in the south and has abundant soil moisture - Plant
development will be slow over the next couple of weeks - Soil
moisture will remain abundant - India
rainfall this week was sporadic and a little too light for a serious improvement to winter crop conditions - Some
pockets of short term benefit was noted - Some
showers will linger in the south into Saturday and then drying is expected for at least week and probably ten days - Rain
is still needed in the north and west and more precipitation will still be desirable in other areas that did get some rain this week - The
nation’s winter crops should yield well this year, although perhaps not quite as good as last year in some areas because of more limited rain - Warming
is expected next week and early March could become quite warm to hot in some areas. - Snow
cover in eastern Europe and the western CIS is more than sufficient to protect winter crops from adverse weather - Very
little winterkill has occurred this year - Bitter
cold will remain over Russia’s New Lands in the coming ten days - No
snow free area in southern Russia or Europe will be subjected to any threatening weather - Europe
weather is expected to quiet for a while – at least in the heart of the continent - The
more limited precipitation bias will be great for runoff to continue which will eventually reduce the risk of more serious flooding - Western
parts of the United Kingdom, western Norway and northwestern Spain will continue to see bouts of heavy rainfall resulting in some flooding in those areas - Winter
crops are still dormant in most of the continent and rated favorably - Morocco
and northwestern Algeria will receive some needed moisture this weekend into early next week and possibly again late next week - The
precipitation will help ease dryness in southwestern Morocco and northwestern Algeria while maintaining good crop and field conditions in north-central Morocco - Routinely
occurring rain is expected in the Middle East wheat and cotton production areas improving soil moisture for some of the drier areas in Iran and Afghanistan and maintaining good moisture in Turkey, Syria and Iraq - Southern
Ghana and Ivory Coast received additional Wednesday - Some
flowering might have occurred since some of this region reported rain Tuesday as well - Greater
and more uniform rain is needed to induce a more generalized bout of flowering in coffee and cocoa areas, but the showers occurring now are not unusual for February and should increase next month - Other
areas in west-central Africa will see most of this week’s rain occurring near the coast - Southeast
Asia weather is not likely to change much in the coming week, although some additional heavy rain will overtake much of the Philippines this weekend into early next week causing some local flooding - Tropical
Storm Dujuan will move across the heart of the Philippines this weekend producing moderate to strong wind speeds and excessive rain in some areas - Flooding
is the greatest risk with northeastern Mindanao and the Visayan Islands most impacted - Tropical
Storm Guambe was located off the lower Mozambique coast this morning and has already produced significant rain in parts of that country this week - The
storm will move southerly this weekend and then turn to the southeast away from southern Africa - No
more crop damaging weather is expected in any part of southern Africa or Madagascar - East-central
Africa precipitation over the next ten days will be most significant in Tanzania and lightest in Ethiopia - All
of the rain will be welcome and beneficial - Southern
Oscillation Index today was +13.34 today and the index will rise for a while this weekend and then may weaken again next week.
- Mexico
precipitation in the coming week will be mostly confined to the east coast. although a few showers may occur briefly in the far north too - Central
America precipitation will continue greatest along the Caribbean Coast and in Guatemala while the Pacific Coast is relatively dry - Canada
Prairies will experience warmer temperatures over the next several days with readings becoming much closer to normal if not slightly warmer than usual - Precipitation
will continue limited - Cooling
is expected again in the first week of March - Southeast
Canada will experience near normal amounts of precipitation in the coming week while temperatures are seasonable.
Source:
World Weather Inc. and FI
Monday,
Feb 22:
- USDA
Export Inspections – corn, soybeans, wheat, 11am - EU
weekly grain, oilseed import and export data - MARS
crop bulletin - Ivory
Coast cocoa arrivals - EARNINGS:
Wilmar - HOLIDAY:
Russia
Tuesday,
Feb 23:
- USDA
Milk production, 3pm - U.S.
pork, beef, poultry cold storage data, 3pm - U.K.
National Farmers Union virtual annual conference to discuss the future of agriculture, horticulture - EARNINGS:
IOI Corp. - HOLIDAYS:
Japan, Russia
Wednesday,
Feb 24:
- EIA
weekly U.S. ethanol inventories, production - Amsterdam
sustainable cocoa conference (Feb 24-26) - U.S.
poultry slaughter, 3pm - MPOB
palm oil prices seminar
Thursday,
Feb 25:
- USDA
weekly crop net-export sales for corn, soybeans, wheat, cotton, pork, beef, 8:30am - Port
of Rouen data on French grain exports - International
Grains Council monthly report - Malaysia’s
Feb. 1-25 palm oil export data - USDA
red meat production, 3pm - EARNINGS:
Minerva, BRF, FGV (tentative), Golden Agri
Friday,
Feb 26:
- ICE
Futures Europe weekly commitments of traders report, 1:30pm (6:30pm London) - CFTC
commitments of traders weekly report on positions for various U.S. futures and options, 3:30pm - U.S.
agricultural prices paid, received, 3pm - Earnings:
Olam - HOLIDAY:
Thailand
Friday
night data:

USDA
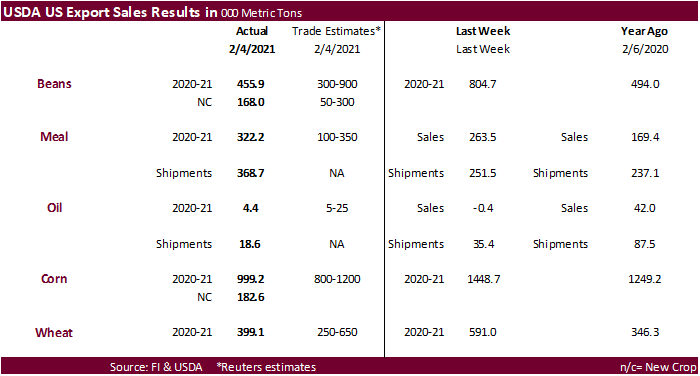
Export Sales
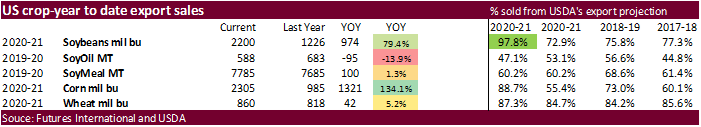
were within expectations for soybeans and meal and below for soybean oil. China bought a new-crop soybean cargo. Soybean meal shipments were good and a marketing-year high with destinations primarily to Colombia (62,400 MT), the Philippines (50,800 MT),
Vietnam (48,600 MT), Italy (46,300 MT), and Denmark (33,000 MT). USDA sales for corn of 999,200 tons for this crop year and 182,600 tons for new crop were within expectations. Mexico and Costa Rica were largest countries for 2020-21 and 2021-22. Sorghum
and barley sales were minimal. Pork sales were 33,300 tons and included only 2,500 tons for China. All wheat export sales were within expectations and included China for 131,700 tons.
CFTC
Commitment of Traders Report


SUPPLEMENTAL
Non-Comm Indexes Comm
Net Chg Net Chg Net Chg
Corn
385,994 -558 402,076 6,934 -771,164 214
Soybeans
141,925 -16,516 161,820 7,539 -301,165 15,656
Soyoil
75,717 1,918 129,894 -2,830 -228,571 540
CBOT
wheat -5,168 2,445 149,601 6,586 -132,604 -7,763
KCBT
wheat 32,203 -2,719 68,236 1,554 -102,639 1,221
=================================================================================
FUTURES
+ OPTS Managed Swaps Producer
Net Chg Net Chg Net Chg
Corn
365,785 6,978 260,761 3,395 -760,426 947
Soybeans
161,410 -10,361 67,248 -850 -268,746 24,441
Soymeal
69,422 -203 69,583 1,882 -184,913 7,129
Soyoil
110,396 4 91,875 2,278 -240,238 -4,725
CBOT
wheat 21,285 1,979 89,750 3,065 -114,235 -5,561
KCBT
wheat 57,133 -2,958 42,970 881 -97,372 1,137
MGEX
wheat 12,212 -721 3,700 -105 -20,581 1,233
———- ———- ———- ———- ———- ———-
Total
wheat 90,630 -1,700 136,420 3,841 -232,188 -3,191
Live
cattle 92,088 5,478 83,332 692 -180,814 -5,182
Feeder
cattle 1,516 181 7,781 28 -2,093 -60
Lean
hogs 67,187 11,011 55,227 2,444 -119,303 -13,861
Other NonReport Open
Net Chg Net Chg Interest Chg
Corn
150,785 -4,730 -16,905 -6,591 2,664,969 -28,418
Soybeans
42,668 -6,552 -2,579 -6,680 1,294,632 -27,292
Soymeal
15,210 -2,455 30,696 -6,352 497,653 -60
Soyoil
15,006 2,072 22,961 371 626,841 25,429
CBOT
wheat 15,029 1,786 -11,829 -1,268 561,553 3,645
KCBT
wheat -4,931 996 2,200 -57 251,963 3,123
MGEX
wheat 665 -1,117 4,004 709 93,707 -1,112
———- ———- ———- ———- ———- ———-
Total
wheat 10,763 1,665 -5,625 -616 907,223 5,656
Live
cattle 24,566 -35 -19,173 -953 382,093 9,271
Feeder
cattle 2,685 123 -9,889 -272 47,635 1,673
Lean
hogs 8,530 962 -11,641 -556 298,009 9,876
=================================================================================
US
Existing Home Sales Change Jan: 6.69M (est 6.60M; prev R 6.75M)
–
Existing Home Sales (M/M) Jan: 0.6% (est -2.40%; prev R 0.9%)
US
Markit Manufacturing PMI Feb P: 58.5 (est 58.5; prev 59.2)
–
Markit Services PMI Feb P: 58.9 (est 57.6; prev 58.3)
–
Markit Composite PMI Feb P: 58.8 (prev 58.7)
Canadian
Retail Sales (M/M) Dec: -3.4% (exp -2.6%; prev 1.3%)
–
Retail Sales Ex-Auto (M/M) Dec: -4.1% (exp -2.4%; prev 2.1%)
Corn.
-
March
corn saw sell stops after trading below $5.47. The weakness could have been blamed for soybean/corn spreading, risk off post USDA agriculture forum S&D’s lack of China corn commitments reported in the weekly USDA sales report, and lack of global export developments
this week. The talk Friday for US corn revolved on current and new-crop US exports, although USDA penciled in a high US corn yield. Yields can make or break the 2021-22 US balance sheet, so spring weather will be very important to watch over the medium term.
Long term the focus should be on US corn exports. Corn US 2021-22 ending stocks, for now, are thought to remain snug and expectations for China to start taking millions of tons of US corn they booked in recent months.
-
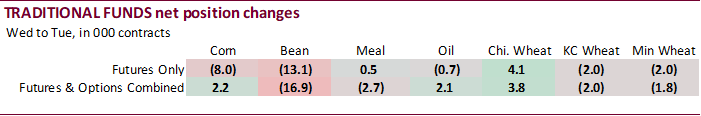
Funds
sold an estimated net 17,000 contracts. -
USDA
sales for corn of 999,200 tons for this crop year and 182,600 tons for new crop were within expectations. Mexico and Costa Rica were largest countries for 2020-21 and 2021-22. Sorghum and barley sales were minimal. Pork sales were 33,300 tons and included
only 2,500 tons for China. -
Mexico
said they are going ahead with their plan to phase out GMO corn. -
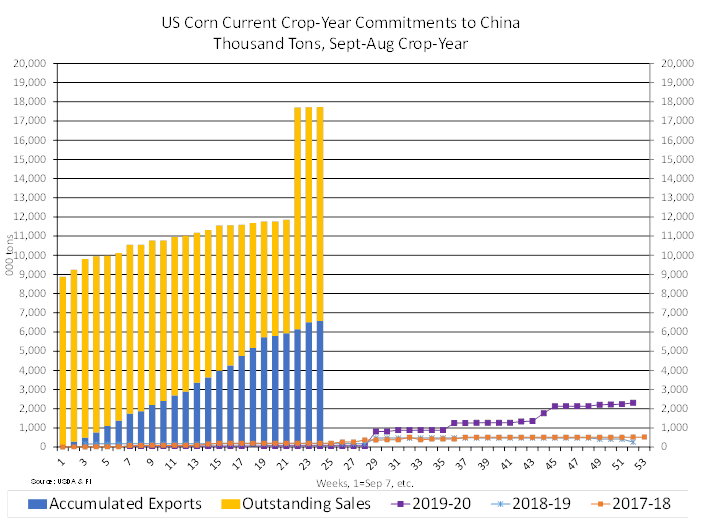
There
was some talk China may roll some of their US corn commitments into new-crop. There are 6.5 million tons (MMT) accumulated (shipped) and 11.1MMT outstanding. China US corn commitments (17.7MMT) make up 30 percent of the total US commitments (58.6MMT). Unknown
makes up 7.9MMT, 14 percent of total. Adding China and Unknown, that is 25.6MMT, 44 percent of total US commitments.
-
CBOT
corn open interest was up about 14,500 contracts on Friday. -
Ukraine’s
grain exports fell 20.8% to 30.87 million tons so far this season. Traders sold 13.31 million tons of wheat, 13.08 million tons of corn and 3.96 million tons of barley. -
Ukraine
last half shipping lineup shows 1.4 million tons of corn, mostly for China, according to AgriCensus. They exported 621,000 tons over the last week despite talk of shipping delays, that is steady from previous week. -
Russia
reported seven workers at a poultry plant in its south had been infected with a bird flu virus. -
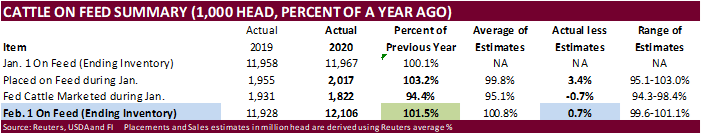
Cattle
on Feed as of February 1 was 0.7 percentage point above trade expectations and placements were also higher than expectations.
EIA:
Today in Energy: Extreme winter weather is disrupting energy supply and demand, particularly in Texas
https://www.eia.gov/todayinenergy/detail.php?id=46836&src=email
Corn
Export Developments
Updated
2/10/21
March
corn is seen trading in a $5.20 and $6.00 range
May
corn is seen in a $5.15 and $6.00 range.
July
is seen in a $5.00 and $6.00 range.
December
corn is seen in a $3.75-$5.50 range.