PDF Attached
![]()
Weather
U.S.
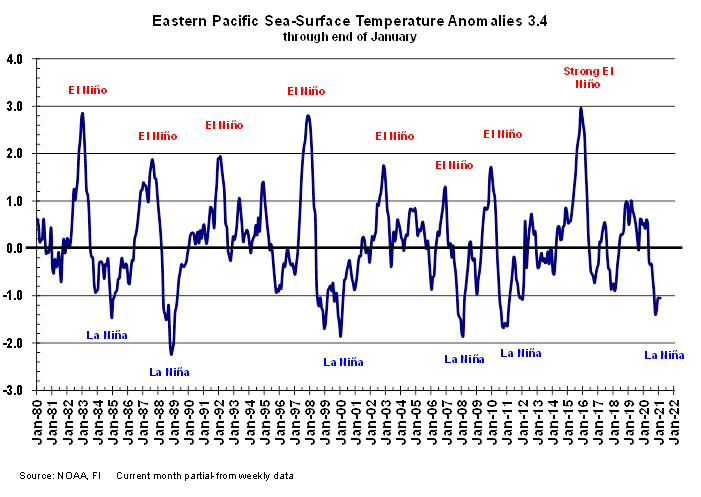
CPC: 60% change of a transition from LA NIÑA to neutral ENSO during Northern Hemisphere spring 2020 (APRIL-JUNE).
MARKET
WEATHER MENTALITY FOR CORN AND SOYBEANS:
Market
worry over Brazil harvest weather for soybeans and planting progress for Safrinha corn will continue, although the past week has been ideal in firming up the topsoil and supporting faster fieldwork. Expected rain over this coming week will disrupt fieldwork,
but it will not likely bring all field operations to a halt. Northern Mato Grosso may have the biggest problem with rain delays, although some will occur in other areas, as well. Brazil’s farmers are used to harvesting in less than ideal conditions and progress
should advance.
In
Argentina, weather conditions are expected to be mixed with areas of drying from the southwest into central parts of the nation that may eventually raise a few flags, but there is still time for the outlook to change as crops thrive on favorable subsoil moisture
outside of southern La Pampa and southwestern Buenos Aires where conditions are already too dry.
South
Africa production remains good with little change likely. Recent rain in New South Wales has been good for summer crop development, But Queensland needs greater rain.
Weather
in rapeseed areas of China remains favorable and the same is true for India, although greater rain might be good for all of its winter crop areas this month.
Winter
crops in Europe are plenty wet and cold with little change likely for a while. No harm to crops in the continent will occur anytime soon. That is true for Ukraine crops as well. There is a rising potential for flooding in far western Europe, northwestern and
west-central Russia and in western and north-central Ukraine this spring because of wet soil and deep snow cover outside of Western Europe.
Overall,
weather today will continue to maintain a floor of support for the market’s bullishness, but caution is still warranted because the perception of what is happening in Brazil may be a little skewed from reality.
MARKET
WEATHER MENTALITY FOR WHEAT: Most of the wheat production losses in the northern U.S. Plains from recent bitter cold should be low from a national perspective, but locally farmers will not be pleased. Damage in Canada was even less of an impact on its winter
grain crop, but some loss is expected there as well.
U.S.
hard red winter wheat and soft red wheat in the Midwest will not be negatively impacted by bitter cold this week due to adequate snow cover even though snow cover is not very good today in the west-central high Plains.
No
crop damage has occurred in Europe or the western CIS so far this season and this week will likely maintain a mostly good environment for crops with snow cover to adequately protect wheat, barley and rye from permanent damage because of bitter cold temperatures.
Wheat conditions in China remain very good and that of India are fair to good. Rain is needed in most of India to induce better yield potentials, although the nation is still expecting a fair-sized crop. Some moisture will occur in central India next week.
North
Africa wheat is drying out except in north-central Morocco where conditions have been ideal. Drought has already cut into southwestern Morocco production and the same may occur in northwestern Algeria if spring rainfall is not very good.
Middle
East precipitation has been erratic and often light this winter and a boost in precipitation would be welcome especially from Iraq to Afghanistan. Turkey precipitation has been better distributed than in most other areas.
Overall, weather today will likely produce a mixed influence on market mentality.
Source:
World Weather Inc. and FI
USDA’s
annual Ag Outlook Forum
is next week: https://www.usda.gov/oce/ag-outlook-forum
Bloomberg
Ag Calendar
Thursday,
Feb 11:
- USDA
weekly crop net-export sales for corn, soybeans, wheat, cotton, pork, beef, 8:30am - Conab’s
data on yield, area and output of corn and soybeans in Brazil - Russian
consultant IKAR holds agricultural conference, day 1 - Port
of Rouen data on French grain exports - HOLIDAY:
China, Japan, South Korea, Vietnam
Friday,
Feb 12:
- ICE
Futures Europe weekly commitments of traders report, 1:30pm (6:30pm London) - CFTC
commitments of traders weekly report on positions for various U.S. futures and options, 3:30pm - Russian
consultant IKAR holds agricultural conference, day 2 - New
Zealand Food Prices - HOLIDAY:
China, Hong Kong, Indonesia, Malaysia, South Korea, Singapore, Vietnam, Thailand, Philippines
Source:
Bloomberg and FI
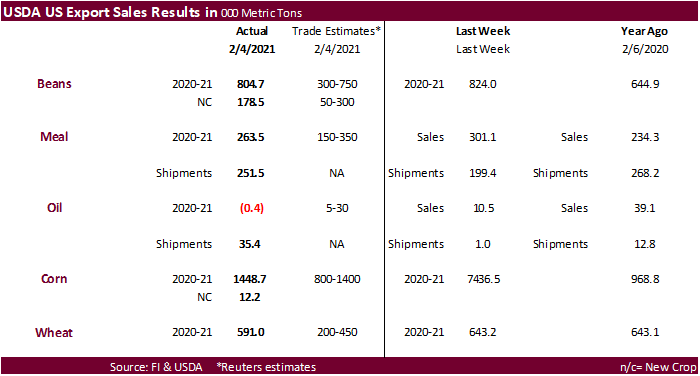
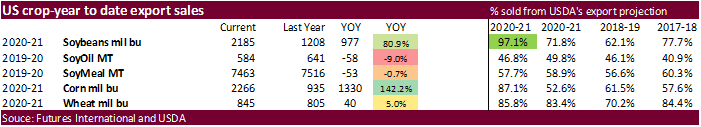
USDA
export sales
were better than expected to corn, wheat, old crop soybeans. Soybean meal sales and shipments were ok. Soybean oil sales showed a small net reduction, but shipments were good. China bought 110,000 tons of sorghum. China was not a large buyer, if any, for
corn and wheat. For soybeans, increases primarily for China (517,000 MT, including 198,000 MT switched from unknown destinations, decreases of 9,500 MT, and 296,000 MT late). Pork sales of 36,900 tons included 9,700 for China (includes 1,200 decrease).
Thursday,
Feb 11:
- USDA
weekly crop net-export sales for corn, soybeans, wheat, cotton, pork, beef, 8:30am - Conab’s
data on yield, area and output of corn and soybeans in Brazil - Russian
consultant IKAR holds agricultural conference, day 1 - Port
of Rouen data on French grain exports - HOLIDAY:
China, Japan, South Korea, Vietnam
Friday,
Feb 12:
- ICE
Futures Europe weekly commitments of traders report, 1:30pm (6:30pm London) - CFTC
commitments of traders weekly report on positions for various U.S. futures and options, 3:30pm - Russian
consultant IKAR holds agricultural conference, day 2 - New
Zealand Food Prices - HOLIDAY:
China, Hong Kong, Indonesia, Malaysia, South Korea, Singapore, Vietnam, Thailand, Philippines
Source:
Bloomberg and FI
US
Initial Jobless Claims (Feb 6) 793K (est 760K; prevR 812K; prev 779K)
–
US Continuing Claims (Jan 30) 4.545 Mln (est 4.420 Mln; prevR 4.690 Mln; prev 4.592 Mln)
Euro
Zone Growth In 2021 To Rebound Less Than Expected
Corn.
-
Corn
futures appreciated on bottom picking (after a two-day decline) and higher soybean meal. Better than expected USDA export sales added to the positive undertone. China was not a large buyer of corn last week, but they picked up a couple cargoes of sorghum.
China is officially on holiday. -
Note
USDA is due out with commodity outlooks for the US 2021-22 supply and demand a week from Friday. There are some in the camp that USDA may unveil a 94 million US corn planted area. An area reported above 92.5 million could be negative for new-crop December
corn futures, based on our observations of selected estimates released in recent months.
-
Datagro
reported Brazil producers sold 60.4 percent of their 2020-21 soybean crop versus 40.8 percent average, and 9.4 percent of 2021-22 versus 2.3 percent average.
-
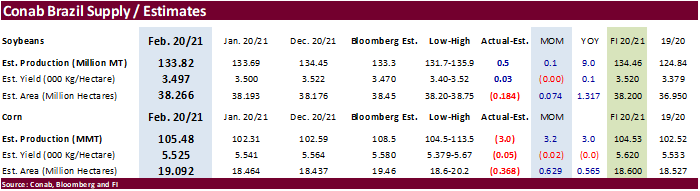
Conab
updated their Brazilian corn and soybean supply and both were revised up from the previous month. The corn production was taken up 3.2 million tons in part to a 629,000 hectare increase in the area, a surprise to us as we thought Conab would start factoring
in potential area loss for the second crop amid delays in soybean harvest. They also cited improving rains in late December through January. Yet, the corn crop still came in 3 million tons below trade expectations. The first crop was projected at 23.629
million tons and second crop at 80.077 million tons. -
Conab
estimated the Brazil total grain crop was seen at 268.3 million tons, up from 264.8 million tons in Jan and above 257 million tons in 2019-20.
-
Rosario
grains exchange raised its forecast for the 2020-21 Argentina soybean harvest to 49 million tons, versus 47 million previously, and for corn to 48.5 million tons from 46 million, due to recent rains improving conditions. USDA is at 48.0 million tons for soybeans
and 47.5 million tons for corn. We are hearing traders are more inline with 45 to 47 corn and 46 to 48 soybeans.
-
Argentina
decided not to raise export taxes on grains, according to the president of Confederaciones Rurales Argentinas (CRA).
-
AgriCensus
noted with the recent decline in Argentina corn premiums, importers have shifted interest from the US to Argentina, ahead of harvest season.
-
South
Africa’s CEC estimated final 2020 corn production at 15.300 million tons (last 15.408), up from 11.275 million tons in 2019. White corn was pegged at 8.548 million tons and yellow at 6.753 million tons.
-
Goldman
roll – day 5.
Corn
Export Developments
-
Turkey’s
TMO bought about 235,000 tons of optional origin corn for Feb 19-Mar 15 shipment. Lowest price was estimated to be $269 a ton c&f.
Updated
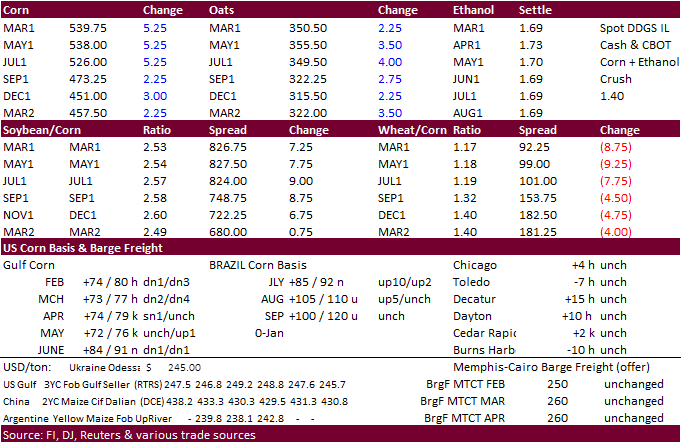
2/10/21
March
corn is seen trading in a $5.20 and $6.00 range
May
corn is seen in a $5.15 and $6.00 range.
July
is seen in a $5.00 and $6.00 range.
December
corn is seen in a $3.75-$5.50 range.