CME
Margins update on Corn and Wheat.
https://www.cmegroup.com/notices/clearing/2021/02/Chadv21-050.html
Today
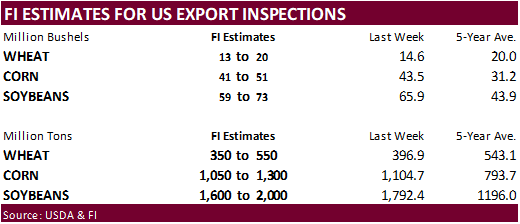
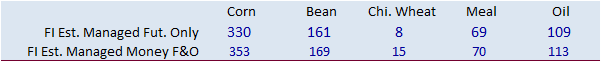
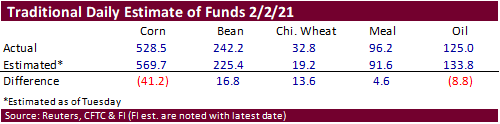
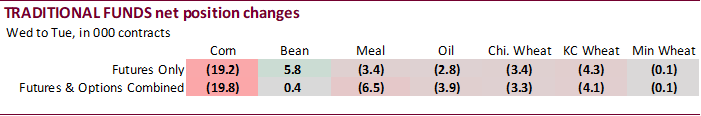
we saw positioning in futures and options ahead of the Tuesday USDA report.
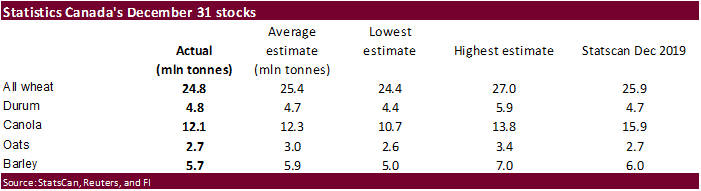
StatsCan
updated Dec stocks and Farm Futures released US 2021 acreage.
U.S.
2021 SOYBEAN PLANTINGS SEEN AT 84.5 MILLION ACRES, UP 1.7% FROM 2020 -SURVEY
U.S.
TOTAL WHEAT AREA PLANTED FOR 2021 HARVEST SEEN AT 46.4 MILLION ACRES -SURVEY
U.S.
2021 SPRING WHEAT PLANTINGS SEEN AT 12.6 MILLION ACRES -SURVEY
ESTIMATES
BASED ON A SURVEY OF 806 FARMERS DURING JANUARY 2021 -FARM FUTURES
U.S.
WINTER WHEAT PLANTINGS FOR 2021 HARVEST SEEN AT 32.4 MILLION ACRES -SURVEY
U.S.
2021 CORN PLANTINGS SEEN AT 94.7 MILLION ACRES, UP 4% FROM 2020 -FARM FUTURES SURVEY
MARKET
WEATHER MENTALITY FOR CORN AND SOYBEANS:
Market
worry over heavy rainfall in northern and eastern Mato Grosso, Goias and Minas Gerais will influence today’s trade while some forecasters believe the drier GFS model run for Argentina is a concern with net drying during the next ten days. Despite the heavier
rainfall outlook in Brazil, Minas Gerais is not a strong contributor to soybean production – at least not in the areas expecting heavy rain. Parts of Mato Grosso will also get some periods of sunshine limiting the greatest rain delays to the north. Argentina’s
drying will be hindered by some periodic rainfall reducing the level of concern over its weather for now, but net drying is expected in portions of the nation.
South
Africa summer crop conditions remain very good with little change likely, despite drying in the west.
Australia’s
dryland sorghum and other crops would benefit from more routine rainfall, especially in Queensland, but that is not likely for a while. Recent rainfall in Australia has been very good for crops in New South Wales
India winter crops are beginning to reproduce, and timely rain is needed to support the best possible yields. Rain this week failed to have much impact on crops other than wheat. Crop conditions are rated favorably, though, and more precipitation is needed
to get the best yields.
China
and Europe crops are mostly dormant and will remain in favorable condition for the next few weeks. Western Europe has become a little too wet and recent flooding has damaged some crops in a part of France, the United Kingdom and a few other random locations.
Overall, weather today will likely provide a neutral to slightly bearish bias to market mentality.
MARKET
WEATHER MENTALITY FOR WHEAT: Concern remains over snow free areas in southwestern Canada’s Prairies and the northwestern and west-central U.S. Plains as colder air settles into those areas for a while through next week. Snow should precede the coldest conditions
to adequately protect dormant winter crops from winterkill. However, there is some potential that the depths of snow in minor production areas of Saskatchewan, northeastern Montana and parts of North Dakota that a little damage may still occur because of the
intensity of the cold expected.
Snow
cover in northern Russia and northeastern Europe is sufficient to support crop needs during the colder periods that may evolve over the next week and deeper into February. Snow free areas in southern Europe, Ukraine and Russia’s Southern Region should not
be threatened by damaging cold weather in the next week.
China,
India and Europe winter crops are in mostly good condition. Rain is needed in India during reproduction in February and a close watch on rain potentials is warranted over the next few weeks. Showers later this week over the next few days in the far north and
extreme east will be welcome, but greater volumes of rain will still be desired.
Morocco
rain expected into the weekend will improve topsoil moisture for better wheat development potential in the spring. However, drought during the planting season may have permanently cut production in a small part of the nation. A boost in precipitation is still
needed across all other areas in northern Africa, but no area is drier than southwestern Morocco.
Recent
increases in Middle East rainfall has improved field condition so that some improvement in crop conditions may follow.
Overall,
weather today will likely provide a mixed influence on market mentality.
Source:
World Weather Inc. and FI
Friday,
Feb 5:
- US
Trade Balance - Statcan
reports on wheat, soy, durum, canola and barley stockpiles in Canada - ICE
Futures Europe weekly commitments of traders report, 1:30pm (6:30pm London) - CFTC
commitments of traders weekly report on positions for various U.S. futures and options, 3:30pm - China’s
CNGOIC to publish soybean and corn reports
Monday,
Feb 8:
- USDA
weekly corn, soybean, wheat export inspections, 11am - EU
weekly grain, oilseed import and export data - Ivory
Coast cocoa arrivals - HOLIDAY:
New Zealand
Tuesday,
Feb 9:
- USDA’s
monthly World Agricultural Supply and Demand (WASDE) report, noon - (CASDE
?) - France
agriculture ministry updates 2021 winter-crop planting estimates
Wednesday,
Feb 10:
- EIA
weekly U.S. ethanol inventories, production, 10:30am - Malaysian
Palm Oil Board data on January palm oil end- stocks, output, exports - Malaysia
Feb. 1-10 palm oil export data from AmSpec, Intertek, SGS - FranceAgriMer
monthly grains report - HOLIDAY:
Vietnam
Thursday,
Feb 11:
- USDA
weekly crop net-export sales for corn, soybeans, wheat, cotton, pork, beef, 8:30am - Conab’s
data on yield, area and output of corn and soybeans in Brazil - Russian
consultant IKAR holds agricultural conference, day 1 - Port
of Rouen data on French grain exports - HOLIDAY:
China, Japan, South Korea, Vietnam
Friday,
Feb 12:
- ICE
Futures Europe weekly commitments of traders report, 1:30pm (6:30pm London) - CFTC
commitments of traders weekly report on positions for various U.S. futures and options, 3:30pm - Russian
consultant IKAR holds agricultural conference, day 2 - New
Zealand Food Prices - HOLIDAY:
China, Hong Kong, Indonesia, Malaysia, South Korea, Singapore, Vietnam, Thailand, Philippines

DJ
U.S. December Oilseed, Meal, Oils/Fats Exports-Feb 5
In kilograms (top). Oils in pounds, soybeans in bushels, meal and hulls in
short
tons (bottom). Source: U.S. Department of Commerce.
(*)NOTE:
Year ago figures reflect data reported at that time.
Data
includes Exports and Re-Exports.
——-
In Kilograms ——-
Dec
20 Nov 20 Oct 20 Dec 19
soybeans
10,820,020,482 11,097,069,577 11,440,989,450 5,570,376,324
soyoil
106,992,728 80,482,097 83,488,895 83,597,599
crude
94,399,409 64,992,262 63,536,922 63,337,525
refined
110,508 33,439 93,835 26,618
other/1
12,142,760 14,408,894 19,224,056 20,064,091
hydrogenated
340,051 1,047,502 634,082 169,365
cottonseed
oil 2,161,444 2,675,188 2,875,704 2,995,985
crude
28,705 411,734 330,423 436,031
refined
1,118,492 658,408 995,576 1,175,021
other/1
1,014,247 1,605,046 1,549,705 1,360,432
hydrogenated
0 0 0 24,501
sunseeds
187,474 0 33,676 95,844
sunseed
oil 5,603,740 8,249,661 5,127,210 3,547,768
rapeseed
9,987,675 8,721,630 17,393,087 16,936,345
rapeseed
oil 13,227,527 12,597,182 11,087,306 10,661,340
crude
3,802,519 4,799,782 1,875,060 6,671,711
refined
9,425,008 7,797,400 9,212,246 3,989,629
linseed
meal 77,160 114,403 229,637 150,303
cottonseed
meal 5,458,046 3,200,590 5,693,282 7,004,919
soymeal
995,011,053 931,837,888 723,180,855 787,612,454
soymeal/flour
301,881,926 221,480,062 260,051,635 219,553,686
soymeal
hulls 10,218,000 17,403,000 12,755,000 9,703,000
lard
2,117,795 1,500,580 1,320,838 2,193,897
edible
tallow 8,771,765 7,906,506 6,972,105 11,565,601
inedible
tallow 27,827,752 22,386,373 20,796,267 38,124,785
ch
white grease 0 700,000 0 36,421
——-
In Bushels, Pounds or Short Tons ——-
Dec
20 Nov 20 Oct 20 Dec 19
soybeans
397,563,616 407,743,323 420,380,085 204,674,192
soyoil
235,878,629 177,432,682 184,061,538 184,301,190
crude
208,115,108 143,283,436 140,074,960 139,635,364
refined
243,628 73,720 206,871 58,683
other/1
26,770,208 31,766,179 42,381,796 44,233,756
hydrogenated
749,684 2,309,347 1,397,912 373,386
cottonseed
oil 4,765,169 5,897,781 6,339,843 6,605,017
crude
63,284 907,718 728,458 961,284
refined
2,465,853 1,451,541 2,194,870 2,590,478
other/1
2,236,032 3,538,521 3,416,515 2,999,240
hydrogenated
0 0 0 54,015
sunseeds
413,309 0 74,243 211,300
sunseed
oil 12,354,134 18,187,392 11,303,565 7,821,491
rapeseed
22,019,058 19,227,906 38,345,200 37,338,256
rapeseed
oil 29,161,710 27,772,037 24,443,330 23,504,235
crude
8,383,121 10,581,710 4,133,800 14,708,608
refined
20,778,589 17,190,327 20,309,529 8,795,628
linseed
meal 85 126 253 166
cottonseed
meal 6,016 3,528 6,276 7,722
soymeal
1,096,801 1,027,165 797,162 868,185
soymeal
flour/me 332,764 244,137 286,655 242,014
soymeal
hulls 11,263 19,183 14,060 10,696
lard
4,668,940 3,308,213 2,911,950 4,836,716
edible
tallow 19,338,435 17,430,865 15,370,863 25,497,790
inedible
tallow 61,349,702 49,353,513 45,847,929 84,050,778
ch
white grease 0 1,543,236 0 80,295
Write
to Rodney Christian at csstat@dowjones.com
Dow
Jones Newswires
DJ
U.S. December Grain Exports-Feb 5
In kilograms (top) and in bushels (bottom), except flour in cwt and malt
in
pounds. /1 denotes includes commercial and donated. Source: U.S. Department
of
Commerce.
(*)NOTE:
Year ago figures reflect data reported at that time.
Data
includes Exports and Re-Exports.
——-
In Kilograms ——-
Dec
20 Nov 20 Oct 20 Dec 19
Barley
3,319,744 3,609,389 2,121,000 3,549,000
Corn
/1 4,617,553,000 3,822,421,000 3,683,901,000 2,508,110,000
Sorghum
854,186,000 877,546,000 247,041,000 429,017,000
Oats
2,336,347 1,559,124 2,800,797 2,108,645
Rye
0 157,300 4,444 191,000
Wheat
/1 1,957,333,746 1,893,240,216 1,741,445,116 2,161,218,136
wheat
flour /1 21,265,098 24,043,126 21,171,038 19,393,854
Malt
42,008,374 33,145,757 32,307,895 33,837,887
——-
In Bushels, CWT or Pounds ——-
Dec
20 Nov 20 Oct 20 Dec 19
Barley
152,473 165,776 97,416 163,003
Corn
/1 181,783,166 150,480,523 145,027,288 98,738,916
Sorghum
33,627,472 34,547,105 9,725,475 16,889,480
Oats
160,960 107,414 192,957 145,272
Rye
0 6,193 175 7,519
Wheat
/1 71,918,966 69,563,956 63,986,498 79,410,358
wheat
flour /1 468,815 530,060 466,742 427,561
Malt
92,612,628 73,073,898 71,226,728 74,599,784
1/Includes
commercial and donated.
Write
to Rodney Christian at csstat@dowjones.com
DJ
U.S. Dec Soymeal, Vegetable Oils/Oilseed Imports-Feb 5
In kilograms from the U.S. Commerce Department, converted to pounds
by
Dow Jones.
—-Dec
2020—- —-Nov 2020—-
kilograms
pounds kilograms pounds
coconut
oil 41,536,803 91,588,651 16,838,268 37,128,381
palm
kernel oil 32,313,847 71,252,033 30,350,146 66,922,072
palm
oil 137,019,869 302,128,811 142,659,377 314,563,926
soybean
20,843,467 45,959,845 9,335,631 20,585,066
soymeal
0 0 0 0
soyoil
11,495,516 25,347,613 9,620,589 21,213,399
rapeseed
oil
edible
138,684,606 305,799,556 127,874,476 281,963,220
rapeseed
oil,
inedible
57,316 126,382 36,499 80,480
Write
to Taryn Boss at csstat@dowjones.com
DJ
U.S. December Grain Imports-Feb 5
In kilograms, from the U.S. Commerce Department, converted to
pounds
by Dow Jones.
—-Dec
2020—- —-Nov 2020—-
kilograms
pounds kilograms pounds
durum
wheat 371,032 818,126 91,552 201,872
spring
wheat 7,580,711 16,715,468 7,972,770 17,579,958
winter
wheat 11,945,560 26,339,960 18,193,811 40,117,353
wheat/meslin
45,142,069 99,538,262 49,656,809 109,493,264
TOTAL
WHEAT 65,039,372 143,411,815 75,914,942 167,392,447
barley
7,490,498 16,516,548 3,114,090 6,866,568
oats
101,029 222,769 222,712 491,080
corn
44,307,164 97,697,297 22,885,661 50,462,883
other
corn 6,415,158 14,145,423 7,958,559 17,548,623
TOTAL
CORN 50,722,322 111,842,720 30,844,220 68,011,505
Write
to Taryn Boss at csstat@dowjones.com
Total
stocks of principal field crops on December 31
Dec 2018 Dec 2019 Dec 2020 Dec 2018-2019 December 2019-2020
thousands of tonnes % change
Total
wheat 25259 25825 24845 2.2 -3.8
Durum
wheat 5518 4661 4763 -15.5 2.2
Wheat ex.
durum 19741 21163 20082 7.2 -5.1
Barley
4943 5954 5680 20.5 -4.6
Canola
15152 15907 12140 5.0 -23.7
Corn
for grain 11628 10700 11055 -8.0 3.3
Dry
field peas 2550 2660 2565 4.3 -3.6
Flaxseed
410 387 377 -5.6 -2.6
Lentils
2306 2410 1848 4.5 -23.3
Oats
2406 2671 2682 11.0 0.4
Rye
169 179 297 5.9 65.9
Soybeans
4287 4053 3688 -5.5 -9.0
Estimates
as of tonight
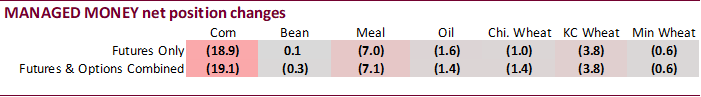

SUPPLEMENTAL
Non-Comm Indexes Comm
Net Chg Net Chg Net Chg
Corn
383,867 -21,714 386,625 -11,623 -753,251 21,657
Soybeans
146,050 1,289 143,822 -3,417 -290,291 718
Soyoil
70,998 -4,409 128,824 207 -221,042 3,776
CBOT
wheat -5,482 -2,764 143,009 3,108 -124,691 252
KCBT
wheat 31,779 -3,663 68,762 8 -101,672 4,397
=================================================================================
FUTURES
+ OPTS Managed Swaps Producer
Net Chg Net Chg Net Chg
Corn
345,147 -19,082 246,500 -2,509 -742,475 10,598
Soybeans
156,265 -325 60,424 -2,698 -267,374 912
Soymeal
67,511 -7,079 64,112 722 -181,466 4,333
Soyoil
105,930 -1,404 86,527 284 -227,481 3,166
CBOT
wheat 19,884 -1,391 88,375 4,058 -112,372 -186
KCBT
wheat 56,401 -3,838 43,642 607 -96,410 4,237
MGEX
wheat 14,100 -559 3,741 195 -24,463 2,527
———- ———- ———- ———- ———- ———-
Total
wheat 90,385 -5,788 135,758 4,860 -233,245 6,578
Live
cattle 75,171 3,368 78,740 -1,669 -162,700 -3,448
Feeder
cattle 1,460 -1,192 7,833 670 -2,138 419
Lean
hogs 51,353 8,206 50,770 -2,869 -97,544 -3,233
Other NonReport Open
Net Chg Net Chg Interest Chg
Corn
168,070 -687 -17,241 11,680 2,639,800 64,935
Soybeans
50,267 703 419 1,409 1,311,283 -4,411
Soymeal
18,385 575 31,458 1,449 483,991 607
Soyoil
13,804 -2,472 21,220 426 581,377 6,083
CBOT
wheat 16,948 -1,884 -12,836 -595 565,737 -2,732
KCBT
wheat -4,764 -265 1,131 -742 243,413 1,990
MGEX
wheat 3,167 431 3,455 -2,594 94,641 -290
———- ———- ———- ———- ———- ———-
Total
wheat 15,351 -1,718 -8,250 -3,931 903,791 -1,032
Live
cattle 24,690 371 -15,901 1,376 381,114 -2,449
Feeder
cattle 1,995 -934 -9,150 1,038 45,129 -2,437
Lean
hogs 7,529 -1,222 -12,109 -883 272,986 10,500
=================================================================================
U.S.
AGRICULTURE PRODUCT EXPORTS TO CHINA IN 2020 TOTAL $28.75 BILLION – U.S. DEPT OF AGRICULTURE DATA
U.S.
AGRICULTURE PRODUCT EXPORTS TO CHINA IN 2020 FALL SHORT OF $36.5 BILLION TARGET UNDER PHASE 1 TRADE DEAL – U.S. DEPT OF AGRICULTURE DATA (Reuters)
Corn.
-
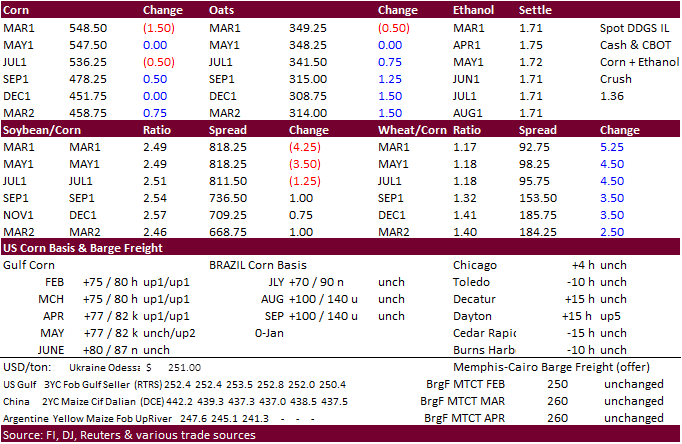
Corn
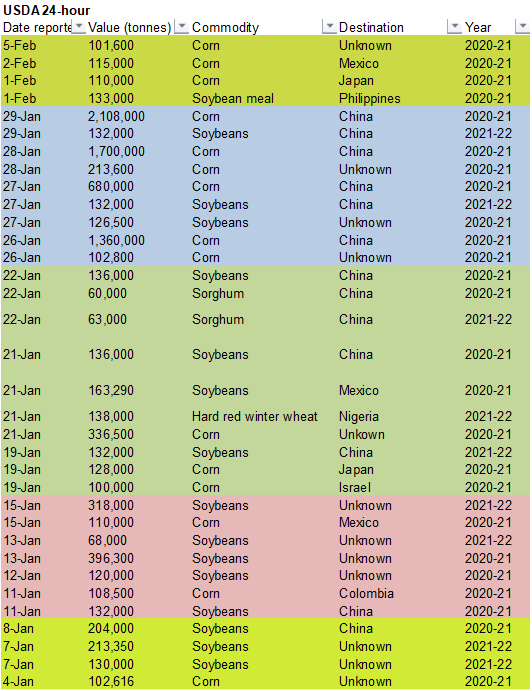
futures ended lower in the front month and July position. May was unchanged. New-crop December was unchanged. Positioning ahead of this weekend and the USDA report due out Tuesday were major features. There
was a 101,600 ton sale to unknown under the USDA 24-hour portal this morning.
Prices remain near a 7-1/2 year high. This afternoon the COT report confirmed fund liquidation last week into early this week. Farm Futures came out with a whopping 94.7 million corn area for the US and 84.5 million soybean area.
-
Funds
sold an estimated net 2,000 contracts.
-
Goldman
roll started today. -
The
US exported $28.75 billion of agriculture farm goods to China in 2020 and this was not a record. Ag exports totaled $28.98 billion to China in 2014. The 28.75 billion missed the phase one target but certainly supported CBOT futures throughout second half
2020. -
Watch
for Argentina grain related news next week. They apparently have not ruled out slapping on export duties on grains.
-
China
reported an outbreak of H5N8 bird flu in eastern Jiangsu. -
The
China National Grains & Oils Information Center – corn imports at 20 million tons in the 2020-21 season, up from 15 million tons predicted in January. China cash corn is near multiyear highs.
-
Effective
after the close of business on 2/5/21, Mar 2021 corn futures maintenance margins to $1,500 per contract from $1,400; Mar 2021 wheat futures contract maintenance margins were also increased to $1,900 per contract from the current $1,800.
Corn
Export Developments
·
Under the 24-hour reporting system private exporters sold 101,600 tons of corn to unknown.
·
South Korea’s NOFI group bought 65,000 tons of corn from either the US or SA at $289.39/ton c&f for arrival around June 10.
Updated
1/29/21
March
corn is seen trading in a $5.15 and $6.00 range.
May
corn is seen in a $5.00 and $6.00 range.
July
is seen in a $4.90 and $5.75 range.
December
is seen in a $3.75-$5.50 range.