PDF Attached
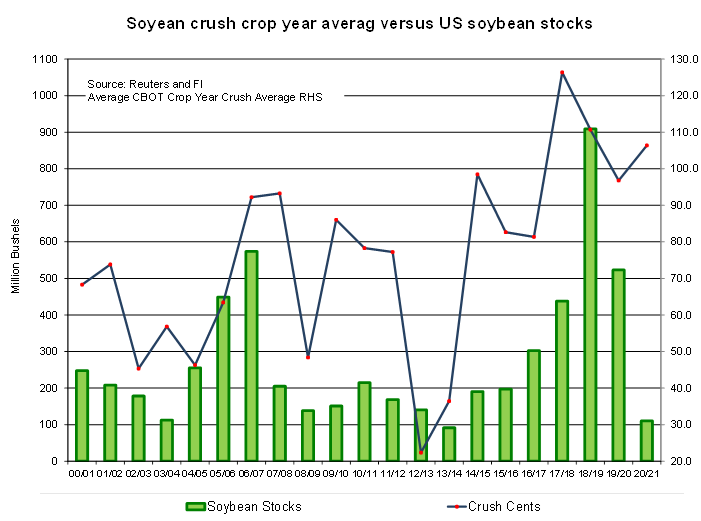
Attached is a table and embedded in the soybean complex a chart showing CBOT crush margins versus years of tight soybean stocks. Not too much to read into it as new crop crush margins are trading at a healthy level, and volume spiked. Just an observation, lumber futures jumped 7 percent today. Keep an eye out for China/North American trade news.
CBOT agriculture futures heated up again despite expectations for some long liquidation prior to a long US holiday weekend. USDA export sales did not include much in the way of fresh Chinese commitments, rather some sales switched from unknown categories. Sales were supportive for soybean meal
![]()
CME RAISES WHEAT FUTURES MAINTENANCE MARGINS BY 9.1% TO $1,800 PER CONTRACT FROM $1,650 FOR MARCH 2021, effective Jan 14 close.
CME RAISES CORN FUTURES MAINTENANCE MARGINS BY 18.2% TO $1,300 PER CONTRACT FROM $1,100 FOR MARCH 2021 (Reuters)
Official: https://www.cmegroup.com/content/dam/cmegroup/notices/clearing/2021/01/Chadv21-021.pdf
Weather
- US CPC: La Nina 95 percent to continue across the Northern Hemisphere through winter.
- We believe lingering conditions may not favor US Midwestern planting season amid too much rain.
NOT MUCH CHANGE OVERNIGHT
- South America’s weather outlook has not changed
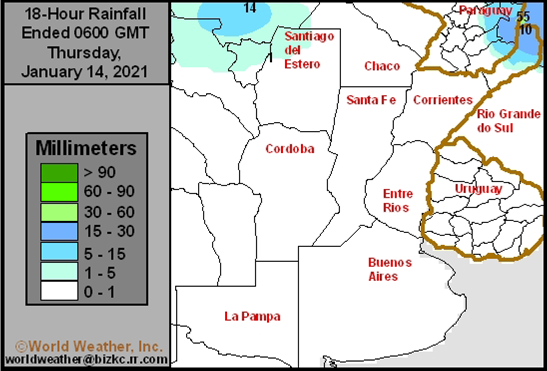
- Argentina weather Wednesday was mostly dry with a few showers in the far northwest and extreme southwest
- Moisture totals were less than 0.30 inch in key crop areas
- Temperatures were seasonable with highs in the 80s and a few lower 90s Fahrenheit in the far north
- Argentina is still expecting rain today in the far southwest and then Friday into Saturday in the central and northeast
- Sufficient amounts of moisture will occur in Santa Fe, Entre Rios, Corrientes, Chaco, Formosa and a few neighboring areas to help improve soil moisture that is still a little light after the first rain event passed through the region Sunday night and Monday
- Rainfall is not expected to be very great in parts of the south with a trace to 0.50 inch in parts of Buenos Aires and 0.20 to 0.75 inch in La Pampa, San Luis and southern Cordoba
- A few local rain amounts to 1.50 inches will occur in the southwest
- Rainfall farther to the north will vary from 0.60 to 2.00 inches and locally more
- Net drying is still advertised from Sunday through Jan. 24
- GFS model suggests rain chances will improve again Jan. 25-29, but the model may be exaggerating some of the expected rain
- Argentina’s bottom line still looks good for this first week of the outlook due to recent rain and that which is still coming. However, the drier and hotter weather expected for a while next week will accelerate drying and deplete soil moisture raising crop stress. That will put much pressure on the Jan. 25-29 rainfall events that (at this moment) are of low confidence. Crop stress could become more of an issue later in the reproductive season during February, but there is plenty of time for weather patterns to change supporting greater rainfall. Confidence in the GFS advertised rain events are low, but some rain is expected.
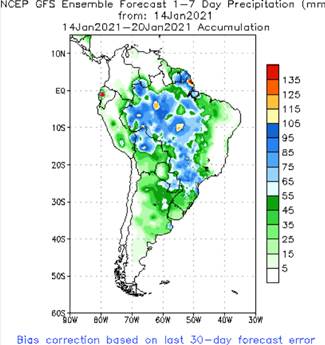
- Most of Brazil’s most important grain, oilseed, cotton, citrus and sugarcane areas will receive rain at one time or another during the next ten days
- The moisture will be sufficient to sustain normal crop development for many areas and improve crop conditions in some areas
- Sao Paulo and extreme eastern Mato Grosso do Sul had the greatest near term need for rain prior to Wednesday as well as parts of central and southwestern Mato Grosso after being missed by some of the greater amounts recently; however, these areas received some needed moisture Wednesday
- These areas should get additional rain in the coming week to bring additional relief
- Eastern Minas Gerais through eastern Bahia and Espirito Santo to Pernambuco will receive limited rainfall and experience some net drying
- These areas are not important grain, oilseed or cotton production areas, but do produce some coffee, cocoa and sugarcane
- Crop moisture stress is expected in some of these soft agricultural crops and the need for rain will steadily rise into February
- Temperatures in Brazil will be seasonable with a slight warmer bias in the north during the drier days
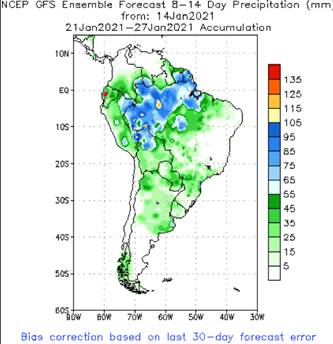
- Brazil’s greatest rainfall is probably a week away for some areas and a close watch on the distribution of daily rainfall is needed until that time
- Areas from Mato Grosso and Goias to Parana and Sao Paulo will be wettest
- Winterkill is not much of a threat in wheat areas around the world for the next seven days
- Snow cover is present in most of Russia and is increasing in parts of Europe
- Temperatures will not be low enough to induce damage in any snow-free wheat area worldwide for at least a week
- Snow free areas in the world that will be closely monitored for a threat to wheat include; northwestern U.S. Plains, southwestern Canada’s Prairies, U.S. hard red winter wheat areas and China
- However, none of these areas has any immediate risk of damaging cold
- Montana and the southwestern Canada Prairies will need snow cover first since they will likely trend colder in the Jan. 21 to 27 period
- Russia’s Southern Region, Middle Volga River Basin and northwestern Kazakhstan will receive periods of snow over the next ten days
- The moisture will be welcome to crops in the spring after some of these areas were extremely dry during the summer, autumn and early winter
- Cooling is expected in Russia later this week into next week with some of the cold expected to be notable, but mostly in the north where there is plenty of snow on the ground to protect winter crops
- Ukraine and northern parts of Russia’s Southern Region will experience low temperatures in the positive and negative single digits this weekend into next week, but snow will cover the ground by that time protecting most crops from the cold
- Europe temperatures are colder biased, but not cold enough to raise any potential threat to winter crops – at least for now
- A boost in home and business heating fuel consumption rates has occurred, but the demand is not excessively great except in some Mediterranean Sea countries where temperatures are most below average
- Europe temperatures will continue a little below average for much of the coming week, although France and the U.K. will experience a more seasonable range of temperatures
- Eastern Europe may trend colder in the Jan. 22-28 period
- Europe precipitation will be frequent across much of the continent during the coming week to ten days maintaining moisture abundance and putting some additional snow on the ground
- A boost in snow cover is needed to protect winter crops from any bitter cold that evolves later this month
- Excessive wind speeds occurred Wednesday from the heart of Canada’s Prairies and Montana southward into the central Plains this morning
- Sustained wind speeds of 20 to 45 mph were noted with gusts of 50 to 80 mph in crop areas
- The wind was expected to cause power outages, transportation issues and damage to both trees and personal property
- The windy weather will continue into Friday – mostly across the U.S. Plains and far western Corn Belt
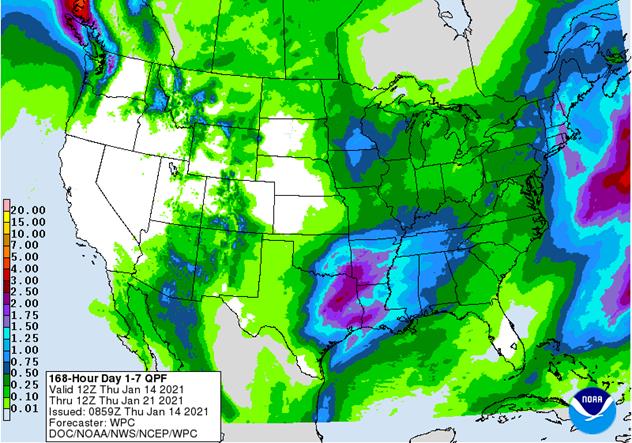
- U.S. precipitation outlook next two weeks
- Snow and rain will evolve in the upper Midwest today will change to all snow tonight and Friday with near blizzard conditions possible
- Cooling will accompany the event with some windy conditions and briefly falling temperatures after some very warm weather today into Thursday
- Blizzard or near blizzard conditions are expected from the easternmost Dakotas into northern Iowa, Minnesota and Wisconsin tonight night and Friday
- Snow accumulations of 2 to 6 inches will be common with local totals of 6 to 10 inches possible
- Wisconsin, parts of Iowa and southeastern Minnesota will see most of the heavy snow with some in northwestern Illinois as well
- The Delta and southeastern states will not be impacted by much precipitation through the early part of next week
- A storm system is expected in both regions during the latter part of next week and into the following weekend
- Some of the precipitation in the Delta and southeastern states will also impact the lower eastern Midwest and the middle Atlantic Coast states late next week through the following weekend
- Some significant rain and snow will be possible
- Another precipitation event may evolve across the north-central states and Great Lakes region Jan. 23-25
- Greater cooling will follow this event
- There is potential for another storm to evolve in the lower Midwest or Delta in the last week of January that might develop into a nor’easter
- Snowfall may increase in the western United States late next week into the following weekend as colder air pushes into that region
- South Africa will continue to be impacted by periodic showers and thunderstorms over the next ten days supporting most of its crops in a favorable manner
- Temperatures will be seasonable
- A few pockets of dryness might evolve over time, but there will be no threat to production
- Jan. 21-27 will be drier biased relative to this week and net drying could be increased across the nation during that period of time
- India weather over the next couple of weeks will include some periodic rainfall in the far south into this weekend, but the bulk of the nation’s winter crops will not be impacted by significant moisture
- Last week’s rain in northern India improved winter crops from eastern Rajasthan and northern Uttar Pradesh into Punjab
- Recent rain in far southern India was less welcome and may have continued to disrupt harvesting of sugarcane, late cotton and groundnuts
- Australia summer grain and cotton areas will be mostly dry through Saturday
- Scattered showers and thunderstorms will develop in southeastern Queensland and northeastern New South Wales Sunday into next week offering some short term reprieve from this week’s drying
- Temperatures will be hotter in the central and western parts of the nation this week while more seasonable readings prevail in the east
- China weather this week will be seasonably dry except for some light snow in the northeast and a few rain showers in the southwest
- Temperatures will be near normal this week and then slightly warmer biased during the weekend and next week
- Rain in Northern Africa recently was good for wheat and barley
- Additional rain is needed in southwestern Morocco and northwestern Algeria where recent rain was good, but not enough to seriously bolster soil moisture for long term benefits to winter crops
- Showers will be mostly confined to coastal areas of northeastern Algeria and northern Tunisia during the next ten days leaving some of the drier areas in need of more rain for a while
- Waves of rain will impact the Philippines, Indonesia and Malaysia over the next week to ten days
- Excessive moisture is possible at times, but most of the greater rainfall that has been seen recently has abated for the next several days and then will return again
- Flooding has been an issue for the nation at times in recent months
- Mainland areas of Southeast Asia will be dry over the next ten days except coastal areas of Vietnam where scattered showers are expected
- West Africa rainfall will remain mostly confined to coastal areas while temperatures in the interior coffee, cocoa, sugarcane, rice and cotton areas are in a seasonable range for the next ten days
- Some rain fell in Ivory Coast and Ghana coffee and cocoa areas Monday, but resulting amounts were light
- East-central Africa rainfall will continue limited in Ethiopia as it should be at this time of year while frequent showers and thunderstorms impact Tanzania, Kenya and Uganda over the next ten days
- Southern Oscillation Index remains very strong during the weekend and was at +19.52 today and the index will remain very strong for a while longer
- Mexico and Central America weather will continue to generate erratic rainfall
- Far southern Mexico and portions of Central America will be most impacted by periodic moisture which is greater than usual at this time of year
- Rain advertised for central and northern Mexico next week would be welcome, but it is likely overdone
- Canada Prairies will remain warmer than usual over the coming week, but not as warm as recent days
- Precipitation will occur a little more often helping to improve snow cover and potential topsoil moisture in the spring
- Southeast Canada will receive only light amounts of precipitation this workweek and temperatures will be warmer than usual
- Rain and snow are expected this weekend
Cooling is likely next week and precipitation may briefly increase
Source: World Weather Inc. and FI
Source: World Weather Inc. and FI
Thursday, Jan. 14:
- USDA weekly crop net-export sales for corn, soybeans, wheat, cotton, pork, beef, 8:30am
- China customs to publish 2020 trade data, including imports of soy, edible oils, meat and rubber
- AB Foods trading update
- International Grains Council monthly report
- Port of Rouen data on French grain exports
- EARNINGS: Suedzucker, Agrana
Friday, Jan. 15:
- ICE Futures Europe weekly commitments of traders report, 1:30pm (6:30pm London)
- CFTC commitments of traders weekly report on positions for various U.S. futures and options, 3:30pm
- Cocoa Association of Asia releases 4Q 2020 cocoa grind data
- Malaysia’s Jan. 1-15 palm oil export data
- New Zealand Food Prices
Monday, Jan. 18:
- China customs to publish trade data, including corn, wheat, sugar and pork imports
- China 4Q pork output
- EU weekly grain, oilseed import and export data
- Brazil coffee exporters group Cecafe releases December data
- Ivory Coast cocoa arrivals
- HOLIDAY: U.S. (Martin Luther King, Jr. Day)
Tuesday, Jan. 19:
- USDA weekly corn, soybean, wheat export inspections, 11am
- New Zealand global dairy trade auction
Wednesday, Jan. 20:
- China customs to publish import data split by country
- European Cocoa Association grinding data
- Malaysia’s Jan 1-20 palm oil exports
Thursday, Jan. 21:
- USDA weekly crop net-export sales for corn, soybeans, wheat, cotton, pork, beef, 8:30am
- Port of Rouen data on French grain exports
- USDA red meat production
Friday, Jan. 22:
- ICE Futures Europe weekly commitments of traders report, 1:30pm (6:30pm London)
- CFTC commitments of traders weekly report on positions for various U.S. futures and options, 3:30pm
- EIA weekly U.S. ethanol inventories, production, 10:30am (two days later than usual due to federal holidays earlier in the week)
- U.S. Cattle on Feed, poultry slaughter
Source: Bloomberg and FI
USDA export sales
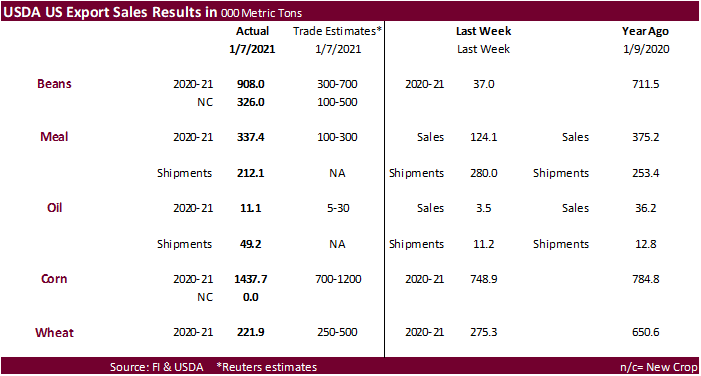
· USDA export sales for soybeans of 908,000 tons for 2020-21 were above expectations and new-crop sales were withing expectations at 326,000 tons. For current crop year, it included China (758,300 MT, including 264,000 MT switched from unknown destinations and decreases of 79,800 MT), followed by the EU and Mexico. For 2021-22, net sales included 326,000 MT for unknown destinations (260,000 MT) and China (66,000 MT). Exports of 2,040,000 tons.
· Soybean meal sales were good at 337,400 tons, a marketing year high, and shipments ok at 212,100 tons. El Salvador, Vietnam and the Philippines were good buyers.
· Soybean oil sales were low at 11,100 tons but shipments were good at 49,200 tons.
· USDA corn export sales of 1.438 million tons were above expectations. Japan and Columbia were big buyers. China was in there for 88,000 tons but most of that was switched from unknown.
· USDA export sales for sorghum were very good at 190,900 tons and included unknown for 120,000 tons.
· USDA pork sales were 23,800 tons.
· All-wheat USDA export sales of 221,900 tons were at the low end of expectations.
US Initial Jobless Claims Jan 9 965K (est 795K; prevR 784K; prev 787K)
-US Continuing Claims Jan 2 5.271 Mln (est 5.061 Mln; prev 5.072 Mln)
US Import Price Index (M/M) Dec 0.9% (est 0.7%; PREV 0.2%; prev 0.1%)
-US Import Price Index Ex Petroleum (M/M) Dec 0.4% (est 0.1%; prev 0.0%)
-US Import Price Index (Y/Y) Dec -0.3% (est -0.8%; prev -1.0%)
-US Export Price Index (M/M) Dec 1.1% (est 0.4%; prev 0.6%)
-US Export Price Index (Y/Y) Dec 0.2% (prev -1.1%)
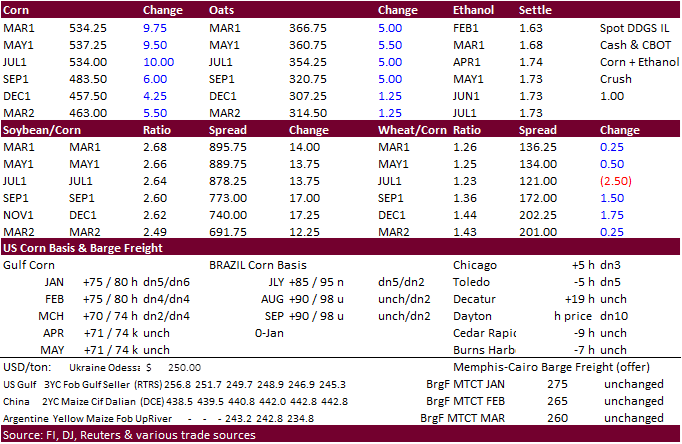
Corn.
- Corn futures ended higher on demand and fund buying. Also lending support to the corn market was the higher-than-expected US exports sales
- Traders should be eyeing the March corn gap of 517.25 and 522.25.
We see two debates going on. First is the 2021 US soybean and corn acreage fight. Currently futures prices favor US soybean plantings. Cotton area is expected to be down as its preferred corn would be picked over other row crops. Second debate is timing of rationing given well the tight stocks to use ratios. We think this is a soybean problem. Fact remains, the US has plenty of corn and wheat. The US can export the heck out of corn and still have plenty of stocks by mid-June when Ukraine and Brazil come online for exports. Back to soybeans, we think crushers are well covered through early April, which may leave four months of rationing. Exports are already starting to slow, so LH 2021-22 Sep-Aug soybean exports should drop hard from FH crop year
US EPA PROPOSES TO EXTEND 2019, 2020 COMPLIANCE DEADLINES FOR BIOFUEL BLENDING REQUIREMENTS – Reuters News
*EPA OFFERS EXTENSION OF BIOFUEL-BLENDING DEADLINES FOR REFINERS
*REFINERS WOULD HAVE UNTIL LATE 2021 TO SATISFY 2019 TARGETS
*EPA SEEKS EXTENSION OF BIOFUEL-BLENDING DEADLINES FOR REFINERS
Ironically after these headlines came out soybean oil rallied from near session lows.
Note some think the incoming US presidential administration will support biofuel policy.
US EPA SAYS TAKING NO POSITION ON AVAILABILITY OF SMALL REFINERY EXEMPTIONS FOR BIOFUEL BLENDING LAWS FOR 2019 COMPLIANCE YEAR DUE TO ONGOING LITIGATION
India now aims to achieve 20% ethanol blending in gasoline by 2025, five years ahead of its previous target, according to an official statement today.
About 12 billion liters of ethanol is required to achieve the 20% target by 2025 and to meet the requirement of chemical and other sectors, of which seven billion liters will have to be supplied by the sugar industry and the remaining by grain-based distilleries, the government said in the statement.
To produce seven billion liters of ethanol by the sugar industry, about six million metric tons of surplus sugar would be diverted to ethanol, which will help ease supply glut and improve the revenue realization of sugar mills, it added.
Indian oil marketing companies procure ethanol from sugar mills to blend with gasoline under a so-called Ethanol Blended Petrol program as New Delhi seeks to boost its usage to cut the country’s reliance on costly crude oil imports. India, the world’s third-largest oil importer, sources almost 85% of its fuel requirement from overseas.
New Delhi aims to achieve 10% blending target by 2022.
Last month, the cabinet had approved an interest subvention scheme worth 84.6 billion rupees ($1.16 billion) to further incentivize and boost ethanol production capacity and achieve the target for ethanol-blending in gasoline.
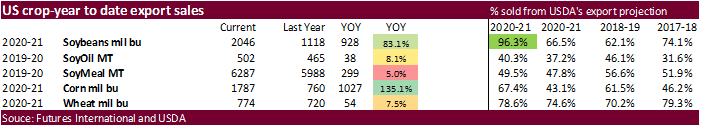
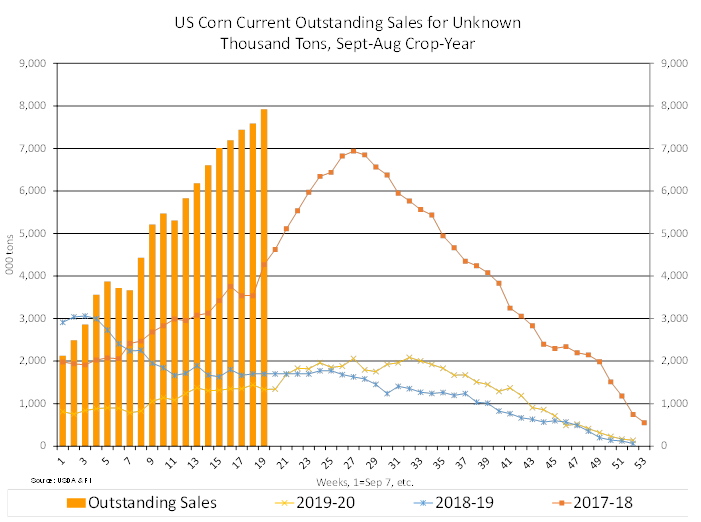
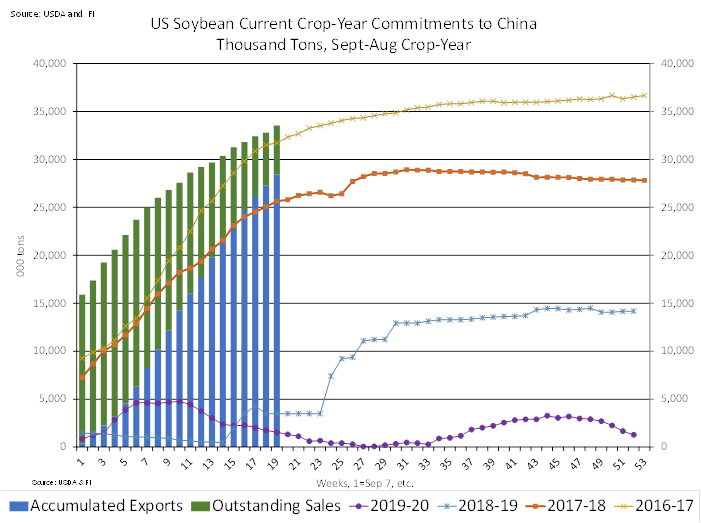
Attached are selected USDA export sales charts. Soybean commitments are large and the gap between commitments and actual exports is starting to close. Corn commitments are huge in the unknown category despite week after week of switching from “unknown” to selected countries. For example, today we saw “China (88,500 MT, including 70,000 MT switched from unknown destinations and decreases of 1,100 MT)”
Going forward, I see the front three month corn contracts staying strong, based on US export demand, followed by a tighter carryout. Sep onward will depend on US planting season, IMO
- Funds on Thursday bought an estimated net 30,000 corn after picking up 20,000 on Wednesday and 58,000 on Tuesday. +108,000 since selling 13,000 on Monday.
Corn Export Developments
- Results awaited: Qatar seeks 100,000 tons of bulk barley on January 12.
- Results awaited: Qatar seeks 640,000 cartons of corn oil on January 12.
Updated 1/12/21
March corn is seen trading in a $4.75 and $5.50 range
- CBOT soybeans closed firmer on crusher demand and export sales that came in at the high-end of expectations. USDA export sales did not include much in the way of fresh Chinese commitments, rather some sales switched from unknown categories. Sales were supportive for soybean meal.
- There was heavy Dec crush trading today as crusher took advantage of 100+ cent prices. Current crop year crush prices have been eroding. See out historical crop year soybean stocks vs. crush averages below the export section.
- The increase in US farmer selling subsidized today. This may be more a function for new crop as they capture high futures prices and positive new-crop basis levels. They are thought to have sold about 80 percent of the soybean crop. Recall both the 2020 US soybean and corn crop production were lowered by USDA earlier this week.
- China soybean imports during December hit 7.524 million tons, down 27 percent from 9.54 million for December 2019. For all of 2020, China imported 100.33 million tons, a 13 percent increase from 2019. China imported nearly 10 million tons of meat in 2020, up 60.4 percent from year earlier.
- India palm oil imports increased 4 percent in December to 770,392 tons from month earlier while soybean oil imports were 322,809 tons.
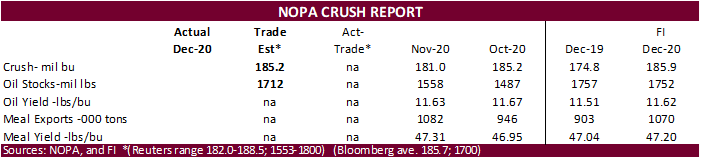
- The NOPA crush is due out tomorrow and the trade is estimating 185.2 crush and soybean oil stocks of 1712. Trade estimates versus previous month are below.
- Argentina is seeing some rain. Southern Brazil will be wet over the short term.
- Rosario grains exchange (BCR): Argentina 47 million tons for soybeans.
- Brazilian truck drivers are planning a strike starting February 1st over fuel costs.
- Funds on Thursday bought an estimated net 18,000 soybeans, bought 7,000 soybean meal and bought 7,000 soybean oil.
We had a question today regarding what happens to CBOT crush prices during years of tight soybean stocks. 2013-14 carryout stocks fell to 92 million bushels and it appears crush prices started to erode in 2012-13. A carryout under 100 million bushels could eventually put pressure on the November/December crush, currently trading near 102 cents per bushel. *SP on chart below should read average not “average”
Second thought on the chart below with record US stocks posted 2018-19…and with a 140 USDA carryout, it appears the environment for US soybean stocks fluctuations year by year will have a long term impact on future crop-year price volatility. It is incredible to take a step back and look at the three year swing in US stocks. Weather modeling will become increasingly important for any fundamental trader over the next decade.
- Results awaited: Algeria seeks 35,000 tons of soybean meal on Thursday for Feb 15-Feb 28 shipment, optional origin.
- Results awaited: The USDA seeks 7,430 tons of vegetable oil under the PL480 program on January 14 for shipment during Feb 16 to Mar 15 (Mar 1-31 for plants at ports).
- USDA seeks 6,390 tons of vegetable oil on January 20 under the PL480 program for March 1-31 shipment (Mar 16-Apr 15 for plants at ports).
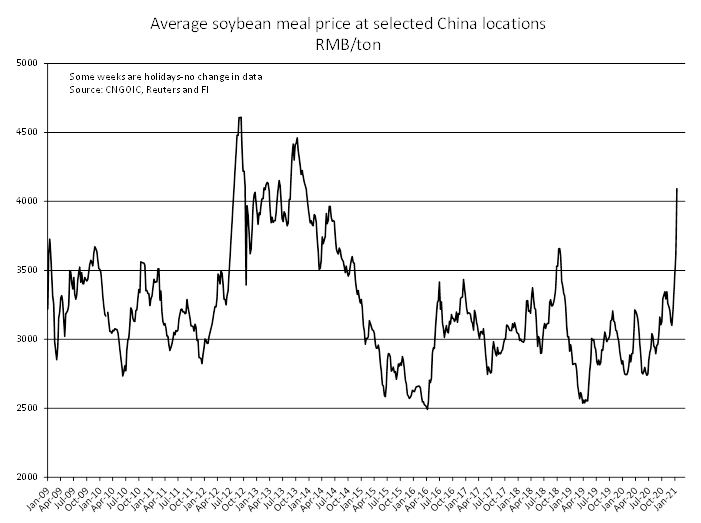
China crush chart – via JCI spot cash
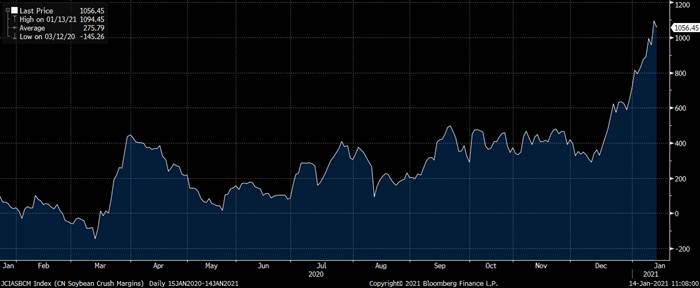
Source: Bloomberg and FI

Updated 1/12/21
March soybeans are seen in a $13.25 and $15.00 range
March soymeal is seen in a $430 and $500 range
March soybean oil is seen in a 42.00 and 45.50 cent range
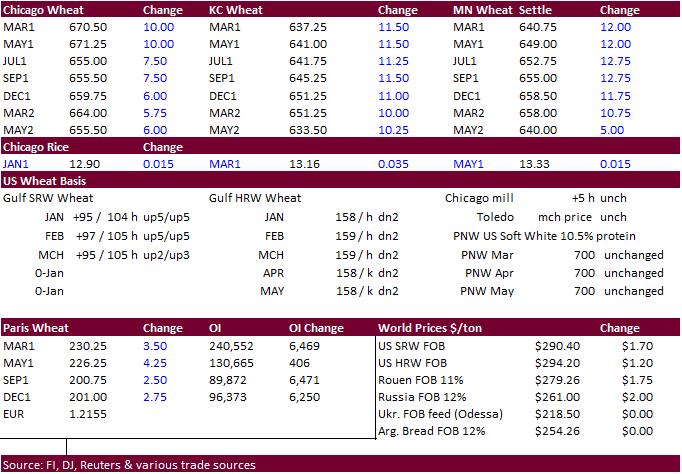
- Chicago wheat rose following corn higher. Gains were limited by the weaker-than-expected wheat export sales. KC and MN led the wheat markets higher. Traders are awaiting Russian export duty developments when officials meet on Friday
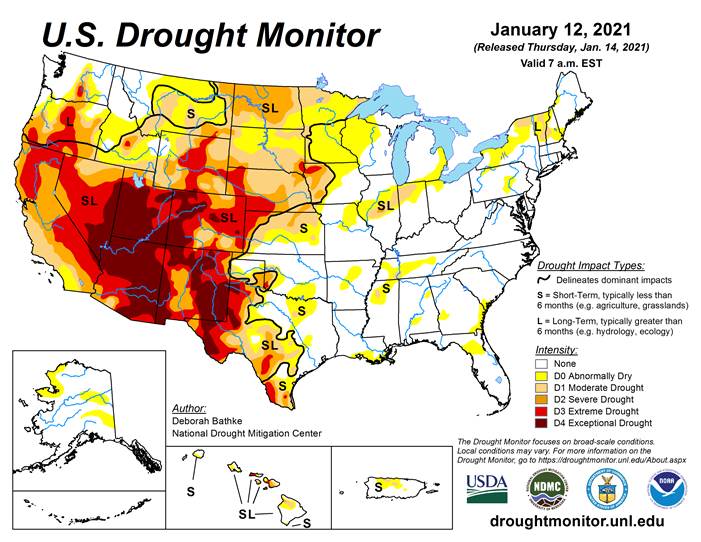
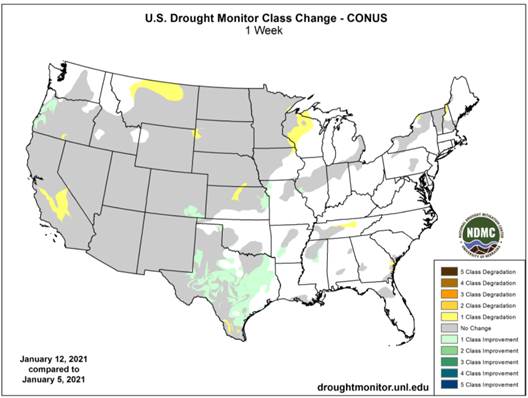
- Parts of TX and OK will see beneficial precipitation through the weekend. Drought conditions improved across Texas last week.
- Russia plans to resume government grain sales from intervention stocks starting Jan 20.
- Rosario grains exchange (BCR): Argentina wheat production 17 million tons, up from 16.5 MMT projected in December.
- Funds on Thursday bought an estimated net 9,000 Chicago wheat contracts.
- EU March milling wheat was up 3.00 at 229.75 euros.
- On January 15, Russian officials will meet to discuss the export taxes on grains and oilseeds. Russian may expand their export tax beyond oilseed and wheat exports. Russia is considering a barley and corn export tax of 10 euros ($12) per ton and 25 euros per ton, respectively, between Feb. 1 and March 31, 2021. The latest for wheat we heard was 70 euros / ton from March. Timing on the export duties should be clearer when the official meet on Friday.
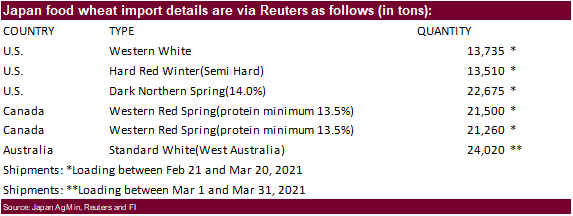
- Japan bought 116,700 tons of food wheat. Original details of the tender as follows.
- Bangladesh seeks 50,000 tons of wheat January 18 for shipment within 40 days of contract signing.
- Jordan seeks 120,000 tons of milling wheat, optional origin, on Jan. 20. Possible shipment combinations are between June 1-15, June 16-30, July 1-15, July 16-31, Aug. 1-15 and Aug. 16-31.
- Syria seeks 200,000 tons of wheat on Jan 18 for shipment within 60 days after contract signing.
- Japan in a SBS auction seeks 80,000 tons of feed wheat and 100,000 tons of feed barley for arrival in Japan by March 18 on January 19.
- Jordan seeks 120,000 tons of feed barley on Jan 19.
- Turkey seeks 400,000 tons of milling wheat on Jan 19 for Jan through Feb 25 shipment.
- Bangladesh seeks 50,000 tons of wheat January 25 for shipment within 40 days of contract signing.
- The US banned cotton based products from selected China regions over labor conditions, but we are still trying to get a direction on what goods will fall under this rule. Either way you look at it, keep in mind the US ships cotton to China and finished goods come back to the US.
- Bangladesh seeks 10,000 tons of rice on January 18.
· Bangladesh seeks 60,000 tons of rice on January 20.
· Bangladesh seeks 50,000 tons of rice on Jan. 24.
- Bangladesh seeks 50,000 tons of rice on January 26.
· South Korea seeks 113,555 tons of US, Thailand, and China rice on Jan 21 for April 30 through July 31 arrival.
· Syria seeks 25,000 tons of rice on February 9.
Updated 1/12/21
March Chicago wheat is seen in a $6.35‐$7.15 range
March KC wheat is seen in a $6.00‐$6.50 range
March MN wheat is seen in a $6.00‐$6.55 range
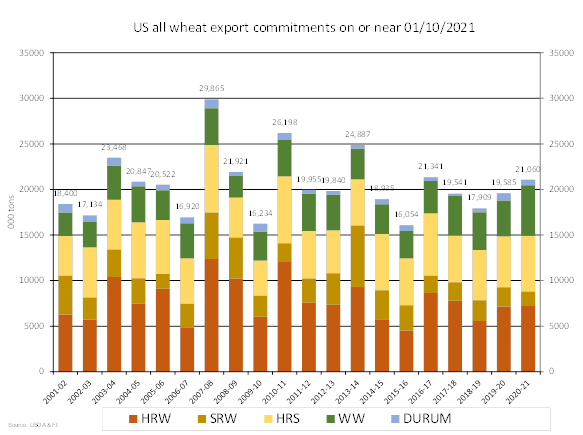
This summary is based on reports from exporters for the period January 1-7, 2021.
Wheat: Net sales of 221,900 metric tons (MT) for 2020/2021 were down 19 percent from the previous week and 49 percent from the prior 4-week average. Increases primarily for Bangladesh (55,000 MT), Mexico (46,200 MT, including decreases of 5,800 MT), Malaysia (34,000 MT, switched from unknown destinations), unknown destinations (25,000 MT), and Nigeria (23,800 MT, including decreases of 3,100 MT), were offset by reductions for Guatemala (6,100 MT), El Salvador (3,900 MT), and China (1,600 MT). For 2021/2022, net sales of 10,100 MT were primarily for Guatemala (6,100 MT). Exports of 358,500 MT were down 14 percent from the previous week and 2 percent from the prior 4-week average. The destinations were primarily to South Korea (68,400 MT), Japan (65,700 MT), China (58,400 MT), the Philippines (56,900 MT), and Mexico (46,800 MT).
Optional Origin Sales: For 2020/2021, the current outstanding balance of 10,000 MT, all Spain.
Corn: Net sales of 1,437,700 MT for 2020/2021 were up 92 percent from the previous week and 34 percent from the prior 4-week average. Increases primarily for Japan (401,500 MT, including 66,400 MT switched from unknown destinations), unknown destinations (334,500 MT), Colombia (125,900 MT, including 40,000 MT switched from unknown destinations and decreases of 84,100 MT), Mexico (124,100 MT, including decreases of 200 MT), and China (88,500 MT, including 70,000 MT switched from unknown destinations and decreases of 1,100 MT), were offset by reductions for El Salvador (24,000 MT). Exports of 1,464,300 MT were up 43 percent from the previous week and 41 percent from the prior 4-week average. The destinations were primarily to China (555,500 MT), Mexico (300,300 MT), Japan (168,400 MT), Colombia (89,700 MT), and Peru (75,400 MT).
Optional Origin Sales: For 2020/2021, the current outstanding balance of 1,351,400 MT is for South Korea (838,000 MT), unknown destinations (224,000 MT), Taiwan (140,000 MT), China (65,000 MT), Japan (52,000 MT), and Ukraine (32,400 MT).
Barley: No net sales or exports were reported for the week.
Sorghum: Net sales of 190,900 MT for 2020/2021 were up noticeably from the previous week and up 76 percent from the prior 4-week average. Increases were reported for unknown destinations (120,000 MT) and China (70,900 MT, including 68,000 MT switched from unknown destinations and decreases of 55,000 MT). Exports of 74,300 MT were down 13 percent from the previous week and 58 percent from the prior 4-week average. The destination was primarily to China.
Rice: Net sales of 12,900 MT for 2020/2021 were down 66 percent from the previous week and 86 percent from the prior 4-week average. Increases were primarily for Canada (3,600 MT), Jordan (2,800 MT), Saudi Arabia (2,700 MT), Mexico (1,400 MT), and Guatemala (1,200 MT). Exports of 19,200 MT were down 81 percent from the previous week and 82 percent from the prior 4-week average. The destinations were primarily to Japan (13,500 MT), Canada (2,400 MT), Mexico (1,400 MT), Saudi Arabia (700 MT), and Haiti (400 MT).
Exports for Own Account: For 2020/2021, new exports for own account totaling 100 MT were for Canada. The current exports for own account outstanding balance is 100 MT, all Canada.
Soybeans: Net sales of 908,000 MT for 2020/2021 were up noticeably from the previous week and up 93 percent from the prior 4-week average. Increases primarily for China (758,300 MT, including 264,000 MT switched from unknown destinations and decreases of 79,800 MT), Spain (143,000 MT, including 130,000 MT switched from unknown destinations), Mexico (98,100 MT, including decreases 200 MT), the Netherlands (85,500 MT, including 78,000 MT switched from unknown destinations), and Pakistan (70,100 MT, including 66,000 MT switched from unknown destinations), were offset by reductions primarily for unknown destinations (586,300 MT). For 2021/2022, net sales of 326,000 MT were for unknown destinations (260,000 MT) and China (66,000 MT). Exports of 2,040,000 MT were up 10 percent from the previous week, but down 12 percent from the prior 4-week average. The destinations were primarily to China (1,166,000 MT), Spain (143,000 MT), Mexico (109,600 MT), Vietnam (89,700 MT), and the Netherlands (85,500 MT).
Exports for Own Account: For 2020/2021, the current exports for own account outstanding balance is 6,100 MT, all Canada.
Soybean Cake and Meal: Net sales of 337,400 MT for 2020/2021–marketing-year high–were up noticeably from the previous week and up 97 percent from the prior 4-week average. Increases primarily for El Salvador (82,000 MT), Vietnam (49,900 MT, including decreases of 1,100 MT), the Philippines (45,100 MT, including decreases of 1,000 MT), Chile (35,000 MT), and Ecuador (31,700 MT, including decreases of 100 MT), were offset by reductions for unknown destinations (7,000 MT), Nepal (1,000 MT), and Colombia (300 MT). For 2021/2022, total net sales of 60,000 MT were for unknown destinations. Exports of 212,100 MT were down 24 percent from the previous week and from the prior 4-week average. The destinations were primarily to Colombia (52,600 MT), Vietnam (50,100 MT), Mexico (42,800 MT), Canada (20,800 MT), and the United Kingdom (19,500 MT).
Soybean Oil: Net sales of 11,100 MT for 2020/2021 were up noticeably from the previous week, but down 52 percent from the prior 4-week average. Increases primarily for unknown destinations (8,500 MT), Mexico (2,500 MT), Guatemala (700 MT, switched from Jamaica), and Canada (100 MT), were offset by reductions for Jamaica (700 MT). Exports of 49,200 MT were up noticeably from the previous and from the prior 4-week average. The destinations were primarily to India (36,000 MT), Guatemala (7,500 MT), Jamaica (2,800 MT), Mexico (2,200 MT), and Canada (400 MT).
Cotton: Net sales of 326,000 RB for 2020/2021 were up noticeably from the previous week and up 2 percent from the prior 4-week average. Increases primarily for China (151,200 RB, including 2,900 RB switched from Hong Kong and decreases of 15,400 RB), Pakistan (56,600 RB), Turkey (39,000 RB), Bangladesh (24,300 RB, including decreases of 6,000 RB), and Vietnam (23,800 RB, including decreases of 10,000 RB), were offset by reductions for Hong Kong (2,900 RB) and Malaysia (1,500 RB). For 2021/2022, net sales of 50,300 RB were for Malaysia (22,000 RB), Guatemala (13,200 RB), Bangladesh (8,800 RB), and Peru (6,300 RB). Exports of 274,600 RB were up 2 percent from the previous week and from the prior 4-week average. Exports were primarily to China (156,800 RB), Vietnam (40,800 RB), Pakistan (26,400 RB), Mexico (11,300 RB), and Turkey (11,000 RB). Net sales of Pima totaling 35,900 RB–a marketing-year high–were up noticeably from the previous week and from the prior 4-week average. Increases primarily for India (20,700 RB), Vietnam (8,800 RB), China (7,000 RB, including 2,600 RB switched from Hong Kong), Pakistan (1,300 RB), and Thailand (1,300 RB), were offset by reductions for Hong Kong (2,600 RB) and Bangladesh (1,500 RB). For 2021/2022, total net sales of 400 RB were for India. Exports of 10,300 RB were down 17 percent from the previous week and 37 percent from the prior 4-week average. The destinations were primarily to China (5,200 RB), India (1,700 RB), Pakistan (1,500 RB), Peru (1,000 RB), and Egypt (700 RB).
Exports for Own Account: For 2020/2021, new exports for own account totaling 100 RB were to China. The current exports for own account outstanding balance of 4,500 RB is for China.
Hides and Skins: Net sales of 340,400 pieces for 2021, primarily for China (232,400 whole cattle hides, including decreases of 8,100 pieces), South Korea (55,600 whole cattle hides, including decreases of 700 pieces), Mexico (25,600 whole cattle hides, including decreases of 2,100 pieces), Taiwan (10,900 whole cattle hides, including decreases of 700 pieces), and Brazil (5,600 whole cattle hides), were offset by reductions primarily for Indonesia (500 pieces). Additionally, net sales reductions of 500 kip skins were for Belgium. Exports of 357,800 pieces for 2021 were primarily to China (249,900 pieces), South Korea (56,000 pieces), Mexico (17,700 pieces), Taiwan (9,300 pieces), and Thailand (8,400 pieces). Additionally, exports of 5,100 kip skins were reported to Belgium.
Net sales of 140,000 wet blues for 2021 were reported for Italy (47,400 unsplit and 38,000 grain splits, including decreases of 100 unsplit), Vietnam (33,400 unsplit and 100 grain splits, including decreases of 100 unsplit), Thailand (11,500 unsplit, including decreases of 500 unsplit), China (8,000 unsplit), and Taiwan (1,700 grain splits), were offset by reductions primarily for Germany (100 grain splits) and Brazil (100 unsplit). Exports of 130,100 wet blues for 2021 were primarily to Vietnam (43,200 unsplit), China (30,100 unsplit and 3,200 grain splits), Italy (10,400 unsplit and 7,900 grain splits), Thailand (13,500 unsplit), and Taiwan (8,000 unsplit). Net sales of splits, 450,800 pounds for 2021, were primarily for Vietnam (427,000 pounds, including decreases of 800 pounds). Total exports of 538,300 pounds were to Vietnam.
Pork: Net sales of 23,800 MT reported for 2021, increases primarily for Mexico (6,600 MT, including decreases of 700 MT), Japan (3,400 MT, including decreases of 200 MT), South Korea (3,300 MT, including decreases of 500 MT), the Philippines (2,400 MT), and Colombia (2,400 MT, including decreases of 100 MT), were offset by reductions primarily for Australia (100 MT). Exports of 30,000 MT were primarily to China (11,500 MT), Mexico (6,900 MT), Japan (3,300 MT), South Korea (2,300 MT), and Canada (1,500 MT).
January 14, 2021 1 FOREIGN AGRICULTURAL SERVICE/USDA
U.S. EXPORT SALES FOR WEEK ENDING 01/07/2021
|
|
CURRENT MARKETING YEAR |
NEXT MARKETING YEAR |
||||||
|
COMMODITY |
NET SALES |
OUTSTANDING SALES |
WEEKLY EXPORTS |
ACCUMULATED EXPORTS |
NET SALES |
OUTSTANDING SALES |
||
|
CURRENT YEAR |
YEAR |
CURRENT YEAR |
YEAR |
|||||
|
|
THOUSAND METRIC TONS |
|||||||
|
WHEAT |
|
|
|
|
|
|
|
|
|
HRW |
93.0 |
1,446.4 |
1,537.6 |
106.2 |
5,770.9 |
5,612.2 |
0.0 |
22.0 |
|
SRW |
9.6 |
499.2 |
461.1 |
5.5 |
1,087.8 |
1,663.4 |
0.0 |
145.0 |
|
HRS |
130.3 |
1,816.4 |
1,383.1 |
67.3 |
4,294.9 |
4,201.1 |
0.0 |
45.0 |
|
WHITE |
-11.0 |
2,456.5 |
1,055.8 |
179.5 |
3,098.5 |
2,859.8 |
10.1 |
36.1 |
|
DURUM |
0.0 |
100.8 |
187.1 |
0.0 |
488.9 |
623.8 |
0.0 |
0.0 |
|
TOTAL |
221.9 |
6,319.3 |
4,624.6 |
358.5 |
14,741.0 |
14,960.3 |
10.1 |
248.1 |
|
BARLEY |
0.0 |
13.7 |
30.2 |
0.0 |
16.9 |
29.5 |
0.0 |
12.5 |
|
CORN |
1,437.7 |
28,661.5 |
9,867.0 |
1,464.3 |
16,720.6 |
9,434.3 |
0.0 |
757.0 |
|
SORGHUM |
190.9 |
3,219.2 |
514.1 |
74.3 |
2,059.5 |
615.3 |
0.0 |
478.0 |
|
SOYBEANS |
908.0 |
14,561.1 |
7,240.6 |
2,040.0 |
41,114.9 |
23,172.9 |
326.0 |
1,217.6 |
|
SOY MEAL |
337.4 |
2,822.8 |
2,963.5 |
212.1 |
3,464.7 |
3,024.5 |
60.0 |
78.9 |
|
SOY OIL |
11.1 |
247.9 |
144.2 |
49.2 |
254.3 |
320.2 |
0.0 |
0.6 |
|
RICE |
|
|
|
|
|
|
|
|
|
L G RGH |
1.2 |
202.9 |
327.4 |
0.0 |
787.0 |
677.9 |
0.0 |
0.0 |
|
M S RGH |
0.0 |
15.6 |
14.9 |
0.6 |
13.3 |
15.9 |
0.0 |
0.0 |
|
L G BRN |
1.6 |
10.5 |
20.8 |
0.6 |
22.7 |
19.9 |
0.0 |
0.0 |
|
M&S BR |
0.3 |
45.3 |
43.4 |
0.2 |
50.7 |
15.8 |
0.0 |
0.0 |
|
L G MLD |
5.0 |
72.2 |
149.4 |
2.9 |
298.0 |
491.9 |
0.0 |
0.0 |
|
M S MLD |
4.8 |
171.5 |
163.8 |
14.8 |
211.0 |
261.3 |
0.0 |
0.0 |
|
TOTAL |
12.9 |
518.1 |
719.7 |
19.2 |
1,382.7 |
1,482.8 |
0.0 |
0.0 |
|
COTTON |
|
THOUSAND RUNNING BALES |
||||||
|
UPLAND |
326.0 |
6,066.2 |
7,420.8 |
274.6 |
5,798.0 |
4,438.6 |
50.3 |
846.3 |
|
PIMA |
35.9 |
243.1 |
207.8 |
10.3 |
352.7 |
180.1 |
0.4 |
1.1 |
Terry Reilly
Senior Commodity Analyst – Grain and Oilseeds
Futures International
One Lincoln Center
18 W 140 Butterfield Rd.
Oakbrook Terrace, Il. 60181
W: 312.604.1366
ICE IM: treilly1
Skype: fi.treilly

Trading of futures, options, swaps and other derivatives is risky and is not suitable for all persons. All of these investment products are leveraged, and you can lose more than your initial deposit. Each investment product is offered only to and from jurisdictions where solicitation and sale are lawful, and in accordance with applicable laws and regulations in such jurisdiction. The information provided here should not be relied upon as a substitute for independent research before making your investment decisions. Futures International, LLC is merely providing this information for your general information and the information does not take into account any particular individual’s investment objectives, financial situation, or needs. All investors should obtain advice based on their unique situation before making any investment decision. The contents of this communication and any attachments are for informational purposes only and under no circumstances should they be construed as an offer to buy or sell, or a solicitation to buy or sell any future, option, swap or other derivative. The sources for the information and any opinions in this communication are believed to be reliable, but Futures International, LLC does not warrant or guarantee the accuracy of such information or opinions. Futures International, LLC and its principals and employees may take positions different from any positions described in this communication. Past results are not necessarily indicative of future results.