

MARKET DATA
European Gas, Power & Emissions
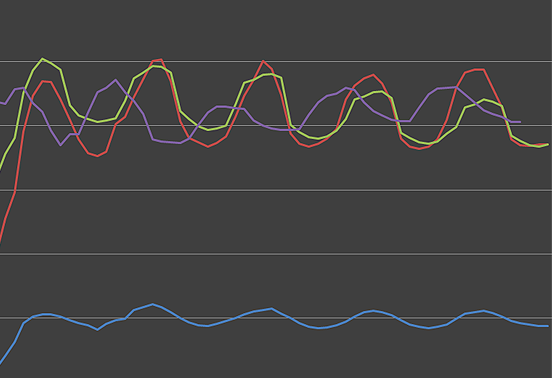
70 daily forward curves for European power, natural gas hubs and emissions, from the major western markets to Central, Eastern and Southeast Europe.
Coverage
- Power: base and peak curves for 25+ national markets across Western, Central, Eastern and Southeast Europe, the Nordics and Great Britain
- Gas: the main northwest European and UK trading hubs, plus Central European hubs
- Emissions: carbon allowance curves
Common questions
Do you cover Eastern Europe?
Yes. Coverage includes Central, Eastern and Southeast European power markets that are thinly covered elsewhere.
Base and peak?
Both, where the market trades them.
DELIVERY & ACCESS
Included with every subscription
- Daily intraday and end-of-day curves
- REST API with per-user keys
- Excel add-in
- Browser file downloads, FTPES and email
- Historical curves at no extra charge
- Priced by complex, not by curve
Quality Data. Reliable Service. Affordable Price.
Ask for a trial or the full coverage list for any complex.