

MARKET DATA
North American Natural Gas Implied Volatilities
Daily implied volatility curves for 28 major North American gas locations, for option pricing, risk and valuation.
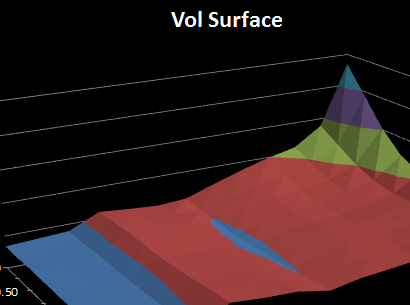
Coverage
- The benchmark plus key points in the Gulf Coast, Midcontinent, Northeast, Midwest, Rockies, Permian and California markets
- Straddles included
Common questions
Which locations have vol curves?
The 28 most actively traded points, from the benchmark to the major regional hubs.
Can I pair them with the forward curves?
Yes. Each vol curve lines up with the matching basis forward curve.
DELIVERY & ACCESS
Included with every subscription
- Daily intraday and end-of-day curves
- REST API with per-user keys
- Excel add-in
- Browser file downloads, FTPES and email
- Historical curves at no extra charge
- Priced by complex, not by curve
Quality Data. Reliable Service. Affordable Price.
Ask for a trial or the full coverage list for any complex.