

MARKET DATA
Gas/Power Correlations
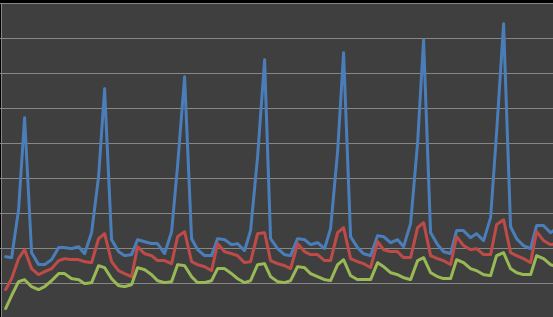
Forward correlation curves for 15 key power and gas pairs, for spark spread options, tolling and generation asset valuation.
Coverage
- 15 power and gas pairs
- Major power hubs paired with their regional gas supply points
Common questions
Who uses these?
Desks valuing generation, tolls and spread options, where the gas-to-power link drives value.
SPECIFICATIONS
At a glance
| Prices | Mid, bid and ask for every curve |
| Refresh | Every 15 minutes through the trading day, final at end of day |
| Publication | End-of-day files; the API, email and FTP carry identical numbers |
| Delivery | Email, secure FTP (FTPES), REST API (JSON or CSV), Excel add-in and Python client |
| Access | Per-user API keys, set up the same day a user is added |
| Historical data | Daily history back to February 2013, included free with every subscription |
| Corrections | We aim to correct any error within one business day and can often republish within the hour |
| Licensing | Licensed by product complex, not per curve: every curve in the complex is included |
DELIVERY & ACCESS
Included with every subscription
- Daily intraday and end-of-day curves
- REST API with per-user keys
- Excel add-in
- Browser file downloads, FTPES and email
- Historical curves at no extra charge
- Priced by complex, not by curve
Quality Data. Reliable Service. Affordable Price.
Ask for a trial or the full coverage list for any complex.